HAL Id: hal-03135025
https://hal.archives-ouvertes.fr/hal-03135025
Submitted on 10 Feb 2021
HAL is a multi-disciplinary open access
archive for the deposit and dissemination of sci-entific research documents, whether they are
pub-L’archive ouverte pluridisciplinaire HAL, est destinée au dépôt et à la diffusion de documents scientifiques de niveau recherche, publiés ou non,
Thermal conductivity of benzothieno-benzothiophene
derivatives at the nanoscale
Magatte Gueye, Alexandre Vercouter, Rémy Jouclas, David Guérin, Vincent
Lemaur, Guillaume Schweicher, Stéphane Lenfant, Aleandro Antidormi, Yves
Geerts, Claudio Melis, et al.
To cite this version:
Magatte Gueye, Alexandre Vercouter, Rémy Jouclas, David Guérin, Vincent Lemaur, et al.. Thermal conductivity of benzothieno-benzothiophene derivatives at the nanoscale. Nanoscale, Royal Society of Chemistry, 2021, 13 (6), pp.3800-3807. �10.1039/D0NR08619C�. �hal-03135025�
Thermal conduc.vity of benzothieno-benzothiophene deriva.ves at
the nanoscale
Maga$e N. Gueye,a,# Alexandre Vercouter,b,# Rémy Jouclas,c David Guérin,a
Vincent Lemaur,b Guillaume Schweicherc,*,c Stéphane Lenfant,a
Aleandro AnHdormi,d Yves Geerts,c,e Claudio Melis,f
Jérôme Cornilb,* and Dominique Vuillaumea,* a) Ins'tute for Electronics Microelectronics and Nanotechnology (IEMN), CNRS, Av. Poincaré, Villeneuve d'Ascq, France. b) Laboratory for Chemistry of Novel Materials, University of Mons, Place du Parc 20, Mons, Belgium. c) Laboratoire de Chimie des Polymères, Faculté des Sciences, Université Libre de Bruxelles (ULB), Boulevard du Triomphe, 1050, Brussels, Belgium. d) Catalan Ins'tute of Nanoscience and Nanotechnology (ICN2), CSIC and BIST, Campus UAB, Bellaterra, 08193, Barcelona, Spain. e) Interna'onal Solvay Ins'tutes for Physics and Chemistry, Brussels, Belgium. f) Dipar'mento di Fisica, Universita di Cagliari, CiWadella Universitaria, 09042 Monserrato (Ca), Italy. We study by scanning thermal microscopy the nanoscale thermal conductance of films (40-400 nm thick) of [1]benzothieno[3,2-b][1]benzothiophene (BTBT) and 2,7-dioctyl[1]benzothieno[3,2-b][1]benzothiophene (C8-BTBT-C8). We demonstrate that the out-of-plane thermal conduc'vity is significant along the interlayer direc'on, larger for BTBT (0.63 ± 0.12 W m-1 K-1
) compared to C8-BTBT-C8 (0.25 ± 0.13 W m-1 K-1). These results are supported by molecular dynamics
calcula'ons (Approach to Equilibrium Molecular Dynamics method) performed on the corresponding molecular crystals. The calcula'ons point to significant
thermal conduc'vity (3D-like) values along the 3 crystalline direc'ons, with anisotropy factors between the crystalline direc'ons below 1.8 for BTBT and below 2.8 for C8-BTBT-C8, in deep contrast with the charge transport proper'es featuring a two-dimensional character for these materials. In agreement with the experiments, the calcula'ons yield larger values in BTBT compared to C8-BTBT-C8 (0.6-1.3 W m-1 K-1 versus 0.3-0.7 W m-1 K-1, respec'vely). The weak thickness
dependence of the nanoscale thermal resistance is in agreement with a simple analy'cal model.
Keywords: thermal conducHvity, scanning thermal microscopy (SThM), approach
to equilibrium molecular dynamics (AEMD), organic semiconductor, organic thermoelectricity.
INTRODUCTION.
Organic materials have recently aWracted a great interest for poten'al thermoelectric applica'on because commercial modules are built with materials such as bismuth telluride (Bi2Te3)-based alloys1 which are toxic, expensive, and
energy-consuming for processing. The candidates range from polymers (like PEDOT:PSS, PEDOT:OTf, and other deriva'ves) with high electrical conduc'vity and Seebeck coefficient (up to ∼5,000-6,000 S cm-1 and ∼1 mV K-1),2-5 down to
self-assembled monolayers and single molecule junc'ons (based mainly on alkyl chains, oligo(phenylene ethynylene)s, benzene, C60,…).6-13 In the laWer case,
quantum interference effects can be exploited to tailor and op'mize the thermoelectric proper'es of the molecules.14-17 In contrast to the charge
transport proper'es, the thermal conduc'vity (
κ
) of thin films of small π-conjugated organic semiconductors (OSCs) appears less studied at both the experimental and theore'cal levels. The in-planeκ
of various molecular thin films (pentacene, TPD, Alq3, C60, PCBM, rubrene, DNTT, ….)4, 18-26 has beenmeasured in the range 0.1 - 0.8 W m-1 K-1 at the macroscale (ac-calorimetry, 3ω
Joule hea'ng, 'me domain thermo-reflectance….). Only a very few reports have been published on the out-of-plane
κ
of these organic materials at the nanoscale, e.g. using the scanning thermal microscope (SThM).27, 28 On thetheore'cal side, the predic'on of
κ
for OSCs and the defini'on of structure-property rela'onships is also scarcely addressed. Theκ
values can be es'mated by models29 based on: (i) collec've excita'ons of phonons via the resolu'on ofthe Boltzmann Transport Equa'on (BTE); (ii) atomic displacements via Molecular Dynamics (MD) approaches such as the Green-Kubo formalism or the Non Equilibrium Molecular Dynamics method (see below). The BTE approach is known to be far much prohibi've in terms of computa'onal cost than MD-based techniques. Thus,
κ
of a few molecules (pentacene, C60, PCBM, H2Pc, TPD,..)30-38have been essen'ally calculated by various methods belonging to the “MD-class” in order to es'mate the anisotropy of
κ
along the long axis of the molecules versus in the perpendicular intralayer direc'ons.In this work, we measure by SThM the out-of-plane
κ
at the nanoscale of thin films (40-400 nm thick) of [1]benzothieno[3,2-b][1]benzothiophene (BTBT) and 2,7-dioctyl[1]benzothieno[3,2-b][1]benzothiophene (C8-BTBT-C8).39, 40 Thesemolecules have promising performances for organic electronics with reproducible transistor hole mobili'es in excess of 10 cm2 V-1 s-1 and up to ∼ 200 cm2 V-1 s-1 at
the local scale.40, 41 Since their thermoelectric proper'es were not inves'gated
experimentally up to now, this has s'mulated the present experimental and theore'cal works to determine the structure-property rela'onships of BTBT deriva'ves, especially the role of alkyl chains on the thermal transport. We demonstrate (SThM) that
κ
BTBT = 0.63 ± 0.12 W m-1 K-1 is larger thanκ
C8-BTBT-C8 =0.25 ± 0.13 W m-1 K-1. The nanoscale thermal resistance is weakly dependent on
the film thickness, as predicted by a simple analy'cal model of the constric'on thermal resistance for a surface coated by a thin film. The experimental results are supported by the theore'cal es'mates of
κ
obtained by the AEMD (Approach to the Equilibrium Molecular Dynamics) method.42 We findκ
along the long c-axis of the molecules larger for BTBT (1.04 W m-1 K-1) than for C8-BTBT-C8 (0.72 W
m-1 K-1). The results also point to a decrease of
κ
in the a-b plane upon alkyla'on(from 0.6-1.3 W m-1 K-1 for BTBT to 0.26-0.33 W m-1 K-1 for C8-BTBT-C8).
RESULTS.
Scanning thermal microscopy results.
Figure 1 shows the typical topographic and thermal voltage images of a C8-BTBT-C8 film prepared by spin-coa'ng (see Methods). The organic thin film has a staircase topography (Fig. 1-a, height profile Fig. 1-c, red curve) with an
incomplete surface coverage leaving apparent several zones of the underlying Si/ SiO2 substrate. The same type of "staircase" topography is observed for all
samples (Figs. S1 and S2 in the ESI), in agreement with previous results.43 In
contrast, the SThM thermal voltage (Fig. 1-b) shows a featureless structure (Fig. 1-c, blue curve) for all samples (Figs. S1 and S2 in the ESI). The thermal voltage
VSThM is related to the thermal resistance of the sample by:
(1)
where Tsample is the temperature of the surface sample, Tamb the ambient
temperature, Rth the thermal resistance of the sample and the thermal flux.
We analyzed the SThM image to determine the thermal resistance of the films at various loca'ons with various thicknesses t, taking the thermal resistance of the Si/SiO2 substrate as a reference (Fig. 1-d). Figure 1. (a) Topographic (10 μm x 10 μm) and (b) SThM thermal voltage (at the output of the Wheatstone bridge, 3ω-SThM method) images of a C8-BTBT-C8 film VSThM∝ T
(
sample−Tamb)
∝ Rth!Q !Qspin-coated on Si/SiO2 substrate, (c) height (red) and thermal voltage profiles
(blue). (d) SchemaHc of the nanoscale SThM measurement. On the substrate, the thermal resistance is Rth-ox=Rt-ox+Rsub, with Rt-ox
the thermal resistance of the Hp-SiO2 interface and Rsub the thermal resistance of the substrate. Over the organic
domains, we have Rth-org=Rt-org+Rorg(t)+Rorg-ox+Rsub, with Rt-org the thermal
resistance of the Hp-organic interface, Rorg(t) the thermal resistance of the
organic film of thickness t and Rorg-ox the thermal resistance of the organic-oxide
interface (Fig. 1-d).
We determined
κ
using the null-point method, NP-SThM.44 This differen'almethod is suitable to remove the parasi'c contribu'ons (air conduc'on, etc…). When the 'p contacts the sample surface (C), both the sample and parasi'c thermal contribu'ons are involved, whereas, just before physical 'p contact (non contact, NC), only the parasi'c thermal contribu'ons are involved. We measured the thermal voltage VSThM-z traces at several places on the organic films and on
the substrate zones. The 'p temperature is determined from VSThM (see the ESI).
Figure 2 show 25 typical 'p temperature versus distance (z-trace) curves measured on the C8-BTBT-C8 domain and on the nearby apparent Si/SiO2
substrate (circled bullets on the SThM images in the insets). When approaching the heated 'p to the surface, the 'p temperature decreases gradually because the heat transfer through the air gap is increased. At contact, we observe a sudden decrease from TNC to TC
, due to the addi'onal heat flux through the 'p-sample contact. Figure 2-c shows the TC versus TNC-TC curves for the C8-BTBT-C8
and BTBT samples and on the apparent substrate zone, where TC and TNC are the
Figure 2. 25 Hp temperature versus Hp verHcal displacement curves (z-trace,
approach, 0 corresponds to the Hp retracted) measured at VDC
= 0.6 V on (a) a C8-BTBT-C8 domain (sample #5), (b) on the Si/SiO2 substrate (as indicated by the
circled bullets). (c) Temperature jump TNC-TC versus temperature at Hp contact TC
for C8-BTBT-C8 (◆), BTBT (●) and the Si/SiO2 substrate (◼). The increasing TC
corresponds to a supply voltage VDC from 0.6 - 0.9 V (by step of 0.1 V) of the Wheatstone bridge (0.6 - 1 V, step of 0.1 V on the substrate). Solid lines are the linear fits. Each data point (C8-BTBT-C8 and BTBT) is the average of 3 measurements at 3 different locaHons (25 VSThM-z traces at each locaHon). The data points for the substrate are averaged from the data acquired on the 2 samples.
The thermal conduc'vity is determined using the following rela'on:44
(2)
where α and β are calibrated parameters related to the SThM equipment and 'p (Fig. S3 in the ESI) and Tamb the room temperature (α = 25.6 W/m.K, β = 21.6 K/K
and Tamb = 22.5 °C). From a linear fit on these data, we get:
κ
C8-BTBT-C8 = 0.25 ±0.13 W m-1 K-1,
κ
BTBT = 0.63 ± 0.12 W m-1 K-1 andκ
sub = 1.57 ± 0.43 W m-1 K-1. Akey finding is that the thermal conduc'vity of BTBT is larger than that of C8-BTBT-C8, in full consistency with our AEMD simula'ons (see below). For the Si/SiO2
substrate, we found a value close to that of bulk SiO2, in agreement with previous
measurements by NP-SThM44 showing that the effec've
κ
is that of bulk SiO2(see Fig. 6-b in Ref. 44 and Fig. S4) if the SiO2 thickness is larger than ∼ 100 nm
(here 200-500 nm).
The ra'o of the thermal voltage measured on the organic domain over that on the substrate (Fig. 1), VSThM-org/VSThM-sub is related to the ra'o of the
corresponding thermal resistance of each zone. For the Si/SiO2 substrate, the
constric'on thermal resistance45 is Rsub=1/4r
κox
= 9x10⁶ K W-1 withκox
the"bulk" SiO2 value (1.4 W m-1 K-1) and r is the radius of the SThM 'p thermal
contact (es'mated to be ≈ 20 nm, see the ESI). In order to determine the Rorg(t)
from this SThM voltage ra'o, we need to es'mate the various interfacial resistances (Kapitza resistance)46 which cannot be directly measured here.
Reported values for a large variety of interfaces27, 47-54 range typically between
10-9 and 10-6 m2 K W-1. For simplicity, we consider the lower limit value for all
interfaces. In that case, the interface thermal resistances are negligible (8x10⁵ K
W-1) compared to Rsub and Rorg (Rsub=1/4r
κox
= 9x10⁶ K W-1, Rorg=1/4rκorg
=TC−Tamb= α1 κ +β ⎡ ⎣ ⎢ ⎤ ⎦ ⎥ T
(
NC−TC)
2-5x10⁷ K W-1, considering the values of
κ
org determined above). In thisoversimplified case, the ra'o of the thermal voltage measured on the organic domain versus over the substrate is given by , assuming
the same thermal flux on the oxide and the organic domain (see the ESI), where is the effec've constric'on thermal resistance measured by the sharp SThM 'p at the surface of the organic thin film. We consider a simple analy'cal model derived by Dryden55 for film with t/r>2 (here t > 40 nm):
(3)
The first term on the right-hand side stands for the constric'on thermal resistance of the bulk organic film (t → ∞) and the second term represents the effect of the underlying substrate covered by the film of thickness t. Figure 3 shows the measured obtained from VSThM-org/VSThM-sub ra'os picked up at
various loca'ons on the organic films with various thicknesses (Fig. 1, Figs. S1 and S2, in the ESI) and on the underlying substrate, taking Rsub=1/4r
κ
ox = 9x10⁶ K W-1. VSThM−org VSThM−sub= Rorg* (t) Rsub !Q Rorg* (t) Rorg* (t)= 1 4rκorg− 1 2πrκorg r t ⎛ ⎝⎜ ⎞ ⎠⎟ln 2 1+κorg κsub ⎛ ⎝ ⎜ ⎞ ⎠ ⎟ Rorg* (t)Figure 3. EffecHve constricHon thermal resistance measured at the surface of the organic film for the C8-BTBT-C8 samples (closed symbols) and for the BTBT samples (semi-open symbols). Data and fit (lines): red = sample #1, blue = sample #2, green = sample #3, and orange = sample #4 as defined in the ESI. For t → ∞, tends to saturate at a larger value for C8-BTBT-C8 than for BTBT although the difference is weak. This trend is in agreement with the NP-SThM determina'on that
κBTBT
>κC8-BTBT-C8
. From the fits of Eq. 3 (solid lines in Fig. 4), we obtain a mean value (see the ESI)κBTBT
= 1.37 ± 0.01 W m-1 K-1 andκC8-BTBT-C8 = 1.35 ± 0.01 W m-1 K-1 which are not significantly different. This implies that, even though the same trends are observed as with the NP-SThM method, this image analysis approach is perturbed by the interfacial thermal resistance, which more or less masks the actual values of the organic film thermal resistance. Previous works 27, 28, 49, 50, 54
also reported SThM 'p-organic materials and organic-SiO2 interfacial thermal resistances larger than 107 K W-1 (or > ∼ 10-8 m2 K W-1), i.e., larger than Rorg of our C8-BTBT-C8 and BTBT films.
Rorg* (t)
Theory.
We use the Approach to the Equilibrium Molecular Dynamics (AEMD) method42
to compute the la~ce
κ
. We ignored the contribu'on of the electronicκ
at this stage because the thermal transport is barely controlled by electrons in most neutral and weakly doped organic semiconductors (OSCs).56 This argument issupported by the newly developed molecular Wiedemann-Franz model57 which
predicts an electronic contribu'on to the heat transport smaller by several orders of magnitude than the corresponding la~ce contribu'on. In brief, the key steps of the AEMD methodology are the following: (i) applying a perfectly monitored thermal pulse on a simula'on box; (ii) recovering the ini'al thermodynamic equilibrium during a fast transient regime; (iii) fi~ng the 'me-decaying temperature difference between the right and le• parts of the system from a reliable solu'on of the one-dimensional heat equa'on in order to
evaluate the thermal diffusivity, D.58 This alterna've scheme has the benefit to be far less 'me-consuming than the previously cited methods due to the rapid dissipa'on of the thermal gradient. Then
κ
=DρCP is finally obtained, provided the density, ρ, and the specific heat, CP, of the system are known (see details in the ESI). It is also of prime importance to account for the size-dependence of theκ
values deduced from this approach since phonons having a mean free path larger than the cell dimension do not effec'vely contribute toκ
. An extrapola'on procedure is thus needed to get rid of these size effects59and to extract a quasi-length-free la~ce
κ
from the linear regression of 1/κ
versus 1/L (L the length of the box size along the direc'on of heat propaga'on).∂T ∂t = D ∂
2T
! Figure 4. Inverse of the lance thermal conducHvity as a funcHon of the inverse of the simulaHon box length along direcHons a, b and c for (a) BTBT and (b) C8-BTBT-C8. Each inset represents the molecular packing of BTBT and C8-BTBT-C8 in the ab plane. For sake of clarity, we did not represent the alkyl chains in (b). The two compounds crystallize into a monoclinic structure (a = 5.854 Å, b = 7.960 Å, c = 11.809 Å, α = 105.990° for BTBT and a = 5.927 Å, b = 7.880 Å, c = 29.180 Å, β = 92.443° for C8-BTBT-C8; respecHvely); both of them exhibit a very similar layered herringbone packing,60 as shown in the insets.
a
b
Figure 4 display the inverse of the calculated la~ce
κ
as a func'on of the inverse of the super cell length. The linear extrapola'on procedure providesκ
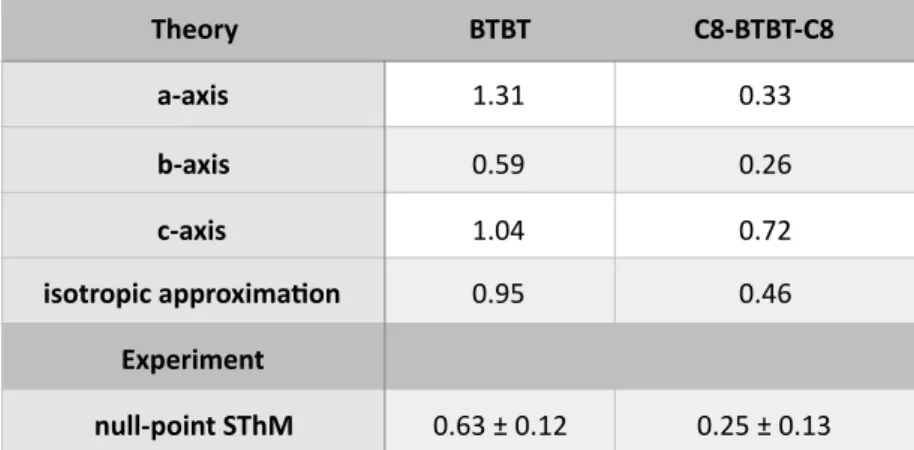
values of 1.31, 0.59 and 1.04 W m-1 K-1 along direc'ons a, b and c for BTBT and0.33, 0.26 and 0.72 W m-1 K-1 along the same direc'ons for C8-BTBT-C8 (Table 1).
There is a fairly good quan'ta've agreement between experimental measurements and theore'cal es'mates. Interes'ngly, the calcula'ons indicate that the overall calculated conduc'vity (along the 3 crystal axes) of BTBT is higher than for C8-BTBT-C8 (Table 1), in full consistency with the experimental measurements probing essen'ally heat transport along the c axis.
Table 1. Calculated and measured thermal conducHvity values (W m-1 K-1)
DISCUSSION.
Since no theore'cal and experimental data of the out-of-plane
κ
was previously reported for these BTBT deriva'ves, we compare our values with other results obtained for various OSCs. The measured nanoscale out-of-planeκ
C8-BTBT-C8 = 0.25± 0.13 W m-1 K-1, is on par with values reported for other small molecule thin
films by SThM: 0.15-0.20 W m-1 K-1 for methylstyryl-benzene,28 0.15-0.4 W m-1 K-1
for CuPc (Cu-phthalocyanine) and 0.15-0.25 W m-1 K-1 for PbCu.27 They are also
consistent with the corresponding values obtained by characteriza'on methods Theory BTBT C8-BTBT-C8 a-axis 1.31 0.33 b-axis 0.59 0.26 c-axis 1.04 0.72 isotropic approxima.on 0.95 0.46 Experiment null-point SThM 0.63 ± 0.12 0.25 ± 0.13
at the macroscale on rubrene (0.07 W m-1 K-1)23 and DNTT (0.45 W m-1 K-1).24 The
experimental out-of-plane
κ
BTBT = 0.63 ± 0.12 W m-1 K-1 lies at the highest limit ofreported values: 0.45 W m-1 K-1 for DNTT24 (to the best of our knowledge and
excluding the highly unusual value of 21 W m-1 K-1
reported for crystal of TIPS-pentacene61, 62).
The calcula'ons of the la~ce
κ
were performed on single crystals while the SThM measurement was carried out on polycrystalline samples containing a certain amount of disorder. It is also known (X-ray diffrac'on) that a disordered layer of less than ca. 10 nm exists at the SiO2/BTBT interfaces.39 To cope with this"experimental" disorder we compare the measured values with an effec've isotropic
κeff
defined as63 where the in-planeκ
is . Thecalculated values are given in Table 1. A ra'o of 2-2.5 between the thermal conduc'vi'es of BTBT and C8-BTBT-C8 is observed at both the experimental and theore'cal level. For both materials, the agreement between the evaluated
κeff
and the measurements (Table 1) is excellent, suppor'ng the existence of a thin disordered layer at the SiO2/BTBT interface with a lower thermal conduc'vity (i.e. ab-plane). We do find a rather isotropic (3D) behavior of the heat propaga'on in the two deriva'ves in deep contrast with the charge transport proper'es featuring a two-dimensional character in presence of a herringbone arrangement;60, 64, 65note that a significant thermal conduc'vity along the three crystallines axes has also been reported theore'cally for the DNTT single crystal36. The
κ
ra'os for a/b, c/a and c/b are respec'vely 2.22, 0.79 and 1.76 for BTBT and 1.27, 2.18 and 2.77 for C8-BTBT-C8. Morever, we evidence a no'ceable drop in the ab-plane
κ
when octyl chains are added on each side of the aroma'c cores, with anisotropic factors of ∼ 3.97 and ∼ 2.27. This complements the theore'calκeff = κcκab κab= κaκb κaC 0/κ a C 8 κ b C 0/κ b C 8
study of Shi et al. 32 showing that
κ
is marginally affected by the presence ofterminal saturated chains in Cn-BTBT-Cn (with n = 8;10;12). It is worth stressing that the drop in thermal conduc'vity upon addi'on of saturated chains has been also clearly observed in recent
κ
measurements performed on DNTT and C8-DNTT-C8 thin films in the a-b plane, and fully supported again by our AEMD calcula'ons.66To gain a deeper insight into the underlying physical mechanisms, we explore the spa'al character of the vibra'onal modes, by es'ma'ng their par'cipa'on ra'o (PR).67 This parameter is a quan'ta've measure of the spa'al
extension of vibra'ons, allowing to classify them into extended (large PR) and localized modes (PR ~ 0). It has been shown68 that extended modes are
generally more effec've in transpor'ng heat across the material than localized modes. The details of the calcula'ons are given in the ESI. Figure 5. EsHmated ParHcipaHon RaHo (PR) as a funcHon of the vibraHonal frequency for BTBT (blue) and C8-BTBT-C8 (red). 0 0.05 0.1 0.15 0.2 0.25 0.3 0.35 0.4 0.45 0.5 0 500 1000 1500 2000 2500 3000 PR ν (cm-1) BTBT C8-BTBT-C8
The par'cipa'on ra'o of vibra'ons in BTBT and C8-BTBT-C8 are shown in Fig. 5 as a func'on of their frequency. We observe that PR in BTBT takes larger values than C8-BTBT-C8 over the whole frequency spectrum. This shows that BTBT hosts vibra'onal modes are spa'ally more extended than those in C8-BTBT-C8. Hence, BTBT alkyla'on leads to a strong localiza'on of the vibra'onal modes and consequently to a strong reduc'on of the overall thermal conduc'vity.
CONCLUSION.
In summary, we demonstrate that the thermal conduc'vity of BTBT, κBTBT = 0.63 ±
0.12 W m-1 K-1 is larger than for C8-BTBT-C8, κC8-BTBT-C8 = 0.25 ± 0.13 W m-1 K-1. The
nanoscale thermal resistance is weakly dependent on the film thickness, as predicted by a simple analy'cal model of the constric'on thermal resistance for a surface coated by a thin film. The experimental results are further supported by the theore'cal es'mates of the thermal conduc'vity obtained by the AEMD (Approach to the Equilibrium Molecular Dynamics) method. Moreover, we have not only demonstrated the drop of the thermal conduc'vity upon introduc'on of saturated chains but we have also provided a clear ra'onale based on the degree of delocaliza'on of the intermolecular vibra'onal modes. Finally, our calcula'ons point to significant thermal conduc'vity (3D-like) values along the 3 crystalline direc'ons, with anisotropy factors between the crystalline direc'ons below 1.8 for BTBT and below 2.8 for C8-BTBT-C8, in deep contrast with the charge transport proper'es featuring a two-dimensional character for these materials.
METHODS.
Synthesis and sample fabricaAon. BTBT and C8-BTBT-C8 were synthesized
The thin films were deposited by spin-coa'ng on thermal SiO2/Si-n+ according to previously reported methods.39, 43 Nine
samples (5 C8-BTBT-C8, 4 BTBT) were prepared using various spin-coa'ng parameters to vary the film thickness (see the ESI).
Scanning Thermal Microscope (SThM). SThM71, 72 were carried out with a Bruker
ICON machine equipped with the Anasys SThM module. All measurements were done at room temperature in an air-condi'oned laboratory (Tamb = 22.5 °C,
rela've humidity of 35-40 %). In the scanning mode, the topography and thermal voltage were recorded simultaneously. We used both the DC method or the 3ω-SThM.73 The thermal conduc'vity is determined by using the null-point SThM
method (see the ESI).44
CalculaAons of the laDce thermal conducAvity. All MD simula'ons have been
performed in the LAMMPS so•ware package74 by means of the Op'mized
Poten'als for Liquid Simula'ons All-Atoms (OPLS-AA) force-field (see the ESI). In addi'on, we also es'mated the par'cipa'on ra'o to characterize the vibra'onal proper'es of both BTBT and C8-BTBT-C8. This parameter is a quan'ta've measure of the spa'al extension of vibra'ons (see the ESI).
ASSOCIATED CONTENT
Electronic Supplementary Informa'on (ESI) is available:
Sample fabrica'on, SThM methods, theore'cal methods, addi'onal SThM images, NP-SThM calibra'on, es'ma'on of the constric'on thermal resistance of the Si/SiO2 substrate, es'ma'on of the radius of the thermal contact between 'p and surface, fiWed parameters of Eq. 3.
AUTHOR CONTRIBUTIONS
M.N.G. prepared the samples, carried out and analyzed the SThM measurements with the help of D.G. and S.L., respec'vely. A.V. carried out the calcula'ons of the thermal conduc'vity under the supervision of V.L. and J.C.. R.J., G.S. and Y.G. synthesized and assessed purity of the materials. A.A. and C.M. carried out thecalcula'ons of the vibra'onal proper'es. D.V. conducted the project, analyzed the results and wrote the paper with the help of all the authors. All authors have given approval to the final version of the manuscript. # These authors (M.N.G. and A.V.) contributed equally to this work.
CONFLICTS OF INTEREST.
The authors declare no compe'ng financial interest.ACKNOWLEDGEMENTS.
M.G., D.G., S.L. and D.V. thank the ANR for financial support (ANR-16-CE05-0029). Y.G. is thankful to the Belgian Na'onal Fund for Scien'fic Research (FNRS) for financial support through research projects BTBT (# 2.4565.11), Phasetrans (# T. 0058.14), Pi-Fast (# T.0072.18), 2D to 3D (# 30489208), and DIFFRA (# U.G001.19). Financial supports from the French Community of Belgian (ARC # 20061) is also acknowledged. G.S. acknowledges postdoctoral fellowship support from the FNRS. The work in the Laboratory for Chemistry of Novel Materials was supported by the Consor'um des Équipements de Calcul Intensif (CÉCI), funded by the Fonds de la Recherche Scien'fique de Belgique (F.R.S.-FNRS) under Grant # 2.5020.11. J.C. and A.V. are FNRS research fellows.REFERENCES.
1. H. J. Goldsmid, in Semiconductors and Semimetals, ed. T. M. TriW, Elsevier, 2001, vol. 69, pp. 1-24. 2. O. Bubnova, Z. U. Khan, A. Mal', S. Braun, M. Fahlman, M. Berggren and X. Crispin, Nat. Mater., 2011, 10, 429-433. 3. M. N. Gueye, A. Carella, N. Massonnet, E. Yvenou, S. Brenet, J. Faure-Vincent, S. Pouget, F. Rieutord, H. Okuno, A. Benayad, R. Demadrille and J.-P. Simonato, Chem. Mater, 2016, 28, 3462-3468.4. B. Russ, A. Glaudell, J. J. Urban, M. L. Chabinyc and R. A. Segalman, Nature Reviews Materials, 2016, 1, 16050. 5. M. N. Gueye, A. Carella, J. Faure-Vincent, R. Demadrille and J.-P. Simonato, Progress in Materials Science, 2020, 108, 100616. 6. M. Paulsson and S. DaWa, Phys. Rev. B, 2003, 67, 241403(R). 7. P. Reddy, S.-Y. Jang, R. A. Segalman and A. Majumdar, Science, 2007, 315, 1568-1571. 8. J. A. Malen, P. Doak, K. Bahe', T. D. Tilley, R. A. Segalman and A. Majumdar, Nano Le$, 2009, 9, 1164-1169. 9. C. Evangeli, K. Gillemot, E. Leary, M. T. González, G. Rubio-Bollinger, C. J. Lambert and N. Agraït, Nano Le$, 2013, 13, 2141-2145. 10. T. Meier, F. Menges, P. Nirmalraj, H. Hölscher, H. Riel and B. Gotsmann, Phys. Rev. Le$., 2014, 113, 060801. 11. L. Rincon-Garcia, C. Evangeli, G. Rubio-Bollinger and N. Agraït, Chem. Soc. Rev., 2016, 45, 4285-4306. 12. L. Cui, S. Hur, Z. A. Akbar, J. C. Klöckner, W. Jeong, F. Pauly, S.-Y. Jang, P. Reddy and E. Meyhofer, Nature, 2019, 572, 628-633. 13. N. Mosso, H. Sadeghi, A. Gemma, S. Sangtarash, U. Drechsler, C. Lambert and B. Gotsmann, Nano Le$, 2019, 19, 7614-7622. 14. C. J. Lambert, Chem. Soc. Rev., 2015, 44, 875-888. 15. J. C. Klöckner, J. C. Cuevas and F. Pauly, Phys. Rev. B, 2017, 96, 245419. 16. R. Miao, H. Xu, M. Skripnik, L. Cui, K. Wang, K. G. L. Pedersen, M. Leijnse, F. Pauly, K. Wärnmark, E. Meyhofer, P. Reddy and H. Linke, Nano Le$, 2018, 18, 5666-5672. 17. P. Gehring, J. M. Thijssen and H. S. J. Van Der Zant, Nature Reviews Physics, 2019, 1, 381-396. 18. R. C. Yu, N. Tea, M. B. Salamon, D. Lorents and R. Malhotra, Phys. Rev. Le$., 1992, 68, 2050-2053.
19. N. Kim, B. Domercq, S. Yoo, A. Christensen, B. Kippelen and S. Graham, Appl. Phys. Le$., 2005, 87, 241908. 20. Y. Okada, M. Uno, Y. Nakazawa, K. Sasai, K. Matsukawa, M. Yoshimura, Y. Kitaoka, Y. Mori and J. Takeya, Phys. Rev. B, 2011, 83, 113305. 21. J. C. Duda, P. E. Hopkins, Y. Shen and M. C. Gupta, Phys. Rev. Le$., 2013, 110, 015902. 22. X. Wang, C. D. Liman, N. D. Treat, M. L. Chabinyc and D. G. Cahill, Phys. Rev. B, 2013, 88, 075310. 23. H. Zhang and J. W. Brill, J. Appl. Phys., 2013, 114, 043508. 24. X. Wang, K. D. Parrish, J. A. Malen and P. K. L. Chan, ScienHfic Reports, 2015, 5, 16095. 25. Y. Yao, M. Shahi, M. M. Payne, J. E. Anthony and J. W. Brill, J. Mater. Chem. C, 2016, 4, 8817-8821. 26. T. Nomoto, S. Imajo, S. Yamashita, H. Akutsu, Y. Nakazawa and A. I. Krivchikov, Journal of Thermal Analysis and Calorimetry, 2018, 135, 2831-2836. 27. D. Trefon-Radziejewska, J. Juszczyk, A. Fleming, N. Horny, J. S. Antoniow, M. Chirtoc, A. Kaźmierczak-Bałata and J. Bodzenta, SyntheHc Metals, 2017, 232, 72-78. 28. Y. Zhang, C. Zhang, D. Wei, X. Bai and X. Xu, CrystEngComm, 2019, 21, 5402-5409. 29. G. Fugallo and L. Colombo, Physica Scripta, 2018, 93, 043002. 30. D. Wang, L. Tang, M. Long and Z. Shuai, J. Phys. Chem. C, 2011, 115, 5940-5946. 31. J. Chen, D. Wang and Z. Shuai, Journal of Chemical Theory and Computa'on, 2012, 8, 3338-3347. 32. W. Shi, J. Chen, J. Xi, D. Wang and Z. Shuai, Chem. Mater, 2014, 26, 2669-2677. 33. L. Chen, X. Wang and S. Kumar, ScienHfic Reports, 2015, 5, 12763. 34. J. Y. Kim and J. C. Grossman, Nano Le$, 2016, 16, 4203-4209.
35. A. Giri and P. E. Hopkins, J. Phys. Chem. Le$., 2017, 8, 2153-2157. 36. X. Wang, J. Zhang, Y. Chen and P. K. L. Chan, Nanoscale, 2017, 9, 2262-2271. 37. H. Kojima, M. Nakagawa, R. Abe, F. Fujiwara, Y. Yakiyama, H. Sakurai and M. Nakamura, Chemistry Le$ers, 2018, 47, 524-527. 38. R. Sasaki, Y. Takahashi, Y. Hayashi and S. Kawauchi, J. Phys. Chem. B, 2020, 124, 881-889. 39. G. Gbabode, M. Dohr, C. Niebel, J.-Y. Balandier, C. Ruzié, P. Négrier, D. Mondieig, Y. H. Geerts, R. Resel and M. Sferrazza, ACS Appl. Mater. Interfaces, 2014, 6, 13413-13421. 40. Y. Tsutsui, G. Schweicher, B. ChaWopadhyay, T. Sakurai, J.-B. Arlin, C. Ruzié, A. Aliev, A. Ciesielski, S. Colella, A. R. Kennedy, V. Lemaur, Y. Olivier, R. Hadji, L. Sanguinet, F. Castet, S. Osella, D. Dudenko, D. Beljonne, J. Cornil, P. Samorì, S. Seki and Y. H. Geerts, Adv. Mater., 2016, 28, 7106-7114. 41. G. Schweicher, V. Lemaur, C. Niebel, C. Ruzié, Y. Diao, O. Goto, W.-Y. Lee, Y. Kim, J.-B. Arlin, J. Karpinska, A. R. Kennedy, S. R. Parkin, Y. Olivier, S. C. B. Mannsfeld, J. Cornil, Y. H. Geerts and Z. Bao, Adv. Mater., 2015, 27, 3066-3072. 42. C. Melis, R. DeWori, S. Vandermeulen and L. Colombo, The European Physical Journal B, 2014, 87, 96. 43. M. Dohr, H. M. A. Ehmann, A. O. F. Jones, I. Salzmann, Q. Shen, C. Teichert, C. R. xe, G. Schweicher, Y. H. Geerts, R. Resel, M. Sferrazza and O. Werzer, Sov Ma$er, 2017, 13, 2322-2329. 44. K. Kim, J. Chung, G. Hwang, O. Kwon and J. S. Lee, ACS Nano, 2011, 5, 8700-8709. 45. H. S. Carslaw and J. C. Jaeger, ConducHon of Heat in Solids, Oxford University Press, 1959. 46. P. L. Kapitza, J. Phys. (Moscow), 1941, 4, 181. 47. S. M. Lee and D. G. Cahill, J. Appl. Phys., 1997, 81, 2590-2595. 48. H.-K. Lyeo and D. G. Cahill, Physical Review B, 2006, 73, 234.
49. Z. Chen, W. Jang, W. Bao, C. N. Lau and C. Dames, Appl. Phys. Le$., 2009, 95, 161910. 50. M. D. Losego, M. E. Grady, N. R. SoWos, D. G. Cahill and P. V. Braun, Nature Materials, 2012, 11, 502-506. 51. F. Menges, H. Riel, A. Stemmer, C. Dimitrakopoulos and B. Gotsmann, Phys. Rev. Le$., 2013, 111, 205901. 52. R. Cheaito, J. T. Gaskins, M. E. Caplan, B. F. Donovan, B. M. Foley, A. Giri, J. C. Duda, C. J. Szwejkowski, C. Constan'n, H. J. Brown-Shaklee, J. F. Ihlefeld and P. E. Hopkins, Physical Review B, 2015, 91, 035432. 53. Z. Ding, J.-W. Jiang, Q.-X. Pei and Y.-W. Zhang, Nanotechnology, 2015, 26, 065703. 54. C. Evangeli, J. Spiece, S. Sangtarash, A. J. Molina Mendoza, M. Mucientes, T. Mueller, C. Lambert, H. Sadeghi and O. Kolosov, Adv. Electron. Mater., 2019, 7, 1900331. 55. J. R. Dryden, J. Heat Transfer, 1983, 105, 408-410. 56. D. Wang, W. Shi, J. Chen, J. Xi and Z. Shuai, Physical Chemistry Chemical Physics, 2012, 14, 16505-16520. 57. G. T. Craven and A. Nitzan, Nano Le$, 2019, 20, 989-993. 58. Y. He, I. Savić, D. Donadio and G. Galli, Phys. Chem. Chem. Phys., 2012, 14, 16209-16222. 59. D. P. Sellan, E. S. Landry, J. E. Turney, A. J. H. McGaughey and C. H. Amon, Phys. Rev. B, 2010, 81, 214305. 60. G. Schweicher, G. D'Avino, M. T. Ruggiero, D. J. Harkin, K. Broch, D. Venkateshvaran, G. Liu, A. Richard, C. Ruzié, J. Armstrong, A. R. Kennedy, K. Shankland, K. Takimiya, Y. H. Geerts, J. A. Zeitler, S. Fra'ni and H. Sirringhaus, Adv. Mater., 2019, 31, 1902407. 61. H. Zhang, Y. Yao, M. M. Payne, J. E. Anthony and J. W. Brill, Appl. Phys. Le$., 2014, 105, 073302.
62. J. W. Brill, M. Shahi, M. M. Payne, J. Edberg, Y. Yao, X. Crispin and J. E. Anthony, J. Appl. Phys., 2015, 118, 235501. 63. Y. S. Muzychka, M. M. Yovanovich and J. R. Culham, Journal of Thermophysics and Heat Transfer, 2004, 18, 45-51. 64. S. Haas, Y. Takahashi, K. Takimiya and T. Hasegawa, Appl. Phys. Le$., 2009, 95, 022111. 65. W. Xie, K. Willa, Y. Wu, R. Häusermann, K. Takimiya, B. Batlogg and C. D. Frisbie, Adv. Mater., 2013, 25, 3478-3484. 66. E. Selezneva, A. Vercouter and G. Schweicher, et al., to be submi$ed. 67. R. J. Bell, in Methods in Computa'onal Physics: Advances in Research and Applica'ons, ed. G. Gilat, Elsevier, 1976, vol. 15, pp. 215-276. 68. A. Cappai, A. An'dormi, A. Bosin, D. Narducci, L. Colombo and C. Melis, Physical Review Materials, 2020, 4, 035401. 69. M. Saito, I. Osaka, E. Miyazaki, K. Takimiya, H. Kuwabara and M. Ikeda, Tetrahedron Le$ers, 2011, 52, 285-288. 70. C. Grigoriadis, C. Niebel, C. Ruzié, Y. H. Geerts and G. Floudas, J. Phys. Chem. B, 2014, 118, 1443-1451. 71. A. Majumdar, Annu. Rev. Mater. Sci., 1999, 29, 505-585. 72. S. Gomès, A. Assy and P.-O. Chapuis, phys. stat. sol. (a), 2015, 212, 477-494. 73. S. Lefèvre and S. Volz, Rev. Sci. Instrum., 2005, 76, 033701. 74. S. Plimpton, Journal of Computa'onal Physics, 1995, 117, 1-19.
Thermal conduc.vity of benzothieno-benzothiophene deriva.ves at
the nanoscale
Maga$e N. Gueye,a,# Alexandre Vercouter,b,# Rémy Jouclas,c David Guérin,a
Vincent Lemaur,b Guillaume Schweicherc,*,c Stéphane Lenfant,a
Aleandro AnHdormi,d Yves Geerts,c,e Claudio Melis,f
Jérôme Cornilb,* and Dominique Vuillaumea,* a) Ins'tute for Electronics Microelectronics and Nanotechnology (IEMN), CNRS, Av. Poincaré, Villeneuve d'Ascq, France. b) Laboratory for Chemistry of Novel Materials, University of Mons, Place du Parc 20, Mons, Belgium. c) Laboratoire de Chimie des Polymères, Faculté des Sciences, Université Libre de Bruxelles (ULB), Boulevard du Triomphe, 1050, Brussels, Belgium. d) Catalan Ins'tute of Nanoscience and Nanotechnology (ICN2), CSIC and BIST, Campus UAB, Bellaterra, 08193, Barcelona, Spain. e) Interna'onal Solvay Ins'tutes for Physics and Chemistry, Brussels, Belgium. f) Dipar'mento di Fisica, Universita di Cagliari, CiWadella Universitaria, 09042 Monserrato (Ca), Italy.
Corresponding authors: dominique.vuillaume@iemn.fr ; guillaume.schweicher@ulb.ac.be ;
jerome.cornil@umons.ac.be
Suppor.ng informa.on
1. Sample fabrica'on 2. SThM measurements 3. Theore'cal methods 4. Addi'onal SThM images 5. NP-SThM calibra'on 6. Es'ma'on of the constric'on thermal resistance of the Si/SiO2 substrate7. Es'ma'on of the radius of the thermal contact between 'p and surface 8. FiWed parameters of Eq. 3.
1. Sample fabrica.on
The Si-n+(highly doped ∼10-3 Ω.cm)/SiO2 substrate (200 - 500 nm of thermal SiO2)
were first cleaned in CH2Cl2 (3mn, sonicated), in IPA (isopropyl alcohol) solu'on
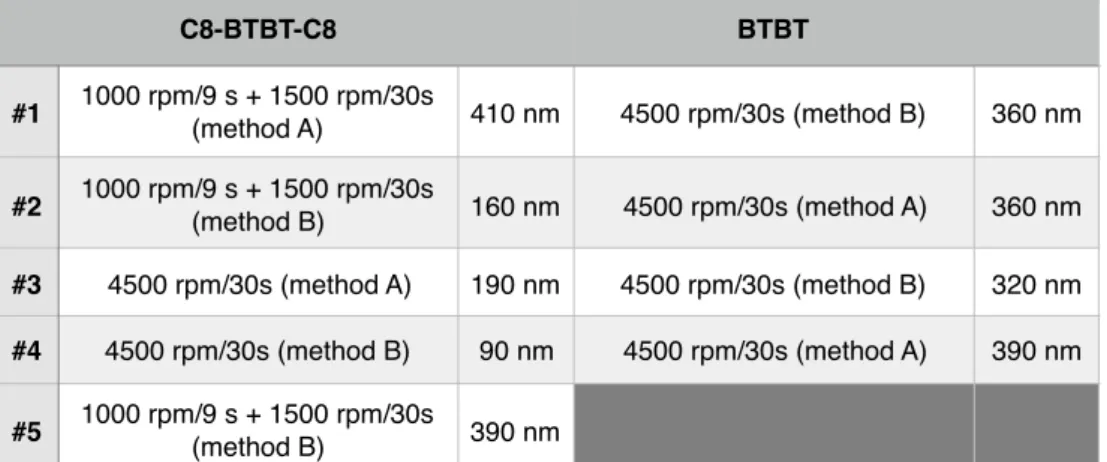
(3mn, sonicated) and then submiWed during 10 mn to UV-ozone cleaning. They were used immediately. The C8-BTBT-C8 and BTBT (scheme 1) solu'ons (5mg/mL in toluene for BTBT and 5 mg/mL in tetrahydrofuran for C8-BTBT-C8) were spin coated at 1000 rpm for 9s followed by 30 s at 1500 rpm, or directly at 4500 rpm for 30 s. We used two methods to deposit a drop of the solu'on onto the substrate: we dropped the solu'on on the substrate and started the spin-coater (method A) or we dropped the solu'on while the spin coater was already running (method B). Table S1 summarizes the spin-coa'ng condi'ons for the 9 samples. The films are not uniform and we have indicated the maximum thickness of the films as measured from AFM images (see Figs. S1 and S2). Table S1. Spin-coaHng parameters and maximum film thickness (rounded to the unit) esHmated from AFM measurements. C8-BTBT-C8 BTBT #1 1000 rpm/9 s + 1500 rpm/30s (method A) 410 nm 4500 rpm/30s (method B) 360 nm #2 1000 rpm/9 s + 1500 rpm/30s (method B) 160 nm 4500 rpm/30s (method A) 360 nm #3 4500 rpm/30s (method A) 190 nm 4500 rpm/30s (method B) 320 nm #4 4500 rpm/30s (method B) 90 nm 4500 rpm/30s (method A) 390 nm #5 1000 rpm/9 s + 1500 rpm/30s (method B) 390 nm
Scheme S1. Chemical structures: BTBT (leV) and C8-BTBT-C8 (right), Me=CH3.
2. SThM measurements
Topographic and thermal images. In the scanning mode, the topography and
thermal voltage were recorded simultaneously. We used both the DC method or the 3ω-SThM. The SThM 'p is a lithographed Pd wire, i.e. resistance, inserted in a Wheatstone bridge, which is supplied by a DC voltage, VDC. The 'p is used to heat
the sample (the higher the DC voltage, the higher the heat flux and the 'p temperature) and to measure the 'p/surface temperature, in the so-called ac've mode. The 'p resistance is measured by the Wheatstone bridge connected to a voltage amplifier. From this output SThM voltage, we deduced the 'p resistance, which is calibrated versus temperature. Thus, the SThM voltage recorded at the amplifier output can be converted to 'p/sample temperature. To minimize parasi'c contribu'ons (air conduc'on, radia'on) and thus increase the sensi'vity of the 'p/sample contribu'on, we also use the 3ω-SThM method,1, 2 in which the Wheatstone bridge is supplied by an AC voltage (0.2 V at 1 kHz) and we measure the third harmonic signal at the Wheatstone bridge output with a lock-in. Null-point SThM method. The null-point SThM3 was used at selected points on the organic films (organic domains) and/or the uncovered Si/SiO2 substrate. From a previously recorded topographic/thermal image a zone of interest is selected where we define a 5x5 grid, each point spaced by 10 nm. At each point of the grid, in the z-trace mode (approach and retract) we recorded the SThM voltage
versus distance curve (VSThM-z). At the transi'on from a non-contact (NC, 'p very
near the surface) to a contact (C, 'p on the surface) situa'on, we observe a temperature jump, TNC - TC, which is used to determine the sample thermal
conduc'vity according to the protocol described in Ref. 3. The temperature jump is measured from the approach trace only (to avoid any ar'fact due to well-known adhesion hysteresis of the retract curve) and averaged over the 25 recorded VSThM-z traces. This differen'al method is suitable to remove the
parasi'c contribu'ons (air conduc'on, etc…): at the contact (C) both the sample and parasi'c thermal contribu'ons govern the VSThM signal, whereas, just before
physical 'p contact (NC), only the parasi'c thermal contribu'ons are involved. The plot of the temperature jump, TNC - TC, versus the sample temperature at
contact TC is linear and its slope is inversely propor'onal to the thermal
conduc'vity. The 'p-sample temperature TC increases with the supply voltage of
the Wheatstone bridge VDC (typically from 0.4 to 1 V).
Thermal flux. The determina'on of the thermal resistance from the ra'o of the
thermal voltage measured on the organic domain versus over the substrate is valid under the hypothesis that all the electrical power delivered to the 'p is dissipated into the sample and the thermal flux is constant.4, 5 Albeit not strictly
verified, this is jus'fied, in first approxima'on, since the constric'on resistances on the two zones are quite similar around 107 K W-1 (Rsub=1/4r
κox
= 9x10⁶ K W-1, Rorg=1/4rκ
org = 2-5x10⁷ K W-1, considering the values ofκ
org determined by theNP-SThM). However, in addi'on to taking into account the interface resistances (see text), a more precise analysis of data in Fig. 3 implies that a correc'on factor should be applied to determine the ra'o from the ra'o of the SThM
voltages, . Since the thermal conduc'vity is lower for C8-BTBT-C8 than for BTBT, the correc'on factor should be higher for C8-BTBT-C8. Rorg* R sub Rorg* (t) R
sub= V
(
SThm−org VSThM−sub)
(
!Qsub !Qorg)
3. Theore.cal methods
Molecular Dynamics. A wide range of Molecular Dynamics (MD) simula'ons has
been developed to assess the laqce thermal conduc'vity of a plethora of materials and complex nanostructures.6, 7 Among them, the Green-Kubo (GK)
formalism8 based on the fluctua'on-dissipa'on theorem provides a direct access
to the (off-)diagonal elements of the two-dimensional thermal conduc'vity tensor. Nevertheless, ensuring the proper convergence of the auto- and cross-correla'on func'ons of the heat current may be a non-trivial task, especially for sos molecular systems. A second class of techniques built on a Non-Equilibrium Molecular Dynamics (NEMD) scheme9 requires important computa'onal
resources to ar'ficially maintain the system out of equilibrium while es'ma'ng its thermal conduc'vity in a sta'onary state. The key steps of the AEMD methodology are the following: (i) applying a perfectly monitored thermal pulse on a simula'on box; (ii) recovering the ini'al thermodynamic equilibrium during a fast transient regime; (iii) fiqng the 'me-decaying temperature difference between the right and les parts of the system from a reliable solu'on of the one-dimensional heat equa'on in order to evaluate the thermal diffusivity,
D.10 This alterna've scheme has the benefit to be far less 'me-consuming than
the previously cited methods due to the rapid dissipa'on of the thermal gradient. The AEMD approach also contrasts with both the Equilibrium Molecular Dynamics (EMD) and the Non Equilibrium Molecular Dynamics (NEMD) techniques by es'ma'ng the phononic contribu'on to the thermal transport with no need for any instantaneous heat flux; moreover, the defini'on of the heat flux in the LAMMPS sosware11 has been recently iden'fied as physically
inconsistent for the study of molecular systems.12, 13 With the AEMD approach,
the thermal conduc'vity
κ
=DρCP is finally obtained, provided the density, ρ, andthe specific heat, CP, of the system are known.10 The parameter CP is typically
∂T ∂t = D ∂
2T
es'mated to be 3R (with R the ideal gas constant), as predicted by the Dulong-Pe't model.14 Note that no quantum correc'ons are taken into account because
MD simula'ons are performed at 300K while many OSCs are characterized by a very low Debye temperature θD 15, 16 so that the classical approxima'on used in
the Dulong-Pe't rela'onship is s'll valid. It is also of prime importance to account for the size-dependence of the laqce thermal conduc'vity deduced from this approach since phonons having a mean free path larger than the cell dimension do not effec'vely contribute to
κ
. An extrapola'on procedure is thus needed to get rid of these size effects17 and to extract a quasi-length-free laqcethermal conduc'vity from the linear regression of 1/
κ
versus 1/L (L the length of the box size along the direc'on of heat propaga'on). We have carefully reparameterized the torsional poten'al terms against sophis'cated quantum-chemical calcula'ons, with atomic charges calculated at the 1.14*CM1A-LBCC level.18 The implementa'on of the force field was insured by the LigParGen freeserver.19 Supercells ranging from 10 to 52 units cell have been generated along
each direc'on of interest for heat transport and periodic boundary condi'ons were applied along the main three axes. First, atomic posi'ons were op'mized at 0 K while keeping fixed the cell parameters before relaxing the whole simula'on box during a second energy minimiza'on. Aserwards, systems have been aged in the canonical NVT ensemble (mole (N), volume (V) and temperature (T)) and in the isothermal–isobaric NPT ensemble (mole (N), pressure (P) and temperature (T)) during 1 ns in ambient condi'ons, using a Nose-Hoover thermostat and barostat. Then, a step-like temperature profile was created by simultaneously “freezing” atomic mo'ons in one half of the simula'on box while hea'ng up [cooling down, respec'vely] the second part of the system alterna'vely at < T1 > = 362.5 K (< T2 > = 237.5 K, respec'vely) via NVT simula'ons (∼ 250 ps). Finally, an NVE (mole (N), volume (V) and energy (E)) simula'on las'ng up to ∼ 3 ns was achieved to dissipate the ini'al 125 K thermal gradient. Throughout a
post-processing step, the monitored temperature offset was fiWed by
a sum of exponen'als expressed as , where Cn and αn are
coefficients depending on ini'al condi'ons. A fiqng func'on based on five terms is the best compromise between reasonable computa'onal 'me and sufficient accuracy for the es'ma'on of the laqce thermal conduc'vity.
Es?ma?on of the par?cipa?on ra?o. In order to characterize the vibra'onal proper'es of both BTBT and C8-BTBT-C8, we performed the diagonaliza'on of the corresponding dynamical matrix given by:
(s1)
where mi is the mass of the ith atom, Fiα is the force on the ith atom along the α
direc'on due to a displacement of atom j along the β direc'on. La'n indices are used for labelling atoms while Greek leWers indicate the (x,y,z) Cartesian components. The diagonaliza'on of the dynamical matrix was obtained by using the SLEPc library20 in order to obtain the eigenvectors es and eigenvalues ω2s
where s = 1, . . . ,3N counts the system eigenmodes. The calcula'on of the force first deriva'ves have been performed using a numerical finite difference procedure by considering an atomic displacement as small as 5 x 10⁻⁴ Å. Once the
eigenvectors have been calculated, we es'mated the par'cipa'on ra'o (PR) as:21
(s2)
PR yields an es'ma'on of the contribu'on of a subgroup of atoms in a specific vibra'onal mode. The actual localized or extended character of that mode is
ΔT = T1 − T2 Cne−αn2Dt n=1 5
∑
Diα ,jβ= −1 mimj ∂Fiα ∂rjβ PR= 1 N ei ,s2 i=1 N∑
⎛ ⎝⎜ ⎞ ⎠⎟ 2 ei ,s4 i=1 N∑
related to the actual PR value: PR ∼ 1 in the case of extended modes while PR has a smaller value for localized modes. It is worth no'cing that, according to its very defini'on, a PR exactly equal to unity is obtained solely for vibra'onal modes in ideally perfect crystalline systems, in which the atomic displacements are perfectly periodic within the sample. In general, the PR values for extended modes in non-crystalline systems lie in the 0.4- 0.6 interval.
4. Addi.onal SThM images
Figures S1. Typical topographic and thermal voltage images of the five C8-BTBT-C8 measured by 3ω-SThM (VAC
Figure S2. Typical topographic and thermal voltage images of the BTBT samples
measured by 3ω-SThM (VAC = 0.2 V, 1 kHz) for samples #1 and 2 and samples #3,4
by DC-SThM (VDC = 0.6V).
5. NP-SThM calibra.on.
The sample temperature is calculated from the measured thermal voltage by
(Eq.S1)
where G is the known transfer func'on of the Wheatstone bridge and the amplifier gain (1.08 x VDC V/Ω) for the DC-SThM methods,22 8.2x10⁻² x VAC V/Ω for
the 3ω-SThM. The 'p resistance R'p varies linearly with sample temperature, and
has been calibrated given Ramb= 290.2 Ω and λ = 0.27 Ω/°C.
To determine the thermal conduc'vity from data in Fig. 3 and using Eq. (2), we calibrated the null-point SThM according to the protocol in Ref. 3. The same TC vs.
TNC-TC measurements were done on two materials with well-known thermal
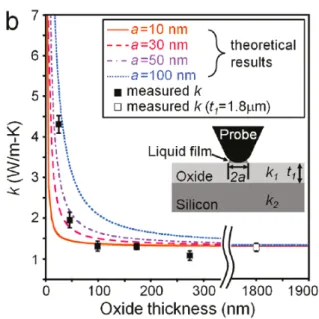
conduc'vity (below) : a glass slide (1.3 W/m.K) and a low doped silicon wafer with its na've oxide (150 W/m.K). From a linear fit on the data, we get α = 25.6 W m-1 K-1 and β = 21.6 K/K. Figure S3. TC vs. TNC - TC plot for the two reference materials. Solid lines are the linear fits. 6. Es.ma.on of the constric.on thermal resistance of the Si/SiO2 substrate The effec've thermal conduc'vity measured by NP-SThM is the one of the bulk SiO2 (see Fig. 6-b in Ref. 3 and below) if the SiO2 thickness is larger than ∼ 100 nm
(here 200-500 nm).3 This behavior is in agreement with a simple analy'cal model
thermal contact (r ≈ 20 nm, see below). Thus, we used for the Si/SiO2 substrate Rsub=1/4r
κox
= 9x10⁶ K W-1 withκox
the "bulk" SiO2 thermal conduc'vity (1.4 Wm-1 K-1). Figure S4. VariaHon of the measured thermal conducHvity of a silicon substrate covered by a film of SiO2 with various thickness (Reprinted with permission from Kim, K.; Chung, J.; Hwang, G.; Kwon, O.; Lee, J. S. ACS Nano 2011, 5, 8700–8709. Copyright (2011) American Chemical Society). 7. Es.ma.on of the radius of the thermal contact between .p and surface. The thermal contact radius is calculated following the approach reported in Ref. 24 taken into account the mechanical 'p radius r'p and the size of the water
meniscus at the 'p/surface interface. The thermal radius of the thermal contact is given by 25
(Eq. S2)
rth= 2.08 −rtipcosθ
with r'p = 100 nm (data from Bruker), the rela've humidity φ = 0.35-0.4
(air-condi'oned laboratory, values checked during the measurements) and the contact angle of the concave meniscus between the 'p and the surface θ ≈ 30° as measured for π-conjugated molecular crystals in Ref. 26. We get r ≈ 20 nm. The water meniscus contact angle depends on the surface energy of the sample, and thus should, in principle, not be the same on the organic domains and the uncovered SiO2 surface, the later being more hydrophilic than the organic
materials. However, we cannot perform standard water contact angle measurements inside the micrometer size uncovered SiO2 (see Fig. S1 and S2),
and we consider the same value of 30° in both cases. Moreover, it is likely that the SiO2 surface is covered by organic contaminants from the spin-coa'ng
deposi'on technique.
8. FiNed parameters of Eq. 3.
Table S2 gives the values of the fiWed parameters (
κ
org) for the data shown inFig. 4 (main text).
Table S2. Fit parameters (Fig. 4, Eq. 3)
We get the average values
κ
BTBT = 1.37 ± 0.01 W m-1 K-1 andκ
C8-BTBT-C8 = 1.35 ±0.01 W m-1 K-1. We note that a values of r = 80 nm has been used to these fits.
Using r = 20 nm gave poor fits. The value r = 80 nm should indicate a more
C8-BTBT-C8 BTBT
κorg
(W m-1 K-1)κorg
(W m-1 K-1) sample #1 1.348 1.371 sample #2 1.352 1.373 sample #3 1.359 1.366 sample #4 1.355 1.372hydrophilic surface (Eq. S2, lower θ, but Eq. (S2) has a limit r = 21.7 nm for θ=0°, thus this simple model is inappropriate in the case of highly hydrophilic surface). Nevertheless, this uncertainty in the determina'on of r does not change the conclusion of the NP-SThM measurements that the thermal conductance of BTBT is higher than for C8-BTBT-C8 (r is included in the calibra'on parameters). References 1. Lefèvre, S.; Volz, S., 3ω-scanning thermal microscope. Rev. Sci. Instrum. 2005, 76 (3), 033701. 2. Bodzenta, J.; Juszczyk, J.; Chirtoc, M., Quan'ta've scanning thermal microscopy based on determina'on of thermal probe dynamic resistance. Rev. Sci. Instrum. 2013, 84 (9), 093702. 3. Kim, K.; Chung, J.; Hwang, G.; Kwon, O.; Lee, J. S., Quan'ta've measurement with scanning thermal microscope by preven'ng the distor'on due to the heat transfer through the air. ACS Nano 2011, 5 (11), 8700-8709. 4. Menges, F.; Riel, H.; Stemmer, A.; Gotsmann, B., Quan'ta've Thermometry of Nanoscale Hot Spots. Nano Le$ 2012, 12, 596-601. 5. Meier, T.; Menges, F.; Nirmalraj, P.; Hölscher, H.; Riel, H.; Gotsmann, B., Length-Dependent Thermal Transport along Molecular Chains. Phys. Rev. Le$. 2014, 113 (6), 060801. 6. Fugallo, G.; Colombo, L., Calcula'ng laqce thermal conduc'vity: a synopsis. Physica Scripta 2018, 93 (4), 043002. 7. Puligheddu, M.; Xia, Y.; Chan, M.; Galli, G., Computa'onal predic'on of laqce thermal conduc'vity: A comparison of molecular dynamics and Boltzmann transport approaches. Physical Review Materials 2019, 3 (8), 085401. 8. Kubo, R.; Toda, M.; Hashitsume, N., StaHsHcal Physics II. Spinger: Berlin, 1985. 9. Müller-Plathe, F., A simple nonequilibrium molecular dynamics method for calcula'ng the thermal conduc'vity. The Journal of Chemical Physics 1997, 106 (14), 6082-6085. 10. He, Y.; Savić, I.; Donadio, D.; Galli, G., Laqce thermal conduc'vity of semiconduc'ng bulk materials: atomis'c simula'ons. Physical Chemistry Chemical Physics 2012, 14 (47), 16209-16222.
11. Plimpton, S., Fast Parallel Algorithms for Short-Range Molecular Dynamics. Journal of ComputaHonal Physics 1995, 117 (1), 1-19. 12. Boone, P.; Babaei, H.; Wilmer, C. E., Heat Flux for Many-Body Interac'ons: Correc'ons to LAMMPS. Journal of Chemical Theory and ComputaHon 2019, 15 (10), 5579-5587. 13. Surblys, D.; Matsubara, H.; Kikugawa, G.; Ohara, T., Applica'on of atomic stress to compute heat flux via molecular dynamics for systems with many-body interac'ons. Physical Review E 2019, 99 (5), 051301. 14. Ashcros, N. W.; Mermin, N. D., Solid State Physics. HoltSander: London, 1976. 15. Ramadoss, P.; Buvaneswari, N., Thermal Proper'es of Some Organic Liquids Using Ultrasonic Velocity Measurements. E-Journal of Chemistry 2011, 8, 120260. 16. Babavali, S. F.; Nori, T. S.; Srinivasu, C., Acous'cal effec've Debye temperature studies in heterocyclic aroma'c func'onal materials of organic liquid mixtures at four different temperatures T = (303.15, 308.15, 313.15 and 318.15) K. Materials Today: Proceedings 2019, 18, 2073-2076. 17. Sellan, D. P.; Landry, E. S.; Turney, J. E.; McGaughey, A. J. H.; Amon, C. H., Size effects in molecular dynamics thermal conduc'vity predic'ons. Physical Review B 2010, 81 (21), 214305. 18. Dodda, L. S.; Vilseck, J. Z.; Tirado-Rives, J.; Jorgensen, W. L., 1.14*CM1A-LBCC: Localized Bond-Charge Corrected CM1A Charges for Condensed-Phase Simula'ons. The Journal of Physical Chemistry B 2017, 121 (15), 3864-3870. 19. Dodda, L. S.; Cabeza de Vaca, I.; Tirado-Rives, J.; Jorgensen, W. L., LigParGen web server: an automa'c OPLS-AA parameter generator for organic ligands. Nucleic Acids Research 2017, 45 (W1), W331-W336. 20. Hernandez, V.; Roman, J. E.; Vidal, V., SLEPc: A Scalable and Flexible Toolkit for the Solu'on of Eigenvalue Problem. ACM Trans. Math. SoVw. 2005, 31, 351-362. 21. An'dormi, A.; Cartoixà, X.; Colombo, L., Nature of microscopic heat carriers in nanoporous silicon. Physical Review Materials 2018, 2 (5), 056001. 22. Anasys-Instruments SThM installa'on and opera'on manual; 2008. 23. Dryden, J. R., The Effect of a Surface Coa'ng on the Constric'on Resistance of a Spot on an Infinite Half-Plane. J. Heat Transfer 1983, 105, 408-410.
24. Luo, K.; Shi, Z.; Varesi, J.; Majumdar, A., Sensor nanofabrica'on, performance, and conduc'on mechanisms in scanning thermal microscopy. Journal of Vacuum Science & Technology B: Microelectronics and Nanometer Structures 1997, 15 (2), 349-360. 25. Israelachvili, J. N., Intermolecular and surface forces; 3rd ed. Academic Press: Amsterdam, 2011. 26. Zhang, Y.; Zhang, C.; Wei, D.; Bai, X.; Xu, X., Nanoscale thermal mapping of few-layer organic crystal. CrystEngComm 2019, 21, 5402-5409.