Programming Classes
byElena L. Glassman
Submitted to the Department of Electrical Engineering and Computer Science
in partial fulfillment of the requirements for the degree of
Doctor of Philosophy at the
MASSACHUSETTS INSTITUTE OF TECHNOLOGY
September 2016 MASSACHUSETTSINSTITUTE OF TECHNOLOGY
SEP 2
8
2016
LIBRARIES
ARCHIVE
Massachusetts Institute of Technology, 2016. All rights reserved.A uthor...
Certified by ...
Signature redacted
Department of Electrical Engineering and Computer Science August 11, 2016
Signature redacted
Robert C. Miller Professor of Electrical Engineering and Computer Science Thesis Supervisor
Accepted by ...
Signature redacted
/ I
LWA.
KolodziejskiProfessor of Electrical Engineering and Computer Science Chair, Department Committee on Graduate Students
Programming Classes
by
Elena L. Glassman
Submitted to the Department of Electrical Engineering and Computer Science
on August 11, 2016, in partial fulfillment of the requirements for the degree of
Doctor of Philosophy
Abstract
In large programming classes, a single problem may yield thousands of student solutions. Solutions can vary in correctness, approach, and readability. Understanding large-scale variation in solutions is a hard but important problem. For teachers, this variation could be a source of innovative new student solutions and instructive examples. Understanding solution variation could help teachers write better feedback, test cases, and evaluation rubrics. Theories of learning, e.g., analogical learning and variation theory, suggest that students would benefit from understanding the variation in the fellow student solutions as well. Even when there are many solutions to a problem, when a student is struggling in a large class, other students may have struggled along a similar solution path, hit the same bugs, and have hints based on that earned expertise.
This thesis describes systems that exploit large-scale solution variation and have been evaluated using data or live deployments in on-campus or edX courses with thousands of students. OverCode visualizes thousands of programming solutions using static and dynamic analysis to cluster similar solutions. Compared to the status quo, OverCode lets teachers quickly develop a high-level view of student understanding and misconceptions and provide feedback that is relevant to more student solutions. Foobaz helps teachers give feedback at scale on a critical aspect of readability, i.e., variable naming. Foobaz displays the distribution of student-chosen names for each common variable in student solutions and, with a few teacher annotations, it generates personalized quizzes that help students learn from the good and bad naming choices of their peers. Finally, this thesis describes two complementary learnersourcing workflows that help students write hints for each other while reflecting on their own bugs and comparing their own solutions with other student solutions. These systems demonstrate how clustering and visualizing solution variation can help teachers directly respond to trends and outliers within student solutions, as well as help
I am not a professional software developer, but learning how to write programs in middle
school was one of the most empowering skills my father could ever have taught me. I did not need access to chemicals or heavy machinery. I only needed a computer and occasionally an internet connection. I acquired datasets and wrote programs to extract interesting patterns in them. It was and still is a creative outlet.
More recently, the value of learning how to code, or at least how to think computational ly, has gained national attention. Last September, New York City Mayor Bill de Blasio announced that all public schools in NYC will be required to offer computer science to all students
by 2025. In January of this year, the White House released its Computer Science for All
initiative, "offering every student the hands-on computer science and math classes that make them job-ready on day one" (President Obama, 2016 State of the Union Address).
The economic value and employment prospects associated with knowing how to program, the subsiding stigma of being a computer "geek" or "nerd," and the production and popularity of movies about programmers may be responsible for driving up enrollment in computer science classes to unprecedented levels. Hundreds or thousands of students enroll in programming courses at schools like MIT, Stanford, Berkeley and the University of Washington.
One-on-one tutoring is considered a gold standard in education, and programming education is likely no exception. However, most students are not going to receive that kind of personalized instruction. We, as a computer science community, may not be able to offer one-on-one tutoring at a massive scale, but can we create systems that enhance the teacher and student experiences in massive classrooms in ways that would never have been possible in one-on-one tutoring? This thesis is one particular approach to answering that question.
Thank you, thank you, thank you to my advisor, Rob Miller, who took a chance on me, and my other co-authors on this thesis work, Rishabh Singh, Jeremy Scott, Philip Guo, Lyla Fischer, Aaron Lin, and Carrie Cai. The past and present members of our User Interface Design group were instrumental in helping me feel at home in a new area and get up to speed while having fun. I'm also grateful to my past internship mentors at Google and MSR, specifically Dan Russell, Merrie Ringel Morris, and Andres Monroy-Hemdndez, who gave me the chance to try out my chops in new environments. I also want to thank my friends outside MIT, especially the greater Boston community of wrestling coaches, who helped me learn important lessons outside the classroom. And, last but not least, my partner Victor, my parents, and my brother, for all the hugs, proofreading, brainstorming, snack deliveries, technical discussions, and moral support.
Cover page 1 Abstract 3 Preface 5 Acknowledgments 7 Contents 9 List of Figures 15 List of Tables 23 1 Introduction 25 1.1 Solution Variation . . . 26
1.2 A Challenge and an Opportunity . . . 29
1.3 A Tale of Two Turing Machines . . . 30
1.4 Research Questions . . . . 31
1.4.1 OverCode . . . . 31
1.4.2 Foobaz . . . 32
1.4.3 Learnersourcing Personalized Hints . . . 35
1.4.4 Systems as Answers . . . . 36
1.5 Thesis Statement and Contributions . . . . 38
1.6 Thesis Overview . . . 40 9
2.1 Clustering ... 43
2.2 Mining Solution Variation . . . 47
2.2.1 Code Outside the Classroom . . . . 47
2.2.2 Code Inside the Classroom . . . 54
2.3 Teaching Principles . . . 63
2.4 Learning through Variation in Examples . . . 65
2.4.1 Analogical Learning . . . 66
2.4.2 Variation Theory . . . . 67
2.5 Personalized Student Support and Automated Tutoring . . . 70
3 OverCode: Visualizing Variation in Student Solutions 73 3.1 Introduction . . . .. ... 73
3.2 OverCode . . . . . . . 76
3.2.1 Target Users and Tasks . . . . 77
3.2.2 User Interface . . . 78
3.3 Implementation . . . . 84
3.3.1 Analysis Pipeline . . . . 84
3.3.2 Variable Renaming Details and Limitations . . . 91
3.3.3 Complexity of the Analysis Pipeline . . . 93
3.4 D ataset . . . 95
3.5 OverCode Analysis Pipeline Evaluation . . . 98
3.6 User Studies . . . 103
3.6.1 User Study I: Writing a Class Forum Post . . . 103
3.6.2 User Study 2: Coverage . . . 110
3.7 Discussion . . . 117
3.8 GroverCode: OverCode for Grading . . . 120
3.9 Conclusion . . . 130
4 Foobaz: Feedback on Variable Names at Scale 131 4.1 User Interface . . . . 133
4.1.2 Rating Variable Names . . . 135 4.1.3 Making Quizzes . . . 136 4.2 Evaluation . . . 140 4.2.1 Datasets . . . 140 4.2.2 Teacher Study . . . 141 4.2.3 Student Study . . . 146 4.3 Limitations . . . 151 4.4 Conclusion . . . 151
5 Learnersourcing Debugging and Design Hints 153 5.1 System Design . . . 155 5.1.1 Design Questions . . . 155 5.1.2 Self-Reflection Workflow . . . 158 5.1.3 Comparison Workflow . . . 159 5.2 User Interfaces . . . 159 5.2.1 Dear Beta . . . 161 5.2.2 Dear Gamma . . . 163 5.3 Evaluation . . . 167 5.3.1 Dear Beta . . . 167 5.3.2 Dear Gamma . . . 167 5.3.3 Limitations . . . 170 5.4 Results . . . 170
5.4.1 Dear Beta Study . . . 170
5.4.2 Dear Gamma Study . . . 171
5.5 Discussion . . . 175
5.5.1 Answers to Research Questions . . . 175
5.5.2 Lessons for Self-Reflection and Comparison Workflows . . . 176
5.5.3 Generalization . . . 177
5.6 Conclusions . . . 177
6.1 OverCode as Clustering Algorithm . . . 180
6.2 The Applicability of Bayesian Clustering Methods . . . 180
6.3 Clustering Solutions with BCM . . . 182
6.3.1 Preliminary Evaluation . . . 182
6.4 Clustering Solution Components with LDA . . . 184
6.4.1 Preliminary Evaluation . . . 187
6.5 Discussion and Future Work . . . 187
6.6 Conclusion . . . 188
7 Discussion 189 7.1 Design Decisions and Choices . . . 189
7.2 Capturing the Underlying Distribution . . . 191
7.3 Helping Teachers Generate Solution-Driven Content . . . 192
7.4 Writing Solutions Well . . . 193
7.5 Clustering and Visualizing Solution Variation . . . 195
7.6 Language Agnosticism . . . 196 7.7 Limitations . . . 197 8 Conclusion 8.1 Summary of Contributions . . . . 8.2 Future Work . . . . 8.2.1 OverCode . . . . 8.2.2 GroverCode . . . . 8.2.3 Foobaz . . . . 8.2.4 Targeted Learnersourcing 199 . . . 2 0 0 . . . 2 0 1 . . . 2 0 1 . . . 2 0 4 . . . 2 0 5 . . . 2 0 5
Appendix
A GroverCode Deployment Programming Problems
A. 1 M idterm Problems . . . .
207
207 207
Bibliography 213
1-1 A solution synthesized by OverCode that represents 1538 student solutions. 26
1-2 Three different solutions that exponentiate a base to an exponent. They are all marked correct by the autograder because they pass all the autograder
test cases. . . . . 27
1-3 Two different approaches to solving the problem. The first disregards teacher
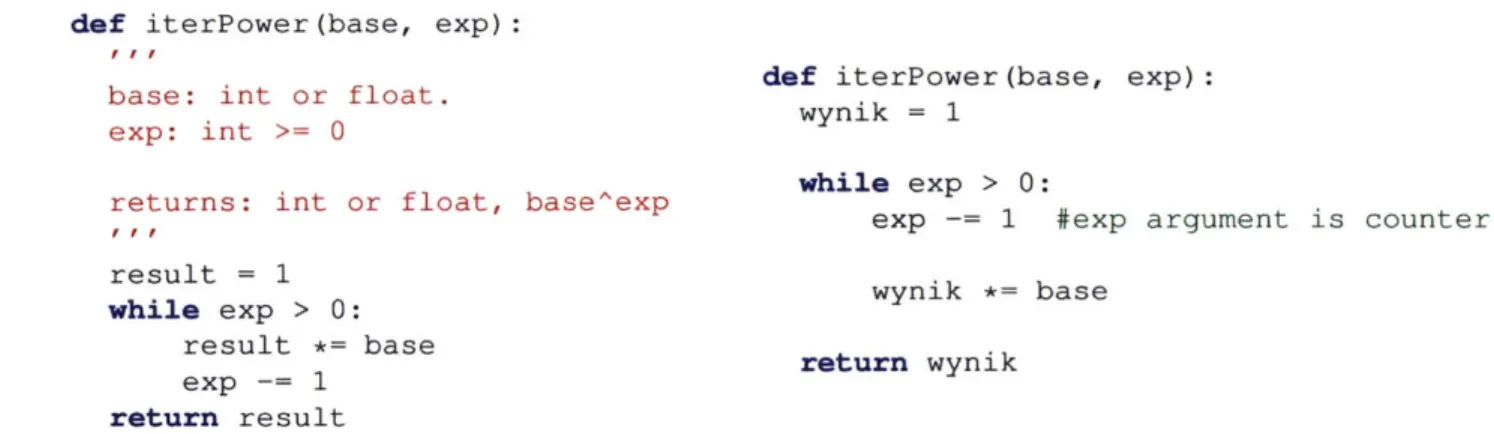
instructions to not use equivalent library functions and the second includes the keyword continue in a place where it is completely unnecessary, casting doubt on student understanding of the keyword wh ile . . . 28 1-4 Common and uncommon solutions to exponentiating a base to an exponent
produced by students in the 6.00x introductory Python programming course offered by edX in the Fall of 2012. . . . 28
1-5 These two solutions only differ by comments, statement order, formatting,
and variable names. Note: wynik means 'result' in Polish. . . . 29
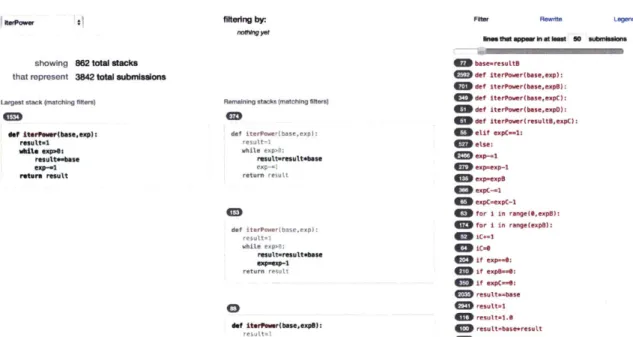
1-6 The OverCode user interface. The top left panel shows the number of
clusters, called stacks, and the total number of solutions visualized. The next panel down in the first column shows the largest stack, while the second column shows the remaining stacks. The third column shows the lines of code occurring in the normalized solutions of the stacks together with their
frequencies. . . . . 33
list of normalized solutions, each followed by a table of student-chosen variable names. Some names shown here have been labeled by the teacher as "misleading or vague," "too short," or "fine." . . . 34
1-8 A personalized active learning activity as seen by the student. Students are
shown their own solution, with a variable name replaced by an arbitrary symbol, followed by variable names for the student to consider and label using the same labels that were available to the teacher. After the student has submitted their own judgments, the teacher labels are revealed, along with teacher comments. . . . 35
1-9 In the self-reflection workflow, students generate hints by reflecting on
an obstacle they themselves have recently overcome. In the comparison workflow, students compare their own solutions to those of other students, generating a hint as a byproduct of explaining how one might get from one
solution to the other. . . . 37
3-1 The OverCode user interface. The top left panel shows the number of
clusters, called stacks, and the total number of solutions visualized. The next panel down in the first column shows the largest stack, while the second column shows the remaining stacks. The third column shows the lines of code in the platonic solutions and their frequencies. . . . 74
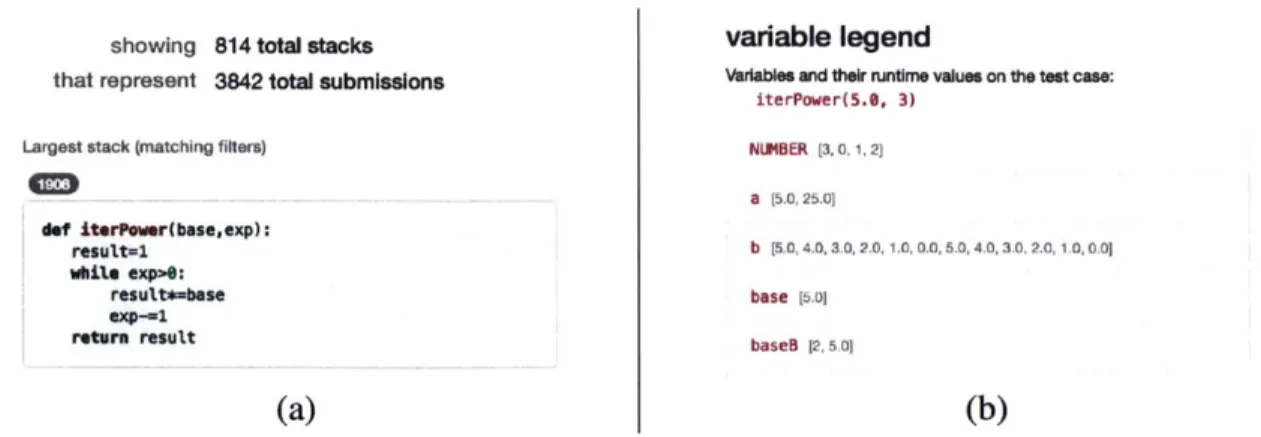
3-2 (a) A stack of 1534 similar iterPower solutions. (b) After clicking a
stack, the border color of the stack changes and the done progress bar
denotes the corresponding fraction of solutions that have been checked. . . 80
3-3 Similar lines of code between two stacks are dimmed out such that only
differences between the two stacks are apparent. . . . 80 3-4 (a) The slider allows filtering of the list of lines of code by the number of
solutions in which they appear. (b) Clicking on a line of code adds it to the
list of lines by which the stacks are filtered. . . . . 81
base * result with result *= base. (b) The preview of the changes in the platonic solutions because of the application of the rewrite rule. 82
3-6 (a) The merging of stacks after application of the rewrite rule shown in
Figure 3-5. (b) The variable legend shows the sequence of dynamic values that all program variables in normalized solutions take over the course of
execution on a given test case. . . . . 83
3-7 A student solution before and after reformatting . . . . 85
3-8 Illustration of running a (dummy) iterPower solution on a test case. . . . 85
3-9 A student solution, its program trace when running on the test case iterPower (5. 0, 3),
and the sequence of values extracted from the trace for each variable. . . . . 86
3-10 A recursive solution to the same programming problem, its program trace
when executing on iterPower (5 .0, 3) , and the extracted sequences of
values for each variable . . . . 87
3-11 i and k take on the same sequence of values, 0 then I then 2, in Solution A
and B. They are therefore considered the same common variable. . . 88
3-12 Common and uncommon variables found across the solutions in the previous
figure. . . . . 88
3-13 The unique variable in the previous pipeline step was originally named exp.
OverCode appends a double underscore as a modifier to resolve a name collision with the common variable of the same name. This is referred to as a unique/common collision . . . 89 3-14 Normalized solutions after variable renaming. . . . 89
3-15 Four solutions collapsed into three stacks. . . . 90 3-16 The top row illustrates a name collision of two common variables, both most
commonly named i, across two stacks. The second row illustrates how the colliding variable name in the smaller stack of solutions is modified with an appended character to resolve the collision. . . . 92
i.e., a multiple-instances collision, is modified so that its behavior during execution is unchanged. . . . 94
3-18 A student solution with a unique variable, originally named exp by the
student. Since it does not share the same behavior with the common variable also named exp, OverCode appends two underscores to the name of the unique variable, exp, to distinguish it. . . . 94
3-19 Number of solutions for the three problems in our 6.00x dataset. . . . 96
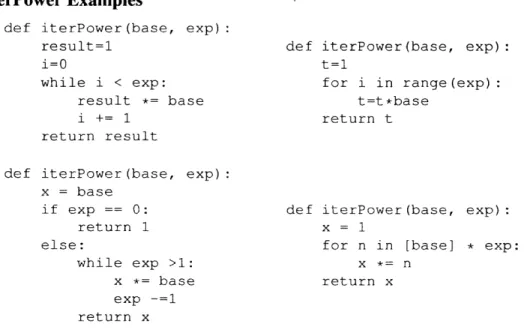
3-20 Example solutions for the i t e rP owe r problem in our 6.00x dataset. . . . 96
3-21 Example solutions for the hangman problem in our 6.00x dataset. . . . . . 97
3-22 Example solutions for the compDeriv problem in our 6.00x dataset. . . . 98
3-23 Running time and the number of stacks and common variables generated by
the OverCode backend implementation on our dataset problems. . . . 99 3-24 The distribution of sizes of the initial stacks generated by our algorithm for
each problem, showing a long tail distribution with a few large stacks and a lot of small stacks. Note that the two axes corresponding to the size of stacks and the number of stacks are in logarithmic scale. . . . 100
3-25 The two largest stacks generated by the OverCode backend algorithm for
the (a) iterPower, (b) hangman, and (c) compDeriv problems. . . . . 101
3-26 Some examples of common variables found by our analysis across the
problems in the dataset. The table also shows the frequency of occurrence of these variables, the common sequence of values of these variables on a given test case, and a subset of the original variable names used by students. 102
3-27 The number of common/common, multiple instances, and unique/common
collisions discovered by our algorithm while renaming the variables to common names. . . . 102
3-28 Screenshots of the baseline interface. The appearance changed between
the Forum Post study (left) and the Coverage study (right) in order to mini-mize superficial differences between the baseline and OverCode interfaces. Functionality did not change. . . . 105
for OverCode and baseline interfaces, after subjects used both to perform the forum post writing task. . . . 108
3-30 In (a), we plot the mean number of platonic solutions read in OverCode
over time versus the number of raw solutions read in the baseline interface over time while performing the 15-minute Coverage Study task. In (b), we replace the mean number of platonic solutions with the mean number of solutions, i.e., the stack size, they represent. These are shown for each of the three problems in the dataset. . . . 112
3-31 Mean feedback coverage, i.e., the percentage of raw solutions covered, per
trial during the coverage study for each problem, in the OverCode and baseline interfaces. . . . 113
3-32 Mean rating with standard error for (a) post-condition perception of
cov-erage (excluding one participant) and (b) confidence ratings that identified strategies were frequently used (1-7 scale). . . . 114
3-33 Hl: Interface satisfaction Mean Likert scale ratings (with standard error)
for OverCode and baseline, (a) immediately after using the interface for the
Coverage Study task, and (b) after using both interfaces. . . . 116
3-34 Mean Likert scale ratings (with standard error) for the usefulness of features of OverCode and baseline. Find refers to the find function within the web browser. Find appears twice in this figure because users rated its usefulness for each condition. . . . 117
3-35 The GroverCode user interface displaying solutions to an introductory
Python programming exam problem, in which students are asked to imple-ment a function to flatten a nested list of arbitrary depth. . . . 122
3-36 Correct and incorrect solutions, as rendered by GroverCode. . . . 123 19
list of normalized solutions, each followed by a table of student-chosen variable names. Some names shown here have been labeled by the teacher
as "misleading or vague," "too short," or "fine." . . . 132 4-2 A personalized quiz as seen by the student. The student is shown their own
code, with a variable name replaced by an arbitrary symbol, followed by variable names for the student to consider and label using the same labels that were available to the teacher. After the student has submitted their own judgments, the teacher labels are revealed, along with their explanatory com m ents. . . . 137 4-3 The quiz preview pane of the Foobaz teacher interface. Variable behavior
was logged by running all solutions on a common test case. This particular teacher created quizzes for the common variable i, which iterates through indices of a list, the common variable letter, which iterates through the characters in an input string, and the common variable result, which
accumulates one of the acceptable return values, '_i-e_.' . . . 138
4-4 Number of solutions in datasets. . . . 139 4-5 Subjects in the teacher study, on average, labeled a small fraction of the
total names, covering all three provided name categories. . . . 139 4-6 Quiz coverage of student solutions across three datasets. . . . 147 4-7 Variables in iterPower solutions labeled by each teacher. . . . 148
5-1 In the self-reflection workflow, students generate hints by reflecting on an obstacle they themselves have recently overcome. In the comparison workflow, students compare their own solutions to those of other students, generating a hint as a byproduct of explaining how one might get from one solution to the other. . . . 160
students, indexed by autograder errors. In this figure, there are three learn-ersourced hints, sorted by upvotes, for a autograder error on test 33 in the 'lab5/beta' checkoff file. . . . 162
5-3 After fixing a bug, students can add a hint for others, addressing what
mistake prevented their own solution from passing this particular autograder test. . . . 162
5-4 Dear Gamma interface for a student with a solution containing 114
tran-sistors. In the first comparison, they are asked to write a hint for a future student with a larger (less optimal) correct solution. In the second compari-son, they are asked to write a hint for a future student with a solution similar to their own so that they may reach the smallest (most optimal) correct solution. . . . 165
5-5 Sankey diagram of hints composed between types of correct solutions,
binned by the number of transistors they contain. The optimal solution has only 21 gates and 96 transistors while the most common solution generated
by students has 24 gates and 114 transistors. . . . 166
5-6 Between the Dear Beta release date (4/2) and the lab due date (4/10),
auto-grader errors were consistently being entered into the system. The addition of hints followed close behind. . . . 171
5-7 Six of the nine lab study subjects were able to improve the optimality of
their circuits with the help of the Dear Gamma hints. Subject S7 was able to make two leaps-one to a common solution with 114 transistors and another
from the common solution to the most optimal solution at 96 transistors. . . 174
and affords user feedback on cluster quality. The solutions on the left are cluster prototypes. The blue solution is the selected cluster whose members are shown in a scrollable list on the right-hand side. The tokens contained in red boxes are features that BCM identifies as characteristic of the cluster represented by that prototype. When a user hovers the cursor over a keyword or variable name, e.g., len, it is highlighted in a blue rectangle, indicating that it can be clicked. . . . 182
6-2 Example of a recursive student solution. . . . 185
6-3 Example of a student solution using the Python keyword while. . . . 185
6-4 Example of a student solution using the Python keyword while, where the student has not modified any input arguments, i.e., better programming style. 186
6-5 The sequences of variable values recorded by OverCode while executing
iterPower (5, 3) . . . . 186
3.1 Example: All templates and locations in which the abstract variable exp,
the second argument to a recursive power function, appears. A location
represents the index or indices of the blanks that the abstract variable occu-pies, where the first blank is index 0, the second is index 1, and so on. The
second and third columns together form a template-location pair. . . . . 125
3.2 Number of solutions submitted and successfully processed by GroverCode
for each problem in the dataset. Reasons why a solution might not make it through the pipeline include syntax errors and memory management issues caused by students making inappropriate function calls. . . . 128
3.3 The degree of variation in input-output behavior and statistics about stack
sizes . . . 12 8
3.4 Statistics about variables renaming based on different heuristics in the
GroverCode normalization process. . . . 129
5.1 Breakdown of Dear Gamma hints by type. Students in the Dear Gamma
lab study initially received 5 pointing hints (p), followed by 5 pure teaching hints (t), and finally 5 pure bottom-out hints (b), delivered whenever the
student was stuck and asked for more help. . . . 172
6.1 Variable-by-Solution Matrix for Programs, where variables are uniquely
Introduction
Introductory programming classes are big and hard to teach. Programming classes on some college campuses are reaching hundreds or thousands of students [76]. Massive Open Online Courses (MOOCs) on programming have drawn tens or hundreds of thousands of students [88]. Millions of students complete programming problems online through sites like Khan Academy.
Massive classes generate massive datasets of solutions to the same programming problem. The problem could be exponentiating a number, computing a derivative, or transforming a string in a specific way. The solutions are typically a single function that prints or returns an answer. A terse solution might contain a couple of lines. An excessively verbose solution might contain over twenty lines.
This thesis revolves around clustering and visualizing massive datasets of solutions in novel, human-readable ways. For example, rather than representing solutions as points in a projection of a high-dimensional space into two or three dimensions, OverCode's deterministic unsupervised clustering pipeline synthesizes solutions that each represent
entire stacks of solutions. For example, the solution shown in Figure 1 -I represents 1538
solutions [41]. OverCode is the first of several systems for clustering and visualizing solutions and solution variation that were developed in this thesis.
26 CHAPTER 1. INTRODUCTION def iterPower(base,exp): result=1 while exp>0: result*=base exp-=1 return result
Figure 1-1: A solution synthesized by OverCode that represents 1538 student solutions.
1.1
Solution Variation
In this thesis, solution variation means three things: correctness, approach, and readability. Since correctness is difficult to prove for an arbitrary piece of code, it is approximated in industry and education by correctness with respect to a set of test cases. In education, the machinery that checks for correctness is often called an autograder.
There is a wide range of solutions that pass all the test cases and are labeled correct by the autograder, but they are not all equally good. Figure 1 -2 shows three different solutions of widely varying approach and readability that are correct with respect to the autograder test cases.
Solutions can have different approaches. For example, a student might be subversive and disregard a request by the teacher to solve the problem without using an existing equivalent library function. Or the student might include unnecessary lines of code that reveal possible misconceptions about how the language works. Figure 1-3 gives an example of each. Approaches can be common or uncommon. One can think of the students submitting solu-tions as a generative function that produces a distribution of solusolu-tions we could characterize and take into account while teaching or designing new course material. Figure 1-4 shows the most common and one of the most uncommon solutions produced by students for a problem assigned in 6.00x, an introductory programming course offered on edX in the fall of 2012. Uncommon solutions may be highly innovative or extraordinarily poor.
Iterative Solution Recursive Solution
def power(base,exp): def power(base,exp):
result=l if exp == 0:
while exp>0: return 1
result*=base else:
exp-=l return base * power(base,
return result exp-1)
Poorly Written Solution
def power(base, exp):
tempBase=base result = base if type (base)==int: while exp==0: result = 1 print (result) break exp=exp-1 while exp >0: tempCal=abs (tempBase) exp=exp-1 while exp<0: break for i in range (1, tempCal) result=result+base tempCal=tempCal-l tempRes=base base=result return (result) else: result = 1 while exp > 0:
result = result* base
exp = exp- 1
return result
Figure 1-2: Three different solutions that exponentiate a base to an exponent. They are all marked correct by the autograder because they pass all the autograder test cases.
Subversive Solution
def power(base, exp) return base**exp
Solution with Unnecessary Statement
def power(base,exp):
result=l
while exp>O:
result=result*base exp-=1
continue #keyword here does not change execution
return result
Figure 1-3: Two different approaches to solving the problem. The first disregards teacher
instructions to not use equivalent library functions and the second includes the keyword continue in a place where it is completely unnecessary, casting doubt on student under-standing of the keyword wh i 1 e.
Common Solution
def power (base, exp) result=l while exp>O: result*=base exp-=l return result Uncommon solution
def power (base, exp)
if exp == 0:
return 1 else:
return base * power (base, exp-1)
Figure 1-4: Common and uncommon solutions to exponentiating a base to an exponent
produced by students in the 6.00x introductory Python programming course offered by edX in the Fall of 2012.
I
29 1.2. A CHALLENGE AND AN OPPORTUNITY
def iterPower(base, exp)
base: int or float. exp: int >= 0
returns: int or filoat, base exp
result 1
while exp > 0:
result *= base
exp -= 1
return result
def iterPower (base, exp):
wynik = 1
while exp > 0:
exp -= 1 #exp argument is counter
wynik *= base
return wynik
Figure 1-5: These two solutions only differ by comments, statement order, formatting, and
variable names. Note: wynik means 'result' in Polish.
like the one in Figure 1-2 may be both the symptom and the cause of student confusion. Unreadable code is harder to understand and debug, for both teacher and student. In industry, peer-to-peer code reviews help prevent code with poor readability from entering code bases, where it can be difficult and costly to maintain.
Student design choices affect correctness, approach, and readability. Examples include choosing:
e for or while
e a *= b or a = a*b
* recursion or iteration
Solution variation is a result of these choices. Even simple differences, like comments, statement order, formatting and variable names can make solutions look quite different to the unaided eye, as shown in Figure 1-5.
1.2 A Challenge and an Opportunity
When teachers may have hundreds or thousands of raw student solutions to the same problem, it becomes arduous or impractical to review them by hand. And yet, only testing for approximate correctness via test cases has been automated. Identifying student solution
approaches and readability automatically are still open areas of research. Given the volume and variety of student solutions, how do teachers comprehend what their students wrote? How do they give feedback on approach and readability at scale?
What value can only be extracted from a massive programming class? This thesis focuses on the opportunity posed by exploiting solution variation within large datasets of student solutions to the same problem. With algorithms, visualizations and interfaces, teachers may learn from their students by exposing student solutions they did not know about before. Teachers could find better examples to pull out for discussion. Teachers could write better feedback, test cases, and evaluation rubrics, given new knowledge of the distribution of student solutions across the dimensions of correctness, approach, and readability. And students could be tapped as experts on the solutions they create and the bugs they fix.
1.3
A Tale of Two Turing Machines
A short story about my time as a teaching assistant illustrates some of the challenges posed by solution variation. Students were programming simulated Turing machines, which
compute by reading and writing to a simulated infinitely long tape. I struggled to help a student whose approach was not familiar to me. I could not tell if the approach was fatally flawed or unusual and possibly innovative. I did not want to dissuade him from a novel idea simply because I did not recognize it.
The staff server had thousands of previously submitted correct student solutions, but I could not easily see if one of them successfully employed the same approach as the one envisioned
by the struggling student. After experimenting with different representations, I found a
visualization of Turing machine behavior on test cases that separated 90% of the correct student solutions into two main approaches [38]. The remaining approximately 10% of solutions included less common strategies. Two solutions passed all test cases but subverted teacher instructions. Many teaching staff members were not aware that there were multiple solutions to the problem and that the current test suite was insufficient to distinguish correct
solutions from incorrect ones. At least one staff member admitted steering students away from solutions they did not recognize, but in retrospect may have indeed been valid solutions.
1.4 Research Questions
When a teacher cannot read all the student solutions to a programming there are too many of them,
problem because
" R1 how can the teacher understand the common and uncommon variation in their
student solutions?
" R2 how can the teacher give feedback on approach and readability at scale?
" R3 ... in a personalized way?
* R4 ... and how can students do the same?
In this thesis, several systems and workflows are developed and studied to better answer these questions. The first is OverCode, a system for visualizing variation in student Python solutions. The second is Foobaz, a system for visualizing variable name variation and delivering personalized feedback on naming choices. The third and fourth systems are based on two novel, complementary learnersourcing workflows that help students write hints for each other through self-reflection and comparison with other student solutions.
1.4.1
OverCode
Understanding solution variation is important for providing appropriate feedback to students at scale. In one-on-one scenarios, understanding the space of potential solutions can help teachers counsel students struggling to implement their own solutions. The wide variation among these solutions can be a source of pedagogically valuable examples for course materials and forum posts and expose corner cases that spur autograder refinements. OverCode, shown in Figure 1-6 renders thousands of small student Python solutions to the
same problem and makes them explorable. With OverCode, teachers can better understand the distribution of common and uncommon solutions without reading every student solution. The OverCode analysis pipeline uses both static and dynamic analysis to normalize and clus-ter similar solutions into stacks represented by a single normalized solution. The OverCode
normalization process and user interface work together to support human readability and switching between solutions with minimal cognitive load. In two user studys, OverCode helped teachers more quickly develop a high-level view of students' understanding and misconceptions and compose feedback that is relevant to more student solutions, compared to the status quo.
A key, novel component of the normalization process is identifying common variables across
multiple student solutions to the same programming problem. Common variables are found in multiple student solutions to the same problem and have identical sequences of distinct values when those solutions are executed on the same test cases. During normalization, every common variable in every solution is renamed to the most popular name students gave it.
The normalized solutions encode both static and dynamic information. More specifically, its syntax carries the static information and its variable names encode dynamic information. A single normalized solution can represent an entire stack of hundreds or thousands of similar student solutions.
1.4.2
Foobaz
Traditional feedback methods, such as hand-grading student solutions for approach and readability, are labor intensive and do not scale. Foobaz transforms the output of the OverCode analysis pipeline into an interface for teachers to compose feedback at scale on a critical aspect of readability, variable naming. As shown in Figure 1-7, the Foobaz teacher interface displays the most common and uncommon names for variables in each stack of solutions and allows teachers to label good examples of good and bad student-chosen
terPower showing that represent filtering by: nothing yet 818 total stacks 3841 total submissions
Largest stack (matching filters)
M done
def iterPower(base, exp):
result = 1
while (exp > 0):
result *= base
exp -= 1
return result
Remaining stacks (matching filters)
M done
def iterPower(base, -xp)
while
result = base * result
exp
-return result
C done
det ite.wrbase, exp):
result = whiT c
result = base * result
exp = exp
return r(-,tjLt
Filter Rewrite Legend
lines that appear in at least 50
submissions
base = resultB
4 def iterPower(base, exp): 4 def iterPower(base, expB): 4Mdef iterPower(base, expC):
4 def iterPower(base, expD): M def iterPower(resultB, expC Melif (expC == 1): Selse: exp - 1 exp = exp - 1 exp = expB SexpC -=1 expC =expC 1
for i in range(, expB): for i in range(expB):
fic += I
iC = 0
if (exp 0):
if (expB== 0):
Figure 1-6: The OverCode user interface. The top left panel shows the number of clusters,
called stacks, and the total number of solutions visualized. The next panel down in the first
column shows the largest stack, while the second column shows the remaining stacks. The third column shows the lines of code occurring in the normalized solutions of the stacks together with their frequencies.
Foobaz 1: Misleading or vague 2: Too abbreviated 3: Fine Most popular untagged variable Variables with feedback:
Selected variables: ans
def iterPower(base,exp): result=1 while exp>0: result*=base exp-=1 return result 1538 / 3853 sotutions
tag * base * 3846 + tag * exp * 2755 * tag * result * 3095.
M result 2495
a 8 b 8 F= result 2495
Mi ns 117
base 3735 exp 2C res 91
base 3735 exp 26 power 32
base 3735 exp 26 answer 31
7X 28
Figure 1-7: The Foobaz teacher interface. The teacher is presented with a scrollable list
of normalized solutions, each followed by a table of student-chosen variable names. Some names shown here have been labeled by the teacher as "misleading or vague," "too short," or "fine."
variable names. Students receive these labels in the form of a personalized active learning exercise, where they can learn from the good and bad variable name choices of fellow students.
Once created, these exercises are reusable for as long as the programming problem spec-ification is unchanged. In the first of two user studies, teachers quickly created exercises that could be personalized to the majority of student solutions collected from a Python programming MOOC. In the second of two user studies, fresh students wrote solutions to the same programming problems and received personalized feedback from the teachers in the previous study. A snapshot of this feedback, in the form of an active learning exercise, is shown in Figure 1-8. Foobaz demonstrates that teachers can efficiently give feedback at scale on variable naming, a critical aspect of readability.
You recently wrote the following solution, and we've replaced one variable's name with A: def iterPower(base,exp): A=1 for j in range(exp): A*=base return A
Rate the quality of the following names for the bold symbol A:
Name a number out result Compare to teacher
Figure 1-8: A personalized active learning activity as seen by the student. Students are
shown their own solution, with a variable name replaced by an arbitrary symbol, followed
by variable names for the student to consider and label using the same labels that were
available to the teacher. After the student has submitted their own judgments, the teacher labels are revealed, along with teacher comments.
1.4.3
Learnersourcing Personalized Hints
Personalization, in the form of one-on-one tutoring, has been a gold standard in educational psychology for decades [10]. It can be hard to get personalized help in large classes, especially when there are many varied solutions and bugs. Students who struggle, then succeed, become experts on writing particular solutions and fixing particular bugs. This thesis describes two workflows built on that insight, shown in Figure 1-9.
Unlike prior incarnations of assigning tasks to and collecting data from students, also known as learnersourcing [60], these workflows collect and distribute hints written only by students who earned the expertise necessary to write them. Both workflows give students an opportunity to reflect on their own technical successes and mistakes, which is helpful for learning [27] and currently lacking in the engineering education status quo [120]. One of the two workflows also systematically exposes students to some of the variation present in other student solutions, as recommended by theories from educational psychology, specifically variation theory [77] and analogical learning theory [67, 74].
These workflows were applied to programming problems in an undergraduate digital circuit programming class with hundreds of students. Field deployments and an in-lab study show that students can create helpful hints for their peers that augment or even replace the personalized support of teachers.
1.4.4
Systems as Answers
While they are not the only answers or complete answers to the research questions that motivated this thesis, these systems shed new light on how to support teachers and students in massive programming classes.
(R1) Understanding Variation at Scale
The OverCode and Foobaz systems both give teachers a better understanding of student solutions and how they vary in approach and readability. OverCode allows teachers to more quickly develop a high-level view of student understanding and misconceptions. Foobaz displays the variety of common and uncommon variable names in student solutions to a single programming problem, so teachers can better understand student naming practices. The clustering and visualization techniques created for both these systems provide some new answers to the research question R1 for introductory Python problems.
(R2) Feedback on Approach and Readability at Scale
OverCode is also an answer to the research question R2. With OverCode, teachers produced feedback on solution approaches that was relevant to more student solutions, compared to feedback informed by status quo tools.
Student
Run teacher's tests
on buggy solution
Receive nto about next failed test
* Revise so utnon
Rerun teacher's tests
Test passed? All tests passed
No
Debugging hints 4 indexed by
failed test
case
Generate
deYuegm hint
Yes (optiona,
Se f il (cton Work flow
Comparison Workflow
Submit correct Previously submitted
soluton
correct solutions
Compare to worse Compare to better
solution solution
Generate Generate
opt mization hint optmtzaton I
Optimization hints indexed by current -perforrance
Student 2
Submit correct solut lon Optimizosolution
Figure 1-9: In the self-re/lection workflow, students generate hints by reflecting on an obstacle they themselves have recently overcome. In the comparison workflow, students compare their own solutions to those of other students, generating a hint as a byproduct of explaining how one might get fronm one solution to the other.
(R3) Personalized Feedback on Approach and Readability at Scale
To create Foobaz, the challenge of delivering personalized feedback on approach and
readability at scale was narrowed down to just one critical aspect of readability: variable names. In a one-on-one scenario, a teacher helping a student might notice that the student is choosing poor variable names. The teacher might start a conversation about both their good and bad variable naming choices. In a massive classroom where that kind of chat is not possible, Foobaz delivers personalized active learning exercises intended to spark the same thought processes in the student. Foobaz helps answer R3 by demonstrating how teachers can compose automatically personalized feedback on an aspect of readability to students at
scale.
(R4) Personalized Feedback at Scale
The two novel workflows that collect and deliver personalized student-written hints address this final research question in a general way. Their instantiations as systems deployed in an undergraduate engineering course demonstrated that, given appropriate design choices and prompts, students can give personalized feedback in large-scale courses.
1.5 Thesis Statement and Contributions
The systems described in this thesis show various mechanisms for handling and taking advantage of solution variation in massive programming courses. Students produce many variations of solutions to a problem, running into common and uncommon bugs along the way. Students can be pure producers whose solutions are analyzed and displayed to teachers. Alternatively, students can be prompted to generate analysis of their own and others' solutions, for the benefit of themselves and current and future students.
Clustering and visualizing solution variation collected from programming courses can help teachers gain insights into student design choices, detect autograder failures, award partial credit, use targeted learnersourcing to collect hints for other students, and give personalized style feedback at scale.
The main contributions of this thesis are:
- An algorithm that uses the behavior of variables to help cluster Python solutions and generate the platonic solution for each cluster. Platonic solutions are readable and encode both static and dynamic information, i.e., the syntax carries the static
information and the variable name encodes dynamic information.
- A novel visualization that highlights similarity and variation among thousands of Python solutions while displaying platonic solutions for each variant.
" Two user studies that show this visualization is useful for giving teachers a bird's-eye
view of thousands of students' Python solutions.
" A grading interface that shows similarity and variation among Python solutions, with
faceted browsing so teachers can filter solutions by error signature, i.e., the test cases they pass and fail.
" Two field deployments of the grading interface within introductory Python
program-ming exam grading sessions.
" A technique for displaying clusters of Python solutions with only an aspect, i.e.,
variable names and roles, of each cluster exposed, revealing the details that are relevant to the task.
" A workflow for generating personalized active learning exercises, emulating how a
teacher might socratically discuss good and bad choices with a student while they review the student's solution together.
" An implementation of the above technique and method for variable naming.
" Two lab studies which evaluate both the teacher and student experience of the workflow
applied to variable names.
" A self-reflection learnersourcing workflow in which students generate hints for each
debugging their solution.
* A comparison learnersourcing workflow in which students generate design hints for each other by comparing their own solutions to alternative designs submitted by other
students.
" Deployments of both workflows in a 200-student digital circuit programming class,
and an in-depth lab study with 9 participants.
1.6 Thesis Overview
Chapter 2 summarizes prior and contemporary relevant research on systems that support programming education. It also briefly explains theories from the learning sciences and psychology literature that influenced or support the pedagogical value of the design choices made within this thesis.
The four chapters that follow describe various ways that solution variation in large-scale programming courses can be clustered and visualized. These chapters include evaluations on archived data or in the field.
- OverCode (Chapter 3) visualizes thousands of programming solutions using static and dynamic analysis to cluster similar solutions. This chapter also describes Grover-Code, an extension of OverCode optimized for grading correct and incorrect student solutions.
- Foobaz (Chapter 4) clusters variables in student solutions by their names and behavior so that teachers can give feedback on variable naming. Rather than requiring the teacher to comment on thousands of students individually, Foobaz generates person-alized quizzes that help students evaluate their own names by comparing them with good and bad names from other students.
* Chapter 5 describes two learnersourcing workflows that collect and group hints for solutions indexed by autograder test failures or performance characteristics like size or speed. They help students reflect on their debugging or optimization process and
write hints that can help other students with a similar problem.
* Chapter 6 describes Bayesian clustering and mixture modeling algorithms applied to the OverCode pipeline output for extracting additional insight into patterns within student solutions.
Chapter 7 discusses some of the insights that came out of building and testing the systems in this thesis. Chapter 8 outlines avenues of future work on the systems and ideas in this thesis, in combination with the complementary work of others in this space.
Related Work
Systems that help students in massive programming courses may build on work from program analysis, program synthesis, crowd workflows, user interface design, machine learning, intelligent tutoring systems, natural language processing, data mining, and learning science. This chapter summarizes relevant technical and psychological work that supports the pedagogical value of the systems developed in this thesis and gives context to the technical contributions.
2.1
Clustering
Grouping similar items, i.e., clustering, is a fundamental human activity for organizing, mak-ing sense of, and drawmak-ing conclusions from data. Across many scientific fields, clustermak-ing goes by different names but serves a common purpose: helping humans explore, interpret, and summarize data [52].
Clustering is unsupervised machine learning. There are no labels, no ground truth. For example, is there one true clustering of all the articles the New York Times ever published? Humans have goals, and how useful clusters are to them is all that matters. A human can
look at collections of items and group them in various ways. For example, a collection of dogs could be grouped according to their size or the color of their fur. Both clusterings are equally valid, but if a dog walker is deciding which dogs to walk together, clustering by size is more useful.
In order for computers to cluster items, the system designer needs to choose a representation for the items, possibly select or extract features from that representation, choose a clustering method, and assess the validity of its results. The chosen representation effects every
subsequent step of the clustering process [52]. The representation might be an image or a set
of attributes, also called features, like weight, height, and fur color. Since the clustering is performed for a human with a goal, the representation ideally captures aspects of the items that are relevant to that goal.
Further customizing the item representation for the human goal, also known as feature
extraction, is optional but often very helpful. Feature extraction is computing new features
about each item from the original representation. These new features may better capture the aspects of items that are relevant to the human goal. For example, if the goal is to partition dogs by fur color and dogs are represented by images, one might extract the most common color in every dog image.
A second optional step isfeature selection, the process of determining what features can be
ignored because they are irrelevant to the human goal. For example, if the goal is to partition dogs by fur color and dogs are represented by collections of features, then only the fur color feature may be selected, ignoring height and weight.
Hopefully, after choosing a representation and possibly performing feature selection and extraction, some items are closer to each other than they are to others, with respect to some aspect of the items the human cares about. If a computer is to verify this, one needs to define exactly what the closer means. The computer needs a human to define a distance function that quantifies how close or far items are from each other.
are closer to each other than they are to items in other groups. There is no one best method for all clustering problems, but some methods produce clusters that support the human's problem-specific goal better than others. Many methods require the human to provide additional parameters, such as how similar two items need to be to be grouped together or how many clusters to look for.
Some methods have an objectivefunction that quantifies some desirable characteristic of clusters to maximize or some undesirable characteristic of clusters to minimize [52]. One objective function sums up how different each item is from its cluster center. Presumably, the smaller the differences, the better the clustering. Specific clustering algorithms may define different centers for each cluster, tally up the differences in different ways, and follow different processes to minimize the objective function.
Some methods are more easily characterized by their process than their objective function. For example, hierarchical clustering methods are characterized as either:
" agglomerative or bottom-up, by merging individual items into small clusters, then merging small clusters into larger clusters, etc., or
" divisive or top-down, by splitting the entire collection of items into clusters, then split-ting those clusters into further clusters, until all clusters only contain one item [134].
The objective functions used in these methods help determine which clusters to merge or split.
Some statistical clustering methods, such as mixture models, assume that the items are samples from underlying, unseen distributions of items. By making some assumptions about what those distributions might look like, an algorithm can map items to clusters to maximize a statistical measure of fit between the observed data and the unobserved distributions. The types of clusters produced by clustering algorithms can be partitioned in several ways [131], such as:
items can partially belong in different degrees to multiple clusters, the method is soft. - Partition vs. overlap vs. hierarchy: If each item belongs to one and only one cluster, the method is producing strict partitions. If each item belongs to one or more clusters, than the method is producing overlapping clusters. If each item belongs to one cluster and clusters are strictly contained by other clusters, the method is hierarchical. Some methods do not produce clusters of items, but rather clusters of components within items. For example, Latent Dirichlet Allocation (LDA) [9] does not cluster entire documents. It produces a hard, strict partition of words into different clusters, typically called topics. At the level of documents, however, this can look like a soft clustering: an individual document might be 50% hospital-related words, 30% government-related words, and 20% negotiation-related words.
Clusters are hard to objectively evaluate. It is expensive and time consuming to bring in humans with goals to evaluate how useful the clusters are to them. Cluster validation refers to the metrics used to approximate the quality of clusters with little or no human input [134]. These metrics can be the basis of choosing one method over another, one parameter value over another, or one clustering over another quickly but approximately. Note that a clustering may have good quality scores with respect to those cluster validation metrics, but if it is difficult for the human to understand what each cluster contains, they may have trouble using it to achieve their goals. Therefore, there are a growing number of methods that are designed with interpretability in mind.
Another way to produce more helpful clusterings is to involve the human in an interactive process. The clustering algorithm produces clusters and gives the human one or more ways to give feedback. Feedback could be in the form of indicating what is good or bad about this clustering. Feedback could be the human reaching in and directly moving an item from one cluster to another. The method reruns, based on this new information, and produces a
new clustering for the human to evaluate and give feedback on.
There are thousands of published papers and working systems that use combinations of these properties and strategies. When comparing two systems that cluster, it is helpful to
break the comparison down by representation, features, distance function, objective function, and algorithm they use as well as the type of clusters they produce. In subsequent sections, this language will be used to help describe the many different code analysis and clustering processes found in related work.
2.2
Mining Solution Variation
One important aspect of both engineering and design is that there are multiple ways to solve the same problem, each with their own trade-offs. The consequences of these design choices can be significant. Suboptimal solutions, including poorly designed code, can have high personal, safety, and economic costs.
It may be possible to learn good and bad practices from large collections of previous solutions by looking at common and uncommon choices and making judgements about their successes and trade-offs. In order to understand the space of current solutions, there are many questions one could ask. In the face of a common design choice, what do designers most commonly pick'? Has this changed over time? What are popular design alternatives? What are examples of design failures that should be learned from and never repeated? What are examples of design innovations that are clearly head-and-shoulders above the rest? The answers to these questions could fuel education about designing solutions that complies with variation theory recommendations. OverCode, Foobaz, and the comparison learnersourcing workflow try to answer these questions for student solutions written in code.
2.2.1
Code Outside the Classroom
Web pages
Ritchie et al. [97] describe a user interface for finding design examples from a curated database of web pages. Their work is intended to support designers who like to refer to