HAL Id: hal-01591148
https://hal.archives-ouvertes.fr/hal-01591148
Submitted on 20 Sep 2017HAL is a multi-disciplinary open access archive for the deposit and dissemination of sci-entific research documents, whether they are pub-lished or not. The documents may come from teaching and research institutions in France or abroad, or from public or private research centers.
L’archive ouverte pluridisciplinaire HAL, est destinée au dépôt et à la diffusion de documents scientifiques de niveau recherche, publiés ou non, émanant des établissements d’enseignement et de recherche français ou étrangers, des laboratoires publics ou privés.
Prediction of dry matter intake of lactating dairy cows
with daily live weight and milk production
measurements
Philippe Faverdin, A. Charrier, Amélie Fischer
To cite this version:
Philippe Faverdin, A. Charrier, Amélie Fischer. Prediction of dry matter intake of lactating dairy cows with daily live weight and milk production measurements. 8. European Conference on Precision Livestock Farming (ECPLF), Sep 2017, Nantes, France. �hal-01591148�
Prediction of dry matter intake of lactating dairy cows with daily live weight and milk production measurements
P. Faverdin1, A. Charrier1 and A. Fischer1,2
1
Agrocampus Ouest, INRA, PEGASE, F-35590 Saint-Gilles, France
2Institut de l’élevage, Department of animal husbandry techniques and
environment, F-35650 Le Rheu, France
Philippe.faverdin@inra.fr
Abstract
In dairy farming, monitoring tools are developing rapidly and the possibility of combining available data to generate additional information raises new questions. The high throughput body weight is a new and frequent phenotype on dairy farms. Feed intake monitoring in dairy cows remains largely absent, even though it is useful for herd management. The purpose of this work was to predict the dynamics of dry matter intake with a model using live weight, milk production and ration characteristics. This model is based on the assumption that changes in body weight are closely related to dry matter intake through two components: short-term changes in digestive content related to ingestion and long-term changes in body reserves, which are linked to the cumulative energy balance of the cow since calving. The energy balance results from the difference between the energy inputs from the ingested quantities and the energy requirements related to milk production. The model was tested in a trial with 65 cows receiving the same complete ration during the first 18 weeks of lactation. Observed individual intake was predicted well by the model, with average weekly errors of 2.3 kg, although the daily errors are still high (SD = 3.31 kg). Intake prediction during the first month of lactation showed a systematic bias and further investigation will be necessary to understand this bias and correct it.
Keywords: intake, dairy cow, body weight, dynamic model, digestive content,
body reserves
Introduction
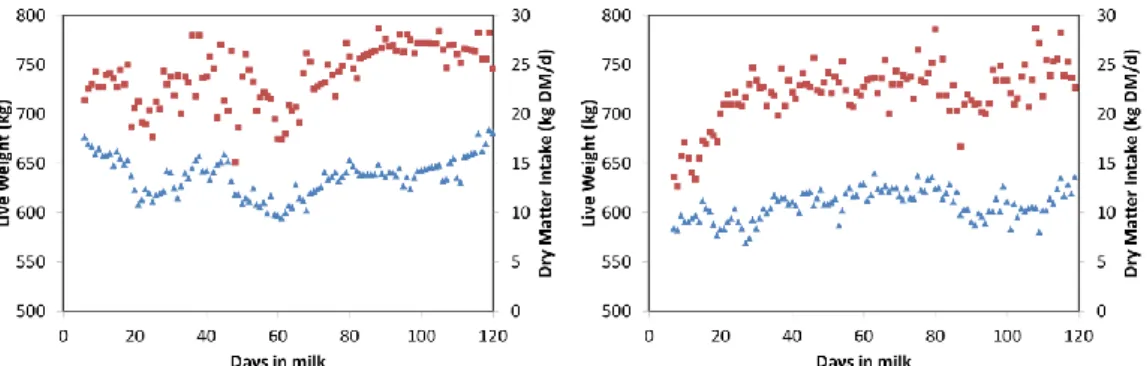
Precision livestock farming is booming, especially in the dairy sector where individual monitoring is most common. Data on milk production and animal weights are now widely available on commercial farms. However, feed intake monitoring in dairy cows remains largely absent, even though it is useful for herd management. Feed intake kinetics throughout the lactation appear to be closely correlated with body weight kinetics throughout the lactation (Figure 1)
and with milk yield kinetics. Combining daily body weight and milk yield measurements could therefore be a potential predictor of phenotypes which is still difficult to assess on the farm. The main purpose of the present study was to predict dry matter intake from daily changes in body weight and milk yield.
Recent studies have shown that a combination of changes in body weight and body condition scores is a good method of estimating energy changes in body reserves (Banos et al., 2005, Friggens et al., 2011, Thorup et al., 2012). Changes in live weight are therefore an interesting and accessible phenotype for estimating changes in body reserves. Live weight is composed of four main components: “bone mass”, “lean mass” which is rich in water and protein, “fat mass” which is rich in lipids from reserves and poor in water, and “digestive contents” representing about one-quarter of live weight in lactating cows. Due to its different components, it is still difficult to relate the variation in live weight to variations in body reserves. The use of live weight to estimate body reserves therefore requires an estimate of digestive contents (Friggens et al., 2011; Thorup et al., 2012). At the beginning of lactation, digestive contents increase greatly because of the rapid increase in DMI and partially mask the loss of empty body weight related to the mobilisation of body reserves. To overcome the problem of missing intake data, the weight of the digestive contents was at best a function of the live weight used to calculate empty body weight (Friggens et al., 2011).
The objective of this work was to better interpret live weight changes in relation to dry matter intake and energy balance in two steps:
- use of a simple live weight model to better estimate the importance of dry matter intake in the weight of the digestive contents and the importance of energy balance to explain variations in empty live weight
- extrapolation of these parameters from the live weight model to a dynamic mechanistic model using daily live weight and milk production data to predict dry matter intake.
The aim of this study was to achieve a proof of concept that the daily live weight will give interesting added value to milk yield data used to predict dry matter intake variations for monitoring dairy cows.
Figure 1: Example of daily intake (square) and live weight after morning milking (triangle) of two lactating cows during the first part of lactation.
Materials and methods
Experimental dataset
The data used are based on an experiment carried out at the INRA experimental farm in Méjusseaume (INRA URM PEGASE) to study the variability in feed efficiency of dairy cows during lactation. These data cover the first 120 days after calving in 65 Prim'Holstein dairy cows (from September 2014 to February 2015). The experimental group of cows was composed of 34 primiparous and 31 multiparous cows.
The cows were milked twice a day (7:00 and 16:00) and fed after each milking with an iso-protein and iso-energy ration based on maize silage. The maize-based diet was offered as a total mixed ration with 64.7% maize silage, 13.5% cereal based compound, 10.5% soyabean meal, 10% dried lucerne and 1.3% mineral, vitamin and ammonium sulphate mixture. The cows were fed individually ad libitum twice daily after milking with individual uneaten feed levels of 10% on average.
The amount of each feed offered was weighed at each distribution by the robot feeder (“roulimetre”). The uneaten feed was weighed and removed from the trough each morning before the next distribution. The dry matter (DM) content of each feed was measured once a week for concentrated feed and each day for silage. The amount of feed dry matter intake (DMI) was then calculated daily as the difference in DM between the amounts offered and refused for each cow. The feed value of each component of the diet was determined by means of chemical composition analysis (departmental analysis laboratory of the LDA, Saint-Brieuc, France) and equations from INRA feeding systems (INRA, 2010).
The cows were weighed every day after milking using a static automatic weighing platform W-2000®, a prototype developed by Delaval (Tumba,
Sweden). Milk production was measured at each milking and then cumulated daily. The fat and protein content of the milk were analysed four times a week (on two days, at the morning and evening milking) to calculate milk net energy output.
Data measured every day over long periods may contain either missing data or some aberrant data due to operational problems (identification, weighing error, failure of the measuring instrument). For this type of model, reliable daily data are required. These aberrant values were detected using Loess local regressions. This is particularly suitable for nonstationary time series, which is the case in this study. The Loess was adjusted to the data for live weight (LW), milk yield (MY), DMI, milk fat content (MFC) and milk protein content (MPC). Any value outside an interval of plus or minus two standard deviations around this Loess was considered aberrant and deleted.
Live weight model
The live weight model hypothesises that changes in live weight are mainly due to changes in digestive contents and body reserves (equation 1):
𝛥𝐿𝑊 = 𝛥𝑑𝑖𝑔𝑒𝑠𝑡𝑖𝑣𝑒_𝑐𝑜𝑛𝑡𝑒𝑛𝑡 + 𝛥𝑏𝑜𝑑𝑦_𝑟𝑒𝑠𝑒𝑟𝑣𝑒𝑠 (1)
Throughout the study, only the morning LW was used, as it is less subject to variations due to meals as the first meal of the day starts just after weighing. In addition, weighing is carried out after milking when the udder is empty, which makes it possible to avoid the weight variations associated with milk production. The weight of the pregnant uterus and the foetus was disregarded because the study period was before 150 days of gestation when the gestation weight becomes truly significant (Ferrell et al., 1976).
The model assumes that changes in digestive contents are primarily related to changes in intake. For the component of body reserve changes in live weight variations, the model assumes that these variations are proportional to the energy balance (EB) of cows. This energy balance was calculated in terms of net energy (UFL) based on the INRA feeding system and tables 2010 (Faverdin et al., 2010) as the daily difference between the net energy intake (UFLi) and energy requirements (UFLreq) for milk production (function of MY, MFC and MPC) and maintenance (function of LW) (equation 2):
UFLreqt= MYt× [0.44 + 0.0055 × (MFC𝑡− 40) + 0.0033 × (MPC𝑡− 31)]
+(1.54 + 0.0066 × LW𝑡) (2)
A positive EB indicates that the energy intake is higher than the energy required, this excess of energy being stored as body reserves. Conversely, a negative EB is interpreted as a deficit in energy; this lack of energy is covered by mobilisation of body reserves. The cumulative EB (cumulated energy balance, CEB) throughout the lactation thus reflects changes in body reserves after calving.
Daily live weight can thus be considered as a function of the previous day’s DMI for digestive contents and of CEB since calving for body reserve changes. This assumption is modelled in equation 3. The live weight at calving (LW0)
represents the initial situation and is useful when the average body size of the cows is considered:
LWt= α × CEBt-1+ δ × DMIt-1+ γ × LW0 (3)
This model was simply estimated by linear regression of the available dataset, considering the coefficients , , to be identical for all the cows because they were all fed with the same ration every day. The coefficient can be used to convert the mobilisation of body reserves into UFL per kg of live weight and the coefficient represents the changes in digestive content, corresponding to a change in intake of one kg of DM. These coefficients were then reused in the intake model.
Dry matter intake model
In equation 2 above, intake is used to calculate the CEB (medium and long term effect) and digestive contents (short-term effect). The idea was to construct a deterministic model from a mathematical sequence of DM intake defined by recursion at daily time intervals starting at calving and using the high throughput data for live weight and milk production (to calculate the animal's energy requirements). The variation in daily LW between two days (t and t-1) can be simply estimated using equation 4:
LWt− LWt-1= α(UFLit-1− UFLreqt-1) + δ × (DMIt-1− DMIt-2) (4)
The daily energy intake, UFLi is theoretically the product of energy density (UFLration UFL/kg DM) of the ration and intake (kg DM/d). The UFLration is calculated as the weighted sum of the feed energy values. However, due to digestive interactions, the energy density of the ration per kg of DM is not constant. To simplify the model, a simple regression correction (equation 5) was used based on simulation of the densities calculated with the INRA reference method (Faverdin et al., 2010):
𝑈𝐹𝐿𝑖 = 0.863 × (𝐷𝑀𝐼 × 𝑈𝐹𝐿𝑟𝑎𝑡𝑖𝑜𝑛) + 1.35 (5)
This UFL correction model is only valid for a ration similar to the one used in this study and must be adjusted for different rations. By combining equations (4) and (5), DMIt-1 can be isolated from equation (6):
𝐷𝑀𝐼t-1=(𝐿𝑊t −𝐿𝑊t -1−1.35×𝛼+𝛿×𝐷𝑀𝐼t-2+𝛼×𝑈𝐹𝐿𝑟𝑒𝑞t-1)
To simulate the DMI with the model, it is therefore sufficient to estimate an initial value of DMI at t=0 and to have continuous monitoring of the LW and the MY. The predicted DMI values are compared with those measured in the experiment. To test the validity of the prediction, the root mean square error (RMSE) was estimated as the sum of the squared differences between the measured and predicted values divided by the number of values. Model calculations and statistical analyses were performed on version 3.1.2 of the R® statistical software (R Core Team, 2015).
Results and discussion
The linear regression to predict LW gives the following equation:
LWt= 35.4 + 0.206 (±0.004) × CEBt-1+ 4.62 (±0.09) × DMIt-1+ 0.818(±0.005) × LW0
where n=7466, RSE = 25.2 kg and R²=0.875
The coefficients obtained in this model are very consistent with the literature. The coefficient 0.206 related to the energy balance means that the loss of one kg of live weight corresponds approximately to an energy value of 5 UFL, which is very close to the interval of 4 to 6 UFL/kg LW proposed by Chilliard et al. (1987) for the mobilisation of reserves. It is likely that the energy value of one kg LW mobilised is less than the energy required to store one kg LW. Because the experimental period focused on the start of lactation (1-120 days), the coefficient of CEB may only reflect the energy value of one kilogram of mobilisation. Similarly, the coefficient of 4.62 digestive content per 1 kg of ingested DM is close to that proposed by Pithon (1975) and slightly higher than that proposed by Rémond (1988). These two coefficients are used in the intake model (equation 6b):
𝐷𝑀𝐼t-1=(𝐿𝑊
t −𝐿𝑊t -1−1.35×0.206+4.62×𝐷𝑀𝐼t-2+0.206×𝑈𝐹𝐿𝑟𝑒𝑞t-1) 4.62+0.86×0.206×𝑈𝐹𝐿𝑟𝑎𝑡𝑖𝑜𝑛t-1 (6b)
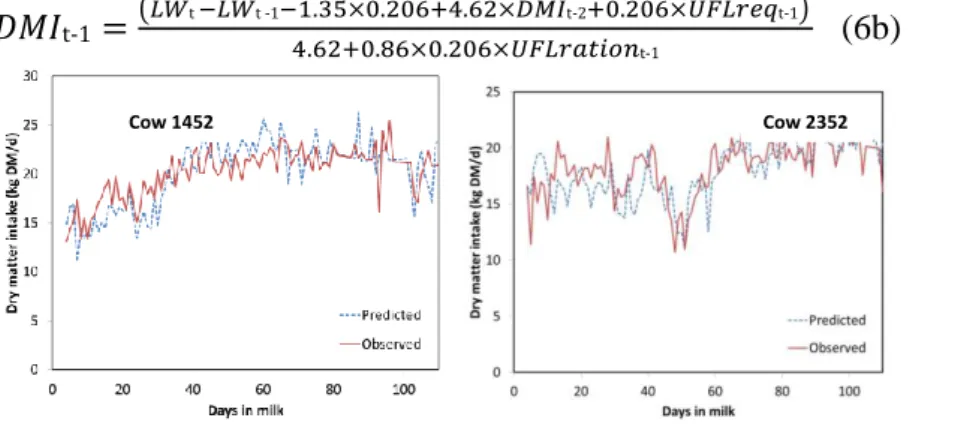
Figure 2: Evolution of observed ( ____ ) and estimated (- - - ) dry matter intake using the intake model for two cows 1452 (normal) and 2352 (with drop in the middle) during the first 120 days of lactation.
Comparison of simulated DMI values from equation (5) and observed values gives an average RMSE of 3.31 kg DM, the standard deviation of DMI being 3.85 kg DM. This large error is reduced when average values are compared at a weekly level (2.3 kg DM). This is due to the fact that large daily variations in the DMI model are not synchronous with the day to day observations. Nevertheless, this quality of prediction varies greatly from one cow to another. Figure 2 shows a good fit between the kinetics and the model based on observation date, with an RMSE of 2.3 and 2.1 kg DM, respectively, for the two cows 1452 and 2352. The trace for cow 2352 (Figure 2) shows that the model is capable of estimating short-term decreases in DMI and simulating “non-standard” curves. On the other hand, the DMI of other cows is a poor match, with significant biases. Two main phenomena explain these biases: the stage of lactation and the differences in feed efficiency between cows.
Figure 3: Evolution of the dry matter intake residuals model for 65 cows during the first 120 days of lactation. The line indicates the average value for residuals obtained with Loess smoothing. It clearly indicates a bias in the model in early lactation.
The residues are higher during the first 40 days in milk and present a bias with underestimation of DMI. This early lactation bias is present for the majority of cows (Figure 3), and is more or less pronounced for some individual curves (Figure 2). This lack of adjustment suggests that the model is unable to take account of important phenomena in early lactation, which leads to underestimation of DMI after calving. A first hypothesis relates to the stability of the coefficients used with the stage of lactation. It is possible that the variation of one kg of weight does not correspond to the same energy value, depending on
Residuals of DMI prediction (kg
DM/d)
the stage (Moe et al., 1971, Doreau and Rémond 1982, Faverdin et al. 2006). A second hypothesis, based on the results of Doreau and Rémond (1982) and Doreau et al. (1988), is that feed digestibility is lower in early lactation than in the rest of lactation. According to Doreau and Rémond (1982) and Doreau et al. (1988), digestibility decreases until 4 to 6 weeks after calving, when the average residuals in the DMI model are highest. It would be interesting to correct the energy inputs in early lactation in the EB calculation, although this is not currently taken into account by feeding systems.
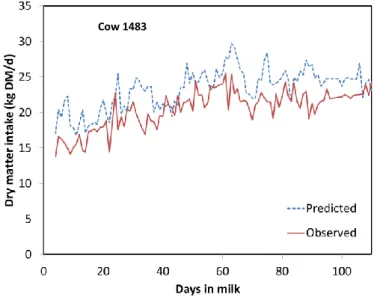
Figure 4: Observed ( ____ ) and estimated (- - - ) evolution of dry matter intake during the first 120 days of lactation for a very efficient cow. The model does not simulate the level of feed intake during the whole period (RMSEP = 3.4 kg DM/day), but simulates the variations satisfactorily.
Another bias present for some cows appears to be related to differences in feed efficiency between cows. The bias sometimes appears systematically over the entire period. Figure 4 illustrates this situation. The DMI estimated by the model has a similar pattern to the observed DMI, but systematically shifted upwards. A cow with poor feed efficiency will present the opposite trend. In practice, this bias is probably less important because it does not mask the kinetics of DMI.
Finally, the model is very sensitive to the initial conditions. Since the model is constructed as a series in which DMI tests a DMIt-1 function, the initial data in
the series plays an essential role in terms of the quality of the estimates. Initial live weight or intake values which differ too much from the trend will generate biased estimates during a large part of the simulation.
Conclusions
High-throughput live weight measurements are a useful means of estimating individual intakes. Changes in this weight are due both to changes in medium and long-term energy balance reserves and to shorter-term changes in digestive contents, which account for one-quarter of the live weight of the cow. These two components are sensitive to variations in dry matter intake. A simple model based on variations in live weight and production can simulate short- and medium-term variations in dry matter intake and make it possible to detect abnormal evolutions. However the energy models used suffer from significant biases at the beginning of lactation which must be better understood before we can estimate changes in individual dry matter intake during this critical period.
Acknowledgements
The authors thank the “GIS Elevage Demain” for supporting the study and all the staff of the INRA experimental farm at Méjusseaume (UMR PEGASE) for their management of the experiment.
References
Banos, G., Coffey, M. P. and Brotherstone, S. 2005. Modeling daily energy balance of dairy cows in the first three lactations. Journal of Dairy Science
88 (6) 2226–37.
Chilliard, Y., Rémond, B., Agabriel, J., Robelin, J. and Vérité, R., 1987. Variations du contenu digestif et des réserves corporelles au cours du cycle gestation - lactation. Bulletin Technique du Centre de Recherches
Zootechniques et Vétérinaires de Theix 70 117-131.
Doreau, M., Rémond, B. 1982. Comportement alimentaire et utilisation digestive d’une ration de composition constante chez la vache laitière en fin de gestation et début de lactation. Reproduction Nutrition Développement 22 (2) 307–24.
Doreau, M., Adingra, K., Rémond, B., and Chilliard, Y. 1988. Effets respectifs des Quantités ingérées et du stade physiologique sur la digestibilité d’une même ration chez la vache laitière. Reproduction Nutrition
Développement 28 (Suppl.1) 63–64.
Faverdin, P., Delagarde, R., Delaby, L., and Meschy F. 2010. Alimentation des vaches laitières. In Alimentation des bovins, ovins, caprins. Quae Editions, Versailles. 23-58.
Ferrell, C.L., Garrett, W.N., and Hinman, N. 1976. Growth, development and composition of udder and gravid uterus of beef heifers during pregnancy.
Journal of Animal Science 42 1477-1489.
Friggens, N.C., Thorup, V.M., and Edwards, D. 2011. Estimation à la ferme du bilan énergétique des vaches laitières à l’aide des mesures fréquentes de poids vif et de note d’état corporel. Rencontres Recherches Ruminants 18 39–42.
INRA, 2010. Alimentation des bovins, ovins et caprins. Besoins des animaux –
Valeurs des aliments. Quae Editions, Versailles, 312pp.
Moe, P. W., Tyrrell, H. F., and Flatt, W. P. 1971. Energetics of body tissue mobilization. Journal of Dairy Science 54 (4) 548–53.
Piton, J. 1975. Intérêt et importance de la mobilisation des réserves corporelles des vaches laitières au début de la lactation : analyse de quelques facteurs de variation. Thèse Université des Sciences et Techniques du
Languedoc. Montpellier. 57pp.
R Core Team, 2015. R® statistical software. http://www.R-project.org.
Rémond, B. 1988. Evolution du poids du contenu du réticulo-rumen chez les vaches laitières au cours des deux premiers mois de la lactation.,”
Reproduction Nutrition Développement 28 (Suppl.1) 109-110.
Thorup, V. M., Edwards, D., Friggens, N. C. 2012. On-farm estimation of energy balance in dairy cows using only frequent body weight measurements and body condition score. Journal of Dairy Science 95 (4) 1784–93.