i
Degree Programme
Systems Engineering
Major Infotronics
Bachelor’s thesis
Diploma 2019
Augsburger Nassim
Sensor of hyperpolarized
129
Xe inside blood
Professor
D j a n o K a n d a s w a m y Expert
J e a n - N o ë l H ya c i n t h e Submission date of the report
ii
This document is the original report written by the student. It wasn’t corrected and may contain inaccuracies and errors.
Contents
Table of Figures ... iv
Glossary and Acronyms ... vi
1. Aim ... 1
1.1 Context ... 1
1.2 How does a NMR work? ... 3
1.3 Hyperpolarized 129Xe ... 7
1.4 Cryptophane cage ... 9
2. Existing NMR device ... 11
2.1 Low-field NMR spectrometer ... 11
2.2 Existing standalone portable NMR spectrometer HF ... 12
2.3 Existing Small devices ... 13
2.4 Open source NMR ... 13
3. Schematic diagram ... 14
4. Risk analysis ... 15
4.1 SNR ... 15
4.2 Field homogeneity/External perturbation ... 17
4.3 Electronic device... 18
5. Specifications and sizing ... 20
5.1 Physical and chemical specifications ... 20
5.2 Magnetic specifications ... 21
5.3 Electronic specification ... 23
5.4 Field B0 production ... 23
5.5 Field B1 production ... 30
5.6 B1 Magnetometer ... 35
5.7 ADC (Analog to Digital Converter) ... 40
5.8 DAC (Digital to Analog Converter) + AC Amplifier ... 41
5.9 LNA (Low Noise Amplifier) ... 45
5.10 μC (microcontroller) ... 46
5.11 IC/FPGA ... 47
5.12 FPRF Field-programmable RF ... 48
5.13 RPi with FPGA and PMOD DAC and ADC ... 48
6. Tasks implemented ... 49
iii
This document is the original report written by the student. It wasn’t corrected and may contain inaccuracies and errors.
6.2 Air-coil design ... 52
6.3 Impedance Matching/ Coil tuning ... 53
6.4 Ringing suppressor ... 54
7. Electronics implementation ... 56
7.1 Existing Spectrometer ... 56
7.2 FPGA implementation ... 58
7.3 Power Supply and DC/DC converter... 62
7.4 Analog circuit implementation ... 63
7.5 Raspberry PI implementation ... 64
7.6 Communication protocol between FPGA and Raspberry PI ... 64
8. Discussion ... 65 9. Conclusion ... 65 10. Outlook ... 66 11. References ... 67 12. Credits... 71 13. Annexes ... 72
13.1 Terranova-MRI, Earths field MRI & NMR teaching system [48] ... 72
13.2 Profile NMR-Mouse one-sided NMR ... 73
13.3 Low-Field NMR Systems Using LabVIEW™ and Advanced Data-Acquisition Techniques [0] ... 74
13.4 The mq-ProFiler [51]... 76
13.5 Opencore NMR ... 77
13.6 picoSpin™ 80 Series II NMR Spectrometer ... 78
13.7 NMReady-60PRO ... 79
13.8 Helmholtz coils for field homogeneity ... 81
13.9 NDFEB HALBACH ARRAY ... 81
iv
This document is the original report written by the student. It wasn’t corrected and may contain inaccuracies and errors.
Table of Figures
Figure 1 : Physical characteristics of some usual nucleus used in NMR[2,p4] ... 3
Figure 2 : Representation of the orientation of ½ spin nuclei in a static field B0, each vector represents a nuclei on a cone and the total magnetization M0 is the addition of all the magnetic moment of the spin. M0 is paralel and in the same direction as B0 [2, p5] ... 3
Figure 3 The splitting of the nuclear energy levels under an applied magnetic field. The green spheres represent atomic nuclei which are either aligned with (low energy m=+1/2) or against (high energy m=-1/2) the magnetic field.[3] ... 4
Figure 4 Spectrum difference between a conventional and Optical pumping NMR [4] ... 5
Figure 5 Graph from a sequence of excitation and reception in x-axis the time and in y-axis the amplitude (not to scale) a) the flip angle α with the sinusoidal excitation b) the flip angle envelope c) the FID received signal after the B1 excitation d) the FID envelope[5] ... 5
Figure 6 Linearity of the retrieved spectrum for the addition [6] ... 6
Figure 7 Different Shaped Pulses used in MRI sequences, modulation of B1 amplitude with the same frequency[7] ... 6
Figure 8 On the left a cryptophane cage, on the right a linker which can be attached to the cage [12] ... 9
Figure 9 (a) change of the form of a molecular sensor and of the 129Xe electronic cloud (b) corresponding change in the chemical shift[12] ... 9
Figure 10 Schematic diagram NMR made with Visio ... 14
Figure 11 FID with shimming coil (left) without shimming coil (right). [21] ... 17
Figure 12 Quantification noise (vintage-audio-laser.com) ... 19
Figure 13 Equivalent electric circuit of the coil and the sample ... 21
Figure 14 Sketch of our NMR magnet system. The black part is a magnet base on which the ferrite magnets and iron discs are set with their magnetic attractive forces. The coil unit contains the magnetometer and the field B1 producer. [22] ... 25
Figure 15Iron disks can homogenize a field. Sketches of flux lines with (the right panel) and without (the left panel) iron discs (gray discs) are shown. These are simulations calculated with FEMM [22] ... 25
Figure 16 arrangement of ferrite magnets in black with multiple iron plate in grey, the test tubes containing the HP 129Xe and the magnetometers and B1 producer are represented in orange ... 26
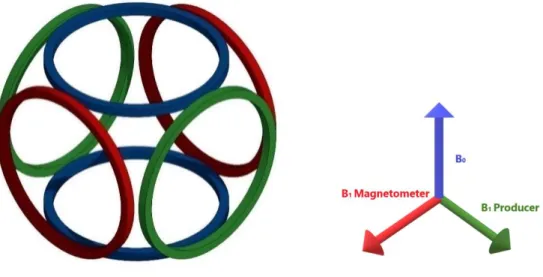
Figure 17 eight Halbach arrays with each 8 magnets, this arrangement is inside a plastic plate. Shimming magnets are represented in red; the sample, the magnetometer and the field B1 producer are represented as blue cylinders ... 27
Figure 18 Helmholtz coils schematic drawing [24] ... 28
Figure 19 Schematic diagram of B1 producer in quadrature with B0 and the magnetometer ... 30
Figure 20 Equivalent circuit of a Solenoid ... 31
Figure 21 Estimation of the rotating frame magnetic field at the of various probe geometries. [25,p688]32 Figure 22 Summary of magnetometer techniques with corresponding performance. [28, p47] ... 36
Figure 23 Typical area of applications of the main magnetic field sensors [29] ... 37
Figure 24 Comparison of resolution of several main magnetic field with their frequency [29] ... 37
Figure 25 Junction de Josephson[30] ... 38
Figure 26 Difference between SAR and 𝛥 ADC [31] ... 40
Figure 27 downsizer of an NMR[32] ... 40
Figure 28 Schematic diagram of an AC amplifier [33] ... 41
Figure 29 Real pulse produce by a AC amplifier[33] ... 42
v
This document is the original report written by the student. It wasn’t corrected and may contain inaccuracies and errors.
Figure 31 Simplified system Diagram of a 7.5.3 Purepath® Digital Audio Power TI amplifier [36] ... 43
Figure 32 Block diagram of a stereo DAC with its different stages [35 p.13] ... 44
Figure 33 Schematic diagram of the NMR spectrometer working with a FPRF [41] ... 48
Figure 34 right: Icoboard FPGA left: TXDAC Pmod AD9760 10-bit 100MSPS TXDAC 12-bits [37] ... 48
Figure 35 Existing setup with power amplifier and console ... 49
Figure 36 The effect of thermal induction on the support of the made coil with Litz wire ... 50
Figure 37 Test of ringing with the lab setup at 50 khz. ... 51
Figure 38 Photo of a coil made around a test tube [42] ... 52
Figure 39 Impedance matching and tuning using capacitors ... 53
Figure 40 A method for tuning the NMR coil inside the magnet.[0, p35] ... 53
Figure 41 a) missed tune and missed match coil B) tune and match coil [6] ... 54
Figure 42 Q Damper electronic circuit. [44] ... 55
Figure 43 LT Spice circuit of a Q-Damper with a coil ... 55
Figure 44 Schematic diagram of the electronic implementation [0] ... 56
Figure 45 FPGA implementation diagram ... 58
Figure 46 Time diagram of a pulse sequence ... 59
Figure 47 State machine of the FPGA ... 59
Figure 48 Graphic representation of the Cordic algorithm[34] ... 61
Figure 49 Frequency vs Resolution ... 61
Figure 50 Recommended PCB Layout [59] ... 62
Figure 51 Practical board layout [46] ... 63
Figure 52 Terra-Nova NMR teaching device [48] ... 72
Figure 53 a) Alignment of the coil in quadrature of the earth’s magnetic field. b) Alignment of the probe to the earth magnetic field B0 [48] ... 72
Figure 54 on the left a NMR-Mouse (which contains a permanent magnet for B0 and a RF coil for B1) on the right a personal computer standing on a Kea2 spectrometer. [49] ... 73
Figure 55 The hardware architecture of the low -field NMR systems ... 74
Figure 56 The timing-diagram of a typical one-pulse NMR experiment. ... 75
Figure 57 mq-ProFiler used in the determination of fat content in fresh fish and meat[52] ... 76
Figure 58 OPENCORE NMR schematic principle ... 77
Figure 59 picoSpin™ 80 Series II NMR Spectrometer during its manual method of operation [54] ... 78
Figure 60 NMR 60 Pro [55] ... 79
Figure 61 AUTOsample-60 mounted on an NMR 60 Pro[55] ... 79
Figure 62 HC9 Helmholtz Coils and its PXI control system[56] ... 81
Figure 63 NDFEB HALBACH ARRAY [57] ... 81
Figure 64 Comparison table of different type of oscilloscope [58] ... 83
vi
This document is the original report written by the student. It wasn’t corrected and may contain inaccuracies and errors.
Glossary and Acronyms
ADC: Analog to Digital Converter: it samples an analogic signal with a given resolution and sampling frequency into a digital signal
B0: It is the static magnetic field which give the magnetization of a given atom population.
B1: It is the sinusoidal magnetic field applied within a given time which tilt the magnetization of a given atom population.
Chemical shift: It is the nuclear resonant frequency relative to the standard B0 given in ppm (part per million)
Cryptophane cage: a class of organic supramolecular compounds studied and synthesized primarily for molecular encapsulation and recognition. (cf. chapter Cryptophane cage for more details)
DAC: Digital to Analog Converter: transform a digital signal into an analogic signal
DNP: Dynamic nuclear pumping: one of the possible process to hyperpolarize a dipolar noble gas atom EMF: electromagnetic force
EMI: electromagnetic interference
FID: Free induction decay: the measurement signal of the NMR after the deflection of the equilibrium magnetization of the nuclear magnetic spin
G: Gauss unit for magnetic field 1 Tesla= 10’000 G
HF: High frequency: frequency between 3–30 MHz with a corresponding wavelength of 100–10 m HP: Hyperpolarization/hyperpolarized: polarization of an isochromat in a magnetic field far beyond Boltzmann thermal equilibrium.
Isochromat: a group of spins, which resonates at the same frequency and has a quantity enough to be statistically relevant
KSPS: Kilo sample per second
LF: Low Frequency: frequency between 30-300 kHz with a corresponding wavelength of 10km–1 km LOD: Limit of Detection: the effective minimum detectable quantity of FID
μ0: induction constant equals to 4π ∗ 10−7 𝑉∗𝑠𝐴∗𝑚 μC: microcontroller
MF: Medium Frequency:frequency between 300 kHz – 3 MHz with a corresponding wavelength of
1 km – 100 m
MRI: Magnetic Resonance Imaging NMR: Nuclear Magnetic Resonance
vii
This document is the original report written by the student. It wasn’t corrected and may contain inaccuracies and errors.
PCR plate: a flat plate with multiple holes used as small test tubes
PFBOC: PerBlucarbon-Based Oxygen Carrier: blood substitute use as substrate PPM: parts per million
RPi: Raspberry Pi: a small computer
RF: Radio Frequency: frequency between 3 kHz and 300 GHz used to communicate via electro-magnetic waves
RFPA: Radio Frequency Power Amplifier
SEOP: Spin-Exchange Optical Pumping: one of the possible process to hyperpolarize a dipolar noble gas atom
SNR: Signal to Noise Ratio
T1: Time constant for the longitudinal magnetization to return to 63% of its equilibrium value, it is also
called the spin-lattice or the longitudinal relaxation time T1∗: Apparent T1 resulted through experimentation
T2: Time taken by the transverse magnetization to return to 37% of its initial value, it is also called the
transverse relaxation time. [https://www.imaios.com/fr/e-Cours/e-MRI/RMN/relaxation-rmn] 𝑇2′ :
1
𝑇2′= γ ΔB𝑖 is the relaxation rate contribution attributable to field inhomogeneities (ΔB𝑖) across a
volume containing an isochromat. T2∗: 1 T2= 1 T2+ 1
T2′ apparent T2 resulted through experimentation THD: Total Harmonic Distortion
Verilog: a programming language used to configure a FPGA and its test bench
VHDL: Very High Speed Integrated Circuit
Hardware Description Language: it is used to represent
the behavior and architecture of a digital electronic system.
VSWR: Voltage Standing Wave Ratio: the power reflected from an antenna, which produces standing waves along the transmission line
129Xe: a noble gas used as biosensor (cf. 1.3Hyperpolarized 129Xe )
1
This document is the original report written by the student. It wasn’t corrected and may contain inaccuracies and errors.
1. Aim
1.1 Context
Each person’s blood is unique. To characterize this uniqueness, blood has to be analyzed at the cellular and atomic level. One possible technique for this is called Nuclear Magnetic Resonance (NMR). This technique could be applied in testing which narrow-band antibiotics is most effective against targeted bacterial infections. The NMR has the potential to tackle the issue of microbial resistance globally by tailoring our use of antibiotics to increase their efficiency. Moreover, NMR technology opens doors for a high-throughput screening method for drug discovery.
1.1.1 Overall functioning
The NMR technique relies on the fact that each atom has an intrinsic “resonance frequency”, which is dependent on the intensity of a generated static magnetic field (B0), the chemical
environment and the magnetic properties of the biosensor. In quadrature of B0, an exciting sinusoidal magnetic field B1 at the resonance frequency is produced for a given time. After the excitation phase, a weak-intensity free induction decay (FID) signal is retrieved. The spectrum of the FID signal permits to detect the kind and quantity of matter present in a given sample. This whole process aggregated in a single dimension NMR spectrometer using HP 129Xe and it is the core of this project.
1.1.2 Using
129Xe to offset the limitations of the existing NMR
Currently, NMR spectrometers are expensive, large, and non-portable. To produce powerful magnetic fields (a few tesla), large electromagnets are used and cooled with cryogenic liquid gas. Unlike conventional forms of angular momentum, spin does not arise from particle rotations, but rather form an intrinsic property of the particle itself. Their atomic nuclei exhibit a non-zero spin angular momentum and, in their ground state, have an associated dipolar magnetic moment. A nucleus exhibiting such a non-zero intrinsic angular momentum is the isotope 129Xe (1/2).
In order to avoid the size and cooling problem, the magnetic fields have to be reduced and with them the size of the magnets producing the static field B0. When, the intensity of the magnetic field B0 is decreased, the resolution is proportionally decreased. The proposed solution to keep the resolution despite the decrease of B0 is to use hyperpolarized noble gas, which will amplify the received signal by a factor of 100,000 without affecting the sample. 129Xe is a biocompatible noble gas that can maintain its polarization for an extended period of time in blood, compared to other chemical elements. This time is called T1. This increase in the signal intensity enables the possibility to enhance the sensitivity of the received signal (in particular, in MRI, the resolution of the images is increased). This permits a low-field NMR to work with a lower B0 and therefore producing portable and more affordable devices.
1.1.3 Purpose of the project as a whole LEVERAGING existing NMR TECHNOLOGY for MF
The first phase of this project is to attain sufficient understanding of the current NMR system, as such to be enabled to design a simplified device. In a second phase, through the understanding of the current limitations of the existing device, the tailoring of the device, specifically for blood analysis, with the use of hyperpolarized 129Xe. (which required lower frequencies than the traditional NMR) This project covers all aspects needed for the functioning of a MF NMR. Going from the chemistry to the software programing, as well as electronic design and electromagnetic/quantum physic.2
This document is the original report written by the student. It wasn’t corrected and may contain inaccuracies and errors.
Hyperpolarization techniques are not covered in this project. Hyperpolarizers are existing and can use SEOP or DNP techniques to produce HP 129Xe.[1]
The geometry and the design of the magnetic generator (producer of B1) and the
magnetometer (receptor of FID) mechanism of the current NMR technology must be optimized to receive and transmit the maximal signal with the least modifications (THD and noise).
A mechanism needs to be developed to introduce the HP 129Xe in the blood and replace the “depolarized” 129Xe, which have a limed time of life in its Hyperpolarized form(T1*), while the sequence of excitation is running.
Biological cages (cf. cryptophane cages) will be used to encapsulate the HP 129Xe. Chemical ligands are embedded on the outer surface of the cages. These ligands target specific blood
compounds and helps determining if they are present or not by changing the atomic cloud of the HP 129Xe. This will produce a frequency variation in the spectrum, called chemical shift. The HP 129Xe in the cages needs to be replaced as the HP 129Xe loses its polarization.
The HP 129Xe has a stock of magnetization. This stock is diminished by the temperature, by the contact with surroundings atoms and by changes in magnetic field. Moreover, other geometrical variables influence the intensity of the FID and should be considered in the design of the device. Ansys Maxwell cannot be used to simulate this. There is the need to develop a finite state magnetic
simulation software for HP gases with Matlab, Comsol or others to be able to optimize the design of the magnetometer and the field producer B1. This also improves the understanding of the behavior of HP gases in their surroundings.
1.1.4 Developing a magnetometer (coil dimensioning FPGA, control signals) and integrating
them into NMR technology (TO SOLVE MICROBIAL RESISTANCE)
In this thesis, a breakdown of the current technology is made as a basis for improvement to the NMR. The analysis is based on the different techniques used to generate and receive a magnetic field. In order to perform both of these functions, an air coil solenoid is designed and tested using Ansys Maxwell.
For this purpose, a physical prototype has been implemented by using existing electronic devices and chosen physical devices to test the air coil solenoid.
In a second phase, an electronic circuit board is developed to replace the existing electronic devices (the oscilloscope, the function generator and the lab amplifier). This circuit will produce the control signals and have specifications relative to the low frequencies used in the experiment. A TinyFPGA was chosen to implement the digital electronic and an analogic electronic circuit with existing IC and electronic components have been developed.
In the final stage of development, the standards on electrical safety and the electromagnetic compatibility (EMC) law in the medical environment have to be followed has depicted in section XX for the device to be commercially available (this implementation is beyond the scope of this work).
3
This document is the original report written by the student. It wasn’t corrected and may contain inaccuracies and errors.
1.2 How does a NMR work?
The reference book used for this chapter provides working knowledge of how an NMR works (from the chapter 1.1 to 1.9) [2]
The spin is an intrinsic propriety of each nucleus. The ½ spins nuclei acts as small magnet with a North and South Pole (i.e., a magnetic dipole). Nuclei with a null spin do not have magnetic
interaction. The spins larger than ½ have more poles that add more complexity and are not considered in this thesis. This thesis focusses specifically on NMR with hyperpolarized 129Xe.
Figure 1 : Physical characteristics of some usual nucleus used in NMR [2, p4]
The gyromagnetic ratio γ links the angular momentum jn and the magnetic moment mn
together in a nucleus.
mn= γjn [Equation 1]
The angular momentum of an atom can be compared to a magnetic spinning top. This angular momentum produces a magnetic moment.
Figure 2 : Representation of the orientation of ½ spin nuclei in a static field B0, each vector represents a nuclei on a cone and the total
magnetization M0 is the addition of all the magnetic moment of the spin. M0 is paralel and in the same direction as B0[2, p5]
In the presence of a static homogeneous magnetic field B0, the spins align along the magnetic field. However, not all spins are aligned with the magnetic field; some align against the magnetic field.
4
This document is the original report written by the student. It wasn’t corrected and may contain inaccuracies and errors.
The ones aligned with the magnetic field are in a low-energy state (m=-1/2) whereas the others are in a high-energy (m=+1/2). This is illustrated in the Figure 2.
At the thermal equilibrium and when |γ|ħB0≪ kBT, the total magnetization follows Curie’s Law:
M0≈ N γ2ħ2B0
4kBT [Equation 2]
, where M0 is the macroscopic magnetization, N is the number of spins , γ is the gyromagnetic
moment, ħ is the Plank constant divided by 2π, B0is the static magnetic field applied, kB is the
Boltzmann constant and T is the temperature in Kelvin.
This is followed by the Boltzmann's statistical distribution at the thermal equilibrium
n1
n2= e
(−∆E
kBT), with ∆E = γħB0 [Equation 3]
, n1 is the number of nuclei in a high energy state and n2 is the number of nuclei in a low energy state.
Figure 3 The splitting of the nuclear energy levels under an applied magnetic field. The green spheres represent atomic nuclei which are either aligned with (low energy m=+1/2) or against (high energy m=-1/2) the magnetic field.[3]
The difference of energy ∆E increases with the intensity of the magnetic field. In the equation of Boltzmann, this difference increases the number of nuclei in a high-energy state.
The polarization is given by the equation: P =n1−n2
n1+n2 [Equation 4].
When the polarization gets higher, the amplitude of the total magnetization M0 is also amplified.
The HP 129Xe is used to get a larger polarization than the one possible at equilibrium, as stated by the Boltzmann distribution. The factor of amplification between the left and right images in Figure
4 is about 10’000-100’000 allowing NMR at low field intensities. When doing NMR, we get a spectral
measurement, the difference between the spectra obtained through conventional NMR and NMR in combination with HP 129Xe.
5
This document is the original report written by the student. It wasn’t corrected and may contain inaccuracies and errors.
Figure 4 Spectrum difference between a conventional and Optical pumping NMR [4]
To produce this spectrum, the alignment of the vector B0 and M0 have to be tilted. To change this longitudinal alignment, a rotating magnetic field has to be applied at the Larmor frequency:
ωL= γ ∗ B0[Equation 5]
, where ωL is the Larmor frequency in radian, γ is the gyromagnetic constant of a given nuclei, B0 is
the amplitude of the static magnetic field apply.
The angle of excitation is the angle produces between the vectors in a rotating frame. After the excitation, the vector M0 and B0 returns to their equilibrium longitudinal state.
The excitation’s angle equation: α = γ ∗ τ ∗ B1[Equation 6], where α is the excitation’s angle,
γ is the gyromagnetic moment of the atom to be excited this is also the frequency of the field B1 , τ is the time of excitation, B1 is the amplitude of the sine wave
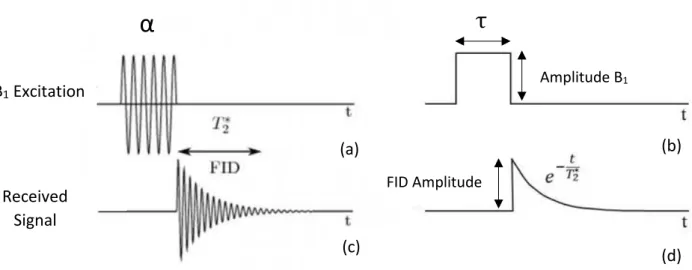
Figure 5 Graph from a sequence of excitation and reception in x-axis the time and in y-axis the amplitude (not to scale) a) the flip angle α with the sinusoidal excitation b) the flip angle envelope c) the FID received signal after the B1 excitation d) the FID envelope[5]
The received signal after the excitation is a free induction decay (FID) which appears on the axis orthogonal to B0 when the total magnetization M0 returns to the alignment with B0.
α
α
τ
α
B
1Excitation
signal
Received
Signal
(a)
si
g
n
al
(b)
si
g
n
al
(c)
si
g
n
al
(d)
sig
na
l
Amplitude B1 FID Amplitude6
This document is the original report written by the student. It wasn’t corrected and may contain inaccuracies and errors.
The equation of the FID is 𝐴𝐹𝐼𝐷(𝑡) = 𝐴0∗ sin(𝜔0𝑡 + 𝜑) ∗ exp (−
𝑡
𝑇2∗) [Equation 7]
, where 𝐴0 is the initial amplitude, 𝜔0 is the resonance frequency of the excited atoms, 𝜑 is the
dephasing angle at the start, 𝑇2∗ is the time taken to retrieve the longitudinal equilibrium. 𝑇2∗ is an
experimental variable which, depends on the inhomogeneities of the magnetic field.
A one-dimensional spectrum will be recovered from the FID precession. To process this signal, a Fourier transformation occurs. It has the propriety to be linear and can differentiate the different frequencies occurring in the FID. The different amplitude can be used to represent chemical shift.
Figure 6 Linearity of the retrieved spectrum for the addition [6]
The shape of the excitation pulse is not inevitably a square in NMR. The better shape for the experiment is undefined and has to be found experimentally. Despite the unknown most suited shape, the shaped pulse chosen is a rectangle. In the electronic implementation, the modulation of amplitude of B0 is considered.
Figure 7 Different Shaped Pulses used in MRI sequences, modulation of B1 amplitude with the samefrequency [7]
There are several sequences to retrieve an FID signal. The easiest one is to excite the atoms at an angle of 90° and then read the signal directly after the excitation. The highest FID amplitude is obtained after an excitation angle α of 90° but when HP gases are used, another formula applied which is related to the return to the thermal equilibrium:
7
This document is the original report written by the student. It wasn’t corrected and may contain inaccuracies and errors.
𝑀(𝑡, α) = M0exp (− t
T1) cos (α
n−1) sin α [Equation 8]
with n the natural non-zero number of time the excitation occurs, T1 the time to return to the thermal equilibrium state in second , t time in second after the last known value of magnetization M(0,0), α angle of excitation in degree, M0 the initial magnetization which is greater than the one at the Boltzmann thermal equilibrium.
With HP gases, the stock of initial magnetization M0 tends to return to the Boltzmann statistical
thermal equilibrium. This implies that α has to be “small” to keep the effect of the hyperpolarization. The 𝑀(𝑡, α) = M0exp (−
t
T1) cos (α
n−1) sin α [Equation 8]is true until the magnetization 𝑀(𝑡, α)is
lesser or equal than the magnetization in Curie’s Law [Equation 2].
The spin-echo is a sequence of magnetization pulse: 90° pulse - 180°rephasing pulse at half time – reading of the spin-Echo after a given time. The spin-echo sequence cannot be used with
hyperpolarized gases because the hyperpolarization is lost after the first 90° pulse.
In MRI and in multidimensional NMR, gradient coils are added to B0. They change the homogeneity of B0 at some point in space and this induces a change in the received spectrum. The sequence produces by the gradient coils and the signal processing to obtain an image are beyond the scope of the thesis. At the end, they retrieve multi-dimensional spectrum. In conventional MRI, the atoms, which are excited, are generally the protons (hydrogens atoms) because they are abundant and have a non-null spin. The Larmor frequency changes depending if the hydrogen is forming water or lipid. Selective excitation frequencies are produced to differentiate the type of tissue. This also occurs with HP 129Xe depending of the surrounding nuclei, its electronic shell can be altered, and its gyromagnetic moment changes. At the end, the frequency of excitation has to be tuned to the Larmor frequency of the sample. This frequency is not well defined.
1.3 Hyperpolarized
129Xe
A review paper explains in detail the advantages of biosensor principle of HP 129Xe NMR [8] Xenon exists at trace levels in the Earth's atmosphere with a concentration of 0.087 ± 0.001 ppm (parts per million) [9] It can be produced by air liquefaction. The price of xenon without isotope separation is CHF 277. - per 11 liters.[10] The abundance of 129Xe among these other isotopes is 26.4% in air.
Xenon is a noble gas. This implies that it has no covalent and ionic chemical interaction with its environment since its electronic configuration is fully occupied. It exchanges his spins with the atoms around him and can create Van der Waals and London bonds. It is therefore ideal for non-intrusive analysis. Xenon is non-toxic for human and is biocompatible. It has an anesthetic effect and is neuroprotective; therefore, it is widely used in a medical setting.
Hyperpolarized 129Xe amplifies the received signals up to 100’000 times. This increase in the signal is due to the fact that Boltzmann's equilibrium is no longer followed. The result obtained is that a container of 129Xe atoms has more spins in the excited state (α) than in the normal state (β). This increases the total magnetization of an isochromat.
129Xe has the particularity of having a dipole moment and therefore a spin ½, so they are in 2 states a high-energy state and another low energy state. Its quadrupole moment is zero. This implies
8
This document is the original report written by the student. It wasn’t corrected and may contain inaccuracies and errors.
that its relaxation is slower and hence the relaxation time T1 is larger. This time T1 in a non-magnetic fluid is between 20 and 120s, whereas in human blood it is about 6-8s for arterial‐oxygenated blood and 3-4s for venous‐deoxygenated blood. [11] for it to be detected by an NMR spectrometer. If multiple sequences have to be made, it is necessary to recycle the “normal” 129Xe and replace it with HP 129Xe. The real time of loss of magnetization (𝑇1∗) has to be experimentally found. This time is limited by the
SNR of the FID at the processing stage and the SNR has also to be determined.
Hyperpolarization techniques are being developed at the Geneva School of Health Sciences. Hyperpolarized 129Xe can be transported from Geneva to Sion in liquid nitrogen-cooled boxes so that it can be used far from the production site. These boxes allow hyperpolarization to be maintained for several days. The HP 129Xe at a few Kelvin box into solid state. The polarization is being lost and tends to return to Boltzmann's equilibrium.
9
This document is the original report written by the student. It wasn’t corrected and may contain inaccuracies and errors.
1.4 Cryptophane cage
Figure 8 On the left a cryptophane cage, on the right a linker which can be attached to the cage [12]
Cryptophane cages are organic supramolecular compounds synthesized for molecular
encapsulation and recognition. In this project, 129Xe is encapsulated in the center. This induces a shift in the measured spectrum, called the chemical shift. This action is caused by the change of the electronic cloud of the 129Xe. Chemical ligands are linked to the cryptophane cage. The final long-term goal of this project is to use specialized ligands, which link, to certain type of bacteria. Depending if the ligands are linked or not, the electronic cloud of the encapsulated 129Xe is modified. A change in electronic cloud induces a change in the chemical shift and in such NMR with HP 129Xe can be used as a biosensor. This effect is shown in the Figure 9.
Figure 9 (a) change of the form of a molecular sensor and of the 129Xe electronic cloud (b) corresponding change in the
chemical shift [12]
“The hyperpolarization of xenon makes possible the observation of low concentrations biosensors. This enables to detect submicromocular concentrations by judicious signal acquisition[…] When the concentration of biosensor is lower compared to dissolved xenon, the dissolved xenon can act as a polarization reservoir if just magnetization from the caged xenon is excited (done with judiciously chosen selective pulses since the resonances are well separated). With a delay of 100 ms second between excitation pulses there is essentially full recovery of the caged xenon and many acquisitions can be done before the pool of hyperpolarized xenon is depleted and must be refreshed. This rapid, direct excitation approach allows detection down to the hundreds of nanomolar
concentration range with natural abundance xenon and a polarization of a few percent. (129Xe enrichment and higher polarization could yield an ≈ 40-fold lower detection limit) …” [13]
10
This document is the original report written by the student. It wasn’t corrected and may contain inaccuracies and errors.
The above citation explains the HyperCest technique. In our project, this technique can be used to keep the SNR of the FID signal relatively constant after each excitation. The only difference needed to use this technique is to inject more HP 129Xe in the blood. When the blood is saturated with “depolarized” 129Xe, these techniques does not work anymore. A way has to be found to replace the saturated “depolarized” 129Xe in the blood with new HP 129Xe. A possibility would be to wait until the concentration of 29Xe inside the sample diminishes due to “diffusion” in the surrounding air. The time of diffusion has to be defined with its variables.
This technique of relaxation is needed for time analysis and this is beyond the scope of this thesis. This technique is essential and need to be implemented in commercially available NMR spectrometer to enable the possibility to use HP 129Xe inside blood. This is beyond the scope of this thesis.
11
This document is the original report written by the student. It wasn’t corrected and may contain inaccuracies and errors.
2. Existing NMR device
2.1 Low-field NMR spectrometer
Currently, there is no commercial spectrometer available for NMR at LF and MF frequencies, which are using HP 129Xe. There exist experimental and educational devices, which are made to handle NMR at LF (cf. 13.1Terranova-MRI, Earths field MRI & NMR teaching ).
There exists an NMR spectrometer, which was conceived entirely for low frequency (30–300 kHz). Each of the electronics components are explained. However, it uses a dedicated function generator and acquisition signal cards from LabVIEW™. It is program to excite either xenon or hydrogen. It uses a single coil for measuring and producing B1. A sample of the technical
implementation is given in this section. (13.3 Low-Field NMR/MRI Systems Using LabVIEW™ and Advanced Data-Acquisition Techniques).
To implement a commercial product, it is needed to be affordable and small. In the developed main source project, the computer needs a LabVIEW™ paid license. Moreover, to run the program, a LabVIEW™ license and a supported OS are needed. In the case of a commercial product, this option is rejected but National Instrument IC can always be used without LabVIEW™. For further development, this project needs to work with open source software and a conceived electronic board to handle all the functions of an NMR.
An open source Earth's Field NMR Spectrometer is existent, has open hardware firmware and software, and is available on GitHub. [https://github.com/geekysuavo/pyppm]
The main drawback of this earth’s field spectrometer is the magnetic interferences with its surrounding. Since it does not use magnetic shielding at LF. The LF need more material to be stopped than MF and HF.
In the first version, no attention where taken to handle electronic issues (separated mass-planes). Only one mass plane for digital, analog and power supply were designed. This resulted in unwanted magnetic field interactions induced by the not well-designed mass planes which acted as an antenna receiving unwanted external electromagnetic waves and producing also unwanted electromagnetic waves. In every stages of the design, this outside and inner noise disturbed the electronic parts of the spectrometer and especially the LNA.
This project has been improved with a version 2 which separated the mass planes and the project is still active at the time of this thesis.
12
This document is the original report written by the student. It wasn’t corrected and may contain inaccuracies and errors.
2.2 Existing standalone portable NMR spectrometer HF
There are other NMR proprietary devices all-in-one spectrometer which are portable using magnetic field B0 between 0.4 T and 2T. However, they are not suited for HP gases and needs software or/and hardware modification for 129Xe (13.4 The mq-ProFiler/13.6 picoSpin™ 80 Series II NMR
Spectrometer).
The NMReady-60 Pro from Nanalysis (13.7 NMReady-60PRO) is an NMR spectrometer using a magnetic field of 1.4 T already suited for 129Xe. Some laboratory has already conducted some experiments by using this device with HP 129Xe. [ 14][15][16]
A quote has been requested. The price of the device is 65’000 $. For academic usage, a reduction of 10’000 dollars is made. The device has two channels; the second channel can be configured for a different chemical compound. They also have an automatic injection technique, which is existent but does need software adjustment to insert the HP 129Xe blood inside the blood before testing. This adaptation of the automation injection process introduces extra unknown costs.
13
This document is the original report written by the student. It wasn’t corrected and may contain inaccuracies and errors.
2.3 Existing Small devices
2.3.1 Small Hyperpolarizer
There exists small hyperpolarizer to produce the HP 129Xe before the admission. This is an optimized microfabricated platform for the optical generation and detection of HP 129Xe. This
hyperpolarizer enables the possibility to have a compact and affordable polarizer. With the drawback, that it provides a signal enhancement by a factor of only 5300 ± 200. [17]
2.3.2 Multipurpose IC
IC RFID transponders are small CMOS devices, which are producing an oscillating magnetic field for communication purposes. They are not effectively adapted for NMR and cannot be configured for this purpose. Although, dedicated ICs for NMR measurement are already existent with digital logic, analogic component and even an embedded microstrip antenna. [18] The only functions, which is not handle by this type of IC, are the signal processing and the field B0 production. However, no
commercially available IC where found. The main reasons why the antenna is inside the IC is to diminish thermal noise, signal distortion and cable attenuation issues also the antenna can be
manufactured with more accuracy. This single device enables the possibility to connect only the power supply and a fast-synchronous communication protocol to transmit excitation sequences and to receive the digitalize FID data.
For MF frequency, the antenna is too large to be contained inside a single chip. This implies, the chip needs an external antenna which can be directly connected on top or on bottom of an IC.
2.4 Open source NMR
Open source NMR are existent. (Cf. 13.5 Opencore NMR) It is not designed to be suited for low magnetic field. It is working with a FPGA and RF electronic components. The total cost of a homemade NMR console is approximately 5’000 $ only for the hardware part. The electronics hardware can be modified to use lower frequencies. The software can also be modified accordingly.
14
This document is the original report written by the student. It wasn’t corrected and may contain inaccuracies and errors.
3. Schematic diagram
The implemented device works according to the following principle diagram:
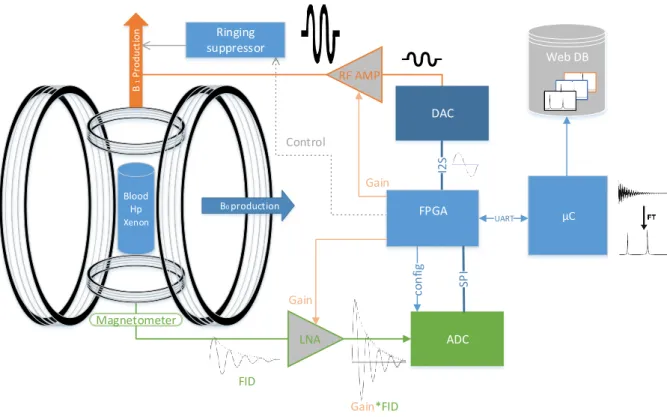
Web DB I2 S Blood Hp Xenon B0 production B 1 P ro d u ct io n LNA ADC DAC FID Gain*FID Magnetometer Ringing suppressor Control FPGA μC UART RF AMP Gain co n fig Gain
Figure 10 Schematic diagram NMR made with Visio
All the components are described in further details in the chapter implementation options. To understand this schematic diagram, a sequence diagram is more suited which is shown in Figure 46 and Figure 47. At first, the user has to configure the μC. Then, the other elements of the diagram have to be powered on and stabilize (e.g. B0 has to be present and homogenous). At this time, the user can start a sequence on the μC. The μC send a start sequence to the IC and wait on the ADC. The IC tells the injector of the sample (not viewed on schematic diagram and not implemented) to add blood into the chamber, the HP 129Xe and the sample are placed inside the dispositive.
During an acquisition sequence, the IC produces a digital signal of excitation, which is being converted by a DAC and amplified by a RF amplifier. This analogue power signal is sent to the B1 magnetic producer. At the end of the excitation, a ringing suppressor is activated to suppress the energy stored in the magnetic generator (i.e. counteract the ringing). After this suppression ringing delay, an FID signal from the HP 129Xe is retrieved in a magnetometer and amplified by an LNA (low noise amplifier). After this stage, the amplified signal is transformed by the ADC. This transformed signal is sent to μC since the device power on but the μC does not store the data. When the IC interrupts the μC, the μC starts saving data until the end of the interruption.
This acquisition sequence can be configured to be repeated many times. At the end of the sequences, the μC can start processing the received signal to produce the spectrum of the averaged FID by using Fourier’s transformation.
15
This document is the original report written by the student. It wasn’t corrected and may contain inaccuracies and errors.
The first choice made in this implementation is to use a digital reconfigurable IC and not an analogic circuit due to simplicity reasons and easier reconfigurability. The signal processing takes place on a microcontroller, which can process the signal with no time constraint.
In fact, the assembly DAC, ADC, IC and μC can be seen has an arbitrary function generator and a spectrometer for small signals such devices are existent but where not available in the college at the time of this thesis. ( 7.1.2 Red Pitaya STEMlab (FPGA+ μC))
4. Risk analysis
4.1 SNR
From the schematic diagram, the main risk is to receive no signal and to retrieve only noise. To solve this risk, the SNR has to be improved in the electronic and physical components. The noise depends from many factors. In the case of the measurement of an electromagnetic force, the most relevant factor is the measurement is the temperature, which produces thermal noise. The equation of this noise is given
Noise = √4𝑘𝐵(𝑅𝑐𝑇𝑐+ (𝑅𝑚+ 𝑅𝑒𝑙)𝑇𝑒) △ 𝑓[Equation 9], △ 𝑓: the bandwidth of excitation in
radian, 𝑘𝐵: Boltzmann constant, 𝑅𝑚: magnetic impedance between the sample and the coil’s
surrounding, the loss produces Eddy’s currents, 𝑅𝑒𝑙: is the electric coupling seen from the coil with the
sample 𝑇𝑒: the temperature of the sample, 𝑇𝑐: the temperature of the coil and 𝑅𝑐 : the resistance of
the coil at the frequency of excitation
Cooling system has to be added to the device in the critical regions where the temperature adds too much thermal noise. Narrowing the bandwidth introduces also smaller noise. Introduction of an electrical shielding diminishes 𝑅𝑒𝑙, placement of the susceptibility magnetic far from the source is
introducing less Eddy’s current loss from the source. 𝑅𝑚: gets also bigger at higher frequencies.
𝑆𝑚= 𝜔0( 𝐵1
𝐼) 𝑀√
50
𝑅𝑐[Equation 10], 𝜔0 the Larmor frequency, M the magnetic intensity, 𝐵1
𝐼 is
the field generating efficiency of 𝐵1, M the magnetization inside the coil, 𝑅𝑐 : the resistance of the coil
at the frequency of excitation
The amplitude of signal after the matching of the capacitors 𝑆𝑚 is related to the frequency of
excitation that implies, the frequency 𝜔0must be maximized. The size of the sample and HP 129Xe
enhanced the magnetization 𝑀. The resistance of the coil must be diminished. √50𝑅
𝑐 are the losses due to the 50 Ω impedance adaptation of the transmission cables.
From the Equation 9 and Equation 10, the following equation can be deduced to know how much signal is produced depending of the excitation angle α and the time when M0 where measured:
𝑆𝑁𝑅(𝑡, α, n) = ∑ [M0exp(− (n−it ) T1 ) cos(α i−1) sin α∗𝜔 0(𝐵1𝐼)√50𝑅𝑐] n i=0 √𝑛∗4𝑘𝐵(𝑅𝑐𝑇𝑐+(𝑅𝑚+𝑅𝑒𝑙)𝑇𝑒)△𝑓 [Equation 11]
16
This document is the original report written by the student. It wasn’t corrected and may contain inaccuracies and errors.
The FID signals are summed together while the noise is multiplied by a factor √𝑛. For simplification purposes, it is assumed that the noise is not time dependent. This produces an enhancement of the SNR by the number of repetitions.
Notice that, the range where this equation is true has to be defined but the magnetization has to be bigger than Curie’s law At the thermal equilibrium and when |γ|ħB0≪ kBT, the total
magnetization follows Curie’s Law: M0 ≈ N γ2ħ2B0
4kBT [Equation 2]. It assumed that the change in magnetization is linear and the magnetic fields B0 and B1 are homogenous and in quadrature. In addition, the time between the repetitions is constant and has to be greater than the time of relaxation. The number of repetition n has also to be experimentally selected so that
ℌ ∗ 𝑆𝑁𝑅(𝑡, α, n + 1) > 𝑆𝑁𝑅(𝑡, α, n), where ℌ > 1 is the experimental factor which has to be found by experimentation during the phase of signal processing. To find this factor, it is needed to find if the final spectrum stored on the Database has less noise than the calculated spectrum with one less excitation.
4.1.1 Impedance matching
The cables between the signal board and the coil can play a huge role on the amplitude of the received signal. In one direction, they have to transmit power-oscillating signal with a given
frequency without introducing THD. In the other direction, they have to receive a small FID signal without attenuation and added THD. Since the two directions do not act the same, they do not need the same transmission cable characteristics.
In general, when coax cables are used to transmit power-oscillating signals, the input and output impedances must be matched at 50
Ω
. This is a compromise between the maximal power supported in a cable and the power reflected (VSWR) which introduces THD. Notice that, the power transmitted to the B1 producer is not the total power used to generate B1. There are additional thermal power losses in the field generating efficiency 𝐵𝐼1, which are linked to Joule losses. They induce thermal noise.In fact, to minimize the coax attenuation on the received small FID signal, the optimal line resistance is 77
Ω
. In the TV domain, RG6 CATV cables with a line resistance of 75Ω
are usually used. These cables can be used to connect the LNA and the magnetometer. In addition, the length of the cable has to be minimized to reduce the attenuation and the connector at the magnetometer side of needs to use nonmagnetic materials to not disturb the magnetic field produced and received by the magnetometer. The impedance matching and tuning circuit on the side of the B1 producer needs nonmagnetic components to be immune from magnetic field production and to not productunwanted magnetic field. On the side of the LNA, magnetic precautions are not necessary if the LNA is sufficiently far from the magnetic field producer B1; however, an impedance matching circuit is needed to receive more power.
In the case of transmission of RF power signal (without DC),
the maximal power
transmitted in (dBm) inside a coax cable is encountered for a line impedance value of 30 Ω.
While, the minimal attenuation is at 77 Ω. A compromise must be found, and it is 50 Ω.
Since the power transmitted by the excitation signal is greater, a 50 Ω resistance is more
suited for this case.
At LF, the impedance matching has a lower importance. In fact, the length of the wave measures more than 1 km, which is bigger than the line of transmission. Another condition needs to
17
This document is the original report written by the student. It wasn’t corrected and may contain inaccuracies and errors.
be respected for frequency lower than hundred kilohertz. This is the Heaviside condition, which states that if the line is designed such that R/L=G/C the line becomes absolutely distortion less [19,p65]
However, the input impedance of the receiving equipment must still be higher and
preferably, in a ratio of at least 1/5 with the output impedance. This technique is currently used by RF amplifier in the audible frequency.
The formula, which gives the impedance of a coax cable, is the following: Zc= 1 2π√ μ0μr ε0εresln ( de di) [Equation 12], where Zc: characteristic impedance
ε0 : vacuum permittivity: 8.85416 * 10-12 environ
εres : relative permittivity: 1 for vacuum, slightly more for air and air-insulated coaxial cables
μ0 : vacuum permeability: 4π*10-7 = 1.256*10-6, μ𝑟: relative permeability: 1 for all
non-magnetic materials (other than iron, nickel, cobalt, etc.) de: outer diameter
di: inner diameter
The attenuation of a coax is minimal for a diameter ratio of 𝑑𝑑𝑒
𝑖 = 3.59. In this case, and by substituting in the formula for impedance, we find a characteristic impedance of 77 Ω.
The diameter ratio that allows the most power to pass through a coax without risk of breakdown is 𝑑𝑒
𝑑𝑖 = 1.65. Which is approximately 30 Ω
[20]
4.2 Field homogeneity/External perturbation
Figure 11 FID with shimming coil (left) without shimming coil (right). [21]
The second major risk is the inhomogeneity of the field B0. It can change the shape of the received FID signal (i.e. the chemical shift), because the Larmor frequency in each region in space of the isochromat will be different. Each isochromat will have a different Larmor frequency. The
18
This document is the original report written by the student. It wasn’t corrected and may contain inaccuracies and errors.
retrieved spectrum will be flattened. The field homogeneity ∆𝐵𝐵 is the difference of the maximal difference divided by the mean of the field in a given space and direction.
The geometrical angle between B0 and B1 has to be 90 degree to reduce the perturbation between the fields.
In addition, the excitation signal, which produces B1, has to avoid distortion and glitches in the production of the exciting sine wave. VSWR of B1 producer has to be optimal. To this purpose, the impedances must be matched accordingly. The production of the rotating field B1 has to be produced with the less current as possible to optimized 𝐵𝐼1 . With this diminution of current, the thermal noise due to Joule losses is reduced.
External disturbances in the magnetic field cause inhomogeneities in the HP 129Xe. If they are not aligned with the vector of HP 129Xe polarization and if they are at the resonant frequency of the HP 129Xe, they diminish its T1 and its polarization. Magnetic shield can prevent these EM
perturbations. In addition, external EM waves can produce undesired frequencies in the received spectrum; all the electronic devices have to be shield against the external perturbations to suppress these undesired signals.
4.3 Electronic device
Electronic devices are also prone to external noise disturbances. They need to be shielded accordingly.
For electronic devices, the generation of the excitation pulse has to avoid distortion and glitches. The function generator needs a good resolution and a good clock stability.
The DAC has to convert the signal with the less noise and time drift as possible. The power amplifier has to amplify the signal without adding harmonics and distortion
The power amplifier has also to be optimized after the generation of the first signal. In
addition, a dedicated IC is needed inside the power amplifier to avoid glitches in the excitation signal. Multi-processor micro controller (𝜇𝐶) with OS are prone to glitches in the production of time sensitive signals. The time taken by each instruction in a 𝜇𝐶 is not always the same. They are
dependent from the pipelined used of instruction by jump prediction etc. Therefore, a dedicated IC is needed with synchronization and hard real-time.
In fact, the thermal noise is preeminent and puts the limit of the reception. The components have to be fewer thermal sensitive as possible, to prevent thermal noise. It can also be needed to cool certain parts of the electronic circuit.
The interaction between the HP 129Xe and the blood diminishes the HP 129Xe polarization. The physic and chemistry of this interaction are hard to analyze and are not treated in this thesis, but they give critical times and diminish the T2* time of the FID signal. Also, a magnetic schema of the HP 129Xe and its container will be needed to determine its magnetic susceptibility and one of the
19
This document is the original report written by the student. It wasn’t corrected and may contain inaccuracies and errors.
4.3.1 Quantization noise
The quantization noise depends of the number of samples per second and the resolution. The resolution can be seen on the y-axis and the sample par second in the x-axis. This effect is unwanted especially for low amplitude receive signal. For this purpose, the more resolution has an ADC the less noise will be produced.
Figure 12 Quantification noise (vintage-audio-laser.com)
On the right, the quantification noise is represented and added to the received digital signal to produce the digital quantized signal.
20
This document is the original report written by the student. It wasn’t corrected and may contain inaccuracies and errors.
5. Specifications and sizing
5.1 Physical and chemical specifications
It was stated that a chemical shift of at least 50 ppm (parts per million) should be detectable for chemistry purpose. A chemical displacement of 50 ppm corresponds for a Larmor frequency of 50 kHz to detect a frequency variation of 2.5 Hz. This corresponds to differentiating a frequency of 50'002.5 Hz from one of 50 kHz in the retrieved spectrum without overlap. This gives us directly the sensitivity of detection in 𝑝𝑝𝑚
√𝐻𝑧. A spectrometer has to be found and/or made for such sensitivity. It was decided
to make a device working at low magnetic field but stronger than the earth’s magnetic field.
The only parameters given to design the electronic spectrometer were: “the T2* which is equal to roughly 5-10 [ms] and the angle of excitation is 2°. They depend on the temperature (thermal
agitation), the magnetic field strength and gradient, the size of the sample, the partial pressure of the xenon in the mixture and the magnetic susceptibility of the container (glass or plastic). Also, the signal depends on both magnetization (i. e. hyperpolarization rate and relaxation, intensity and homogeneity of B1, in short physics) and electronics (Q of the antenna, noise of the preamplifier etc...)”. Dr. Jean-Noël Hyacinthe gave these parameters and the explanations. The physical part was not treated and only the electronic perturbations are treated. When the NMR spectrometer is functional, it will enable the possibility to test the HP 129Xe with all the interactions between the physical parameters.
B0 > Earth’s magnetic field ≈ 50μT
Security Factor = 80 𝐵0min = 50μT ∗ 80 = 4mT fB1min = γXe 2π ∗ AB0min = 74.521∗106[rad/T] 2π *AB0min = 47’108 [Hz] 𝐵1= α γXe∗τ , α ≈ 0.035 𝑟𝑎𝑑𝑖𝑎𝑛, γXe =73.997∗ 10 6[Hz/T]
τ : = excitation time (to be the smallest as possible and τ <T2*) τ ∗ 𝐵1 =
α γXe
= 0.035
73.997∗ 106= 4.73 ∗ 10−6[𝑠 ∗ 𝑇]
This implies that 𝐵1 for a time of excitation of 1 millisecond is equal to 4.73 ∗ 10−3[T].
The intensity of 𝐵1 and the time of excitation τ are independent from B0
When using such low frequencies, it is not possible to use the same components as in high frequency. The length of the line needed to make 𝜆4 or rat-race circuits are too long. The component will be prompt to EMI and large signal attenuation. Components working at small frequency are needed to be implemented.
In the existing NMR spectrometer at the Geneva School of Health Sciences, they are using a transmission reception probehead (solenoid with litz-wire) with a frequency of approximately 50 kHz same frequency and their main problem is during the shutdown of B1.
At that moment, they need to measure the received signal, the magnetic power stored in the coil has also to vanish. This stored power is reemitted at the frequency of resonance of the coil, which is approximately the same as the excitation pulse. A solution has to be found to fight against this ringing issue.
21
This document is the original report written by the student. It wasn’t corrected and may contain inaccuracies and errors.
A solution to this issue is to use a quality factor damper to transform the quality factor Q within a given time and retrieve a signal after the dissipation of the energy. The stored energy in the coil will be faster dissipated. With is solution, more signal can be retrieved from the FID without noise.
Another solution is to use two different coils one for transmission and one for reception. They need to be in quadrature to avoid mutual inductance effect. A geometry can be found to solve this issue.
In fact, by the end of the project, it was discovered that the field B0 intensity does not require to
be low. It was thought at the beginning of the project that if the magnetic field B0 is not aligned with the polarization of the HP 129Xe during the injection phase, too much polarization would be lost. This can be compared as a small angle of excitation from the Equation 6 where B0 is the field of excitation and 𝜏 is an infinitesimal short time of excitation, which is unknown. This phenomenon can be found experimentally by measuring the loss of polarization at the injection of the Xe129 process. In fact, there is a magnetic gradient before coming to the center of the magnetic field producer B0. This gradient diminishes the total polarization of the HP 129Xe.
The intensity of this effect is existent but considered to be not preeminent. In fact, in an NMR spectrometer, the higher the B0, the more signal can be retrieved without being affected by external noises.
5.2 Magnetic specifications
In the specification, it was also stated that the device could use PCR experimental plates with few holes. In fact, each sample needs its own B1 producer and B1 magnetometer. Moreover, each of this component needs its own coaxial cable and its own alimentation supply. That is why, in a first phase, PCR plates with only 8 holes (2x4) are considered. The design of the B0 producer has to take this geometrical aspect into consideration.
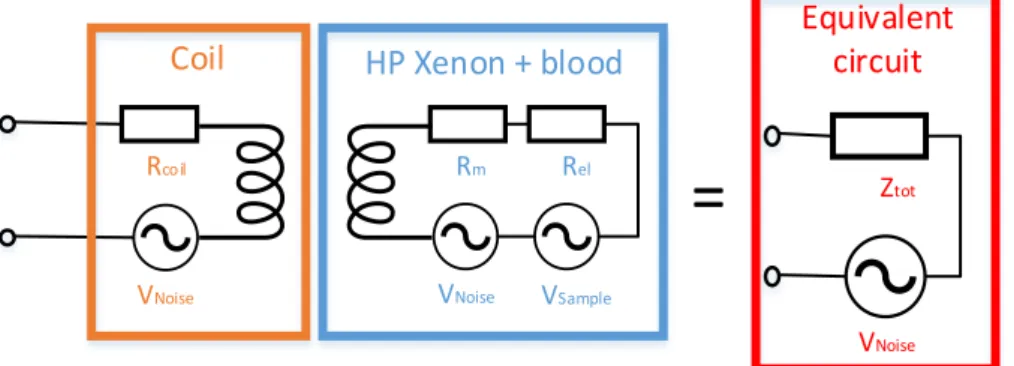
An equivalent electric circuit can be made from the HP 129Xe and blood; with its noise, its
characteristic impedance and a simulated FID signal. The magnetometer can be coupled with an ideal transformer to the sample. The magnetometer has also an equivalent impedance and noise. This gives us an equivalent circuit with an oscillating voltage and an equivalent impedance. However, the
simulation needs given parameters for each of the components. The different noises and the FID are not constant. In addition, the FID diminishes with the 𝑇1∗ of the HP 129Xe. This implies that the LNA
needs to be modulated in amplitude between each excitation to use all its amplitude range without saturating. VNoise Rm Rel VSample Rcoil VNoise
HP Xenon + blood
Coil
Ztot VNoiseEquivalent
circuit
=
22
This document is the original report written by the student. It wasn’t corrected and may contain inaccuracies and errors.
23
This document is the original report written by the student. It wasn’t corrected and may contain inaccuracies and errors.
The equivalent magnetic circuit of the HP 129Xe in blood should be also simulated. For this specification to be aimable, a magnetic simulation environment with finite element should be developed with the physical equation related to hyperpolarized gases. This is not in the scope of this thesis.
5.3 Electronic specification
The signal generator needs a small clock jitter to not distort the signal at the production. This timing is unknown, but it needs a true real time producer to be insignificant in the toolchain. That is why a dedicated IC has to be designed to produce the sinusoidal signal and control the other parts of the circuit. The received signal has also to be synchronized to not add additional jitter.
The AC power amplifier after the signal generator needs to stop exciting the B1 producer at a known time. Furthermore, the MF power amplifier needs to be switched off without producing additional ringing on the magnetic coil receiver. At its outside stage, it needs a matching electronic circuit.
The LNA has to be protected against too high input signal and has to be tunable in amplitude. It needs this functionality because each FID signal has a different amplitude, which is decreasing due to the diminishment in polarization after each excitation. This phenomenon is depicted in [Equation 11] The time to change the amplitude range of the LNA is larger than T2∗. (5-10 ms). This implies that a
DC/DC converter controlled by an IC has to be realized to adjust the gain of the LNA during this short period of time.
The most crucial part in the electronic component are the LNA and AC power amplifier. The non-linearity of the components inside the power amplifier are diminishing their output voltage. It is mandatory to control their temperature and to have passive and active component adapted to the task.
chapter, the different implementation options of the schematic diagram are explained.
5.4 Field B
0production
The intensity of the magnetic field B0 produces the magnetization of the sample by aligning the magnetic moments of the spin. This gives also the Larmor frequency at which the sample will be excited. ωL = γ∗ B0[Equation 5]
Field B0 must be as stable and homogeneous as possible. It is possible to produce this field with the help of a permanent magnet or an electromagnet. The field B0 stability can be influenced by thermal changes and gradient in temperature, by the stability of the current supply, by external field perturbations and by the magnetic susceptibility of the atoms inside the produced magnetic field. To monitor the stability of a magnetic field, this parameter has to be measure or optimized.
In the following section, the specifications of different magnets are compared. The shielding of the magnetic producer has also to be taken into account, to stop the external perturbations.
The picked choice is explained at the end of this chapter.
5.4.1 Superconductor magnet
In classical IRM, superconductor magnets are used. They need to be cooled to a temperature near the absolute zero to amplify the produce magnetic field. The cooling system needs liquid nitrogen and/or helium near the absolute zero to operate. The whole system is inside a dewar and
24
This document is the original report written by the student. It wasn’t corrected and may contain inaccuracies and errors.
takes a lot of space. In the meantime, the whole superconductor magnet has to be magnetically shielded to avoid undesired magnetic interaction. Shimming coils are also needed to homogenize the magnetic field. This solution is costly and hard to miniaturize.
5.4.2 Permanent magnet
Permanent magnets exist in different materials, shapes, and geometries. The field produces at the center is high. The main problem of permanent magnet is their poor temperature stability.
Temperature control and thermic insulation are required to keep the field stability. Also, if the temperature become too high, a demagnetization occurs at the Currie temperature. This implies that the magnet needs a sufficiently high Curie temperature and a high coercivity to keep its magnetic domains in the same direction. These hard magnet characteristics can be found inside Neodymium magnets (Nd2Fe14B) which are usually the more affordable hard magnet (i.e. magnet with high coercivity) with a high remanence (i.e. strength of a magnetic field measure in Tesla). They are also generally used in existing benchtop NMR spectrometers. Their principal characteristics are their high coercivity and their relative low-cost compare to other magnets.
25
This document is the original report written by the student. It wasn’t corrected and may contain inaccuracies and errors.
5.4.3 Iron discs and ferrite magnet
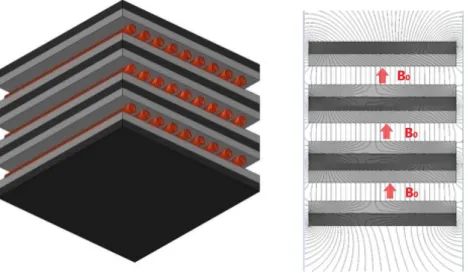
Figure 14 Sketch of our NMR magnet system. The black part is a magnet base on which the ferrite magnets and iron discs are set with their magnetic attractive forces. The coil unit contains the magnetometer and the field B1 producer. [22]
A pair of two commercial ferrite magnets with iron discs was developed. The total cost of material and machining is about $400 with a field of about 85 mT and a 90 Hz frequency resolution in spectra at about 2.4 MHz Larmor frequency. The resolution in ppm of the magnet is equal to 2.4 MHz /90 Hz =37.5 ppm [22]
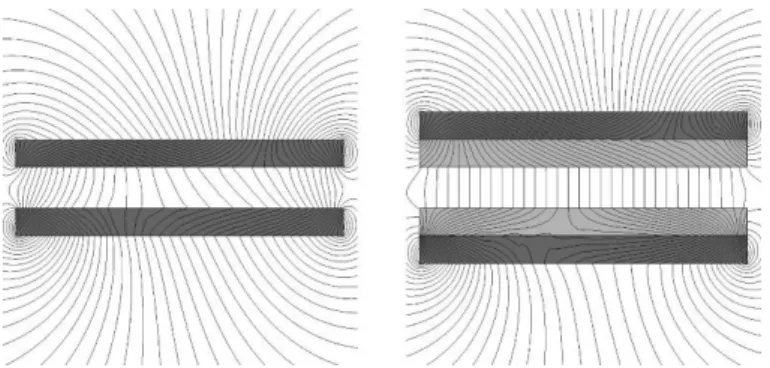
Figure 15Iron disks can homogenize a field. Sketches of flux lines with (the right panel) and without (the left panel) iron discs (gray discs) are shown. These are simulations calculated with FEMM [22]
The field homogeneity can satisfy the requirement by the addition of the iron disks. With this kind of setup, it is not possible to insert standard PCR plates. Only one test tube can be tested at the time. The resolution of 37.5 ppm is inside our specification. This geometry and materials have to be tested with smaller magnets and multiple magnets to be used with PCR standard plates.
26
This document is the original report written by the student. It wasn’t corrected and may contain inaccuracies and errors.
Figure 16 arrangement of ferrite magnets in black with multiple iron plate in grey, the test tubes containing the HP 129Xe and
the magnetometers and B1 producer are represented in orange
This arrangement has to be tested first with test tubes and afterwards with PCR plate. The cost and the homogeneity of the field with multiple plate as to be found but it has to be approximately the same than the research paper above.
![Figure 1 : Physical characteristics of some usual nucleus used in NMR [2, p4]](https://thumb-eu.123doks.com/thumbv2/123doknet/14335885.498633/11.892.155.378.293.569/figure-physical-characteristics-usual-nucleus-used-nmr-p.webp)
![Figure 8 On the left a cryptophane cage, on the right a linker which can be attached to the cage [12]](https://thumb-eu.123doks.com/thumbv2/123doknet/14335885.498633/17.892.109.522.582.852/figure-left-cryptophane-cage-right-linker-attached-cage.webp)
![Figure 23 Typical area of applications of the main magnetic field sensors [29]](https://thumb-eu.123doks.com/thumbv2/123doknet/14335885.498633/45.892.140.614.113.358/figure-typical-area-applications-main-magnetic-field-sensors.webp)
![Figure 28 Schematic diagram of an AC amplifier [33]](https://thumb-eu.123doks.com/thumbv2/123doknet/14335885.498633/49.892.130.553.245.730/figure-schematic-diagram-ac-amplifier.webp)
