Publisher’s version / Version de l'éditeur:
Vous avez des questions? Nous pouvons vous aider. Pour communiquer directement avec un auteur, consultez la première page de la revue dans laquelle son article a été publié afin de trouver ses coordonnées. Si vous n’arrivez pas à les repérer, communiquez avec nous à [email protected].
Questions? Contact the NRC Publications Archive team at
[email protected]. If you wish to email the authors directly, please see the first page of the publication for their contact information.
https://publications-cnrc.canada.ca/fra/droits
L’accès à ce site Web et l’utilisation de son contenu sont assujettis aux conditions présentées dans le site
LISEZ CES CONDITIONS ATTENTIVEMENT AVANT D’UTILISER CE SITE WEB.
Lighting Research and Technology, 15, 2, pp. 77-82, 1983
READ THESE TERMS AND CONDITIONS CAREFULLY BEFORE USING THIS WEBSITE. https://nrc-publications.canada.ca/eng/copyright
NRC Publications Archive Record / Notice des Archives des publications du CNRC :
https://nrc-publications.canada.ca/eng/view/object/?id=516e7d8e-1ee8-45c9-98a5-dbdb3438e192 https://publications-cnrc.canada.ca/fra/voir/objet/?id=516e7d8e-1ee8-45c9-98a5-dbdb3438e192
NRC Publications Archive
Archives des publications du CNRC
This publication could be one of several versions: author’s original, accepted manuscript or the publisher’s version. / La version de cette publication peut être l’une des suivantes : la version prépublication de l’auteur, la version acceptée du manuscrit ou la version de l’éditeur.
Access and use of this website and the material on it are subject to the Terms and Conditions set forth at
Lighting energy conservation: simple analytic methods with time-lapse
photography
Ser I
Tin N2ld
I
National
Research
Conseil national'obo1:28
I
+
Council Canadade recherches
CanadaBLDG
--- I
LIGHTING ENERGY CONSERVATION: SIMPLE ANALYTIC METHODS WITH TIME-LAPSE PHOTOGRAPHY
by M.S. Rea and R.R. Jaekel
ANALYZED
Reprinted from
Lighting Research & Technology Vol. 15, No. 2, 1983
p. 77
-
82UBR Paper No. 1128
Division of Building Research
Bien que la photographie en pause permette d'obtenir des renseignements sur la consommation d'bnergie pour l'bclairage, cette technique n'a pas bts t r k dsveloppk car la quantit'e et les dstails des r'esultats nscessitent une longue analyse. Deux msthodes analytiques simples sont dEcrites pour interpr'eter la photographie en pause de fason pratique:
1)
une mbthode pour obtenir des dchantillons et rgduire le nombre des donn'ees, et 2) une formule pour calculer les pertes d'bnergie pour l'bclairage basks sur l'occupation des bgtiments et l'utilisation. de l'bclairage. GrbceB
ces deux mbthodes, on peut se rendre compte du gaspillage d'bnergie pour lf6clairage.Summary Although time-lapse photography offers great potential for providing information on lighting energy conservation, it has been undeveloped because the quantity and detail of the data demand a great deal of time for analysis. Two simple analytic procedures are described to make time-lapse photography more useful: (1) a sampling procedure for data reduction, and (2) a formula for computing wasted lighting energy based upon occupancy and light usage. I t is argued that poor utilisation of lighting energy can be addressed with these procedures.
Lighting energy conservation: simple analytic methods
with time-lapse photography
M. S. REA and R. R. JAEKEL
1 Introduction
Lighting energy conservation work a t the Division of Building Research, National Research Council Canada, is concerned with reduction of waste. In fact, conservation can be defined as continual utilisation of energy without waste. Emphasis has therefore been placed on the need to co-ordinate on- off cycles of lighting with presence-absence cycles of building occupancy1-
'.
Time-lapse photography has already been used for assessing both lighting usage and o c c ~ p a n c y ~ - ~ , but in the early studies the intention was (1) to examine the reliability and acceptability of cameras, and (2)
to provide raw data on use of lights in various types of buildings. Time-lapse photography is capable of providing additional information about light usage. Not only can a large number of frames be gathered easily (typically 7,200 frames per month), but each frame can also be used for careful analysis of occupancy and activity patterns. The richness of the data has, however, presented some difficulty for analysis: both quantity and detail of data have demanded a great deal of time.
Consequently, it has been desirable to develop faster methods of examining time-lapse photographs without sacrificing the main
advantage of the technique- the ability to examine occupancy patterns and lighting simultaneously. This paper presents simple, meaningful methods of analysing time-lapse photographs so that users will have a rapid means of attacking waste of lighting energy.
The authors are with theEnergy and Services Section, Division of Building Research, National Research Council, Ottawa, Canada.
The paper was first received on 7 May 1982 and in revised version on 8 February 1983.
2 Procedure
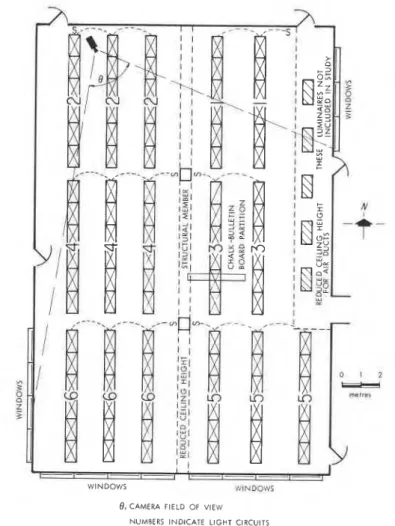
A schematic view of a monitored, large open-plan classroom* is shown in Fig. 1. Six light circuits, each with one switch, control artificial lighting. Windows on the south, west, and east walls provide natural illumination. The classroom is divided into four activity areas.
A Sankyo E S 44XL super 8 camera with a wide- angle lens was mounted just below the ceiling in the north-west corner of the classroom to monitor artificial lighting. Although not all luminaires were within view of the camera (Figs. 1 and 2), each light circuit could be monitored. Similarly, occupancy could be evaluated relatively unambiguously in most circuit areas because activities in the classroom areas usually included several people. Nevertheless, because the camera afforded neither a complete nor an unobstructed view of all areas. some occupants were probably missed.
A custom controller powered by a 6 V lantern battery initiated single-frame exposures approximately every six mins. Real time for exposures was documented by an analogue watch suspended in front of the camera (Fig. 2). Fifty-four teaching days were monitored from 23 October 1978 to 6 March 1979.
3 Results
Lighting use between 7:00 and 21:OO h was examined for each circuit area. Every exposure obtained between integer hours was counted (i.e., all those between 07:OO and 08:00, 08:OO and 09:00, and so on), and the proportion of all frames showing light usage within a circuit area calculated. The data are shown in Figs. 3 to 8; Fig. 9 gives comparable data for all circuit areas combined. *Robert Hopkins Elementary School. Carleton Board of Education, Ottawa, Canada.
b
-
,
,
I , -- WINDOWS :llNCJO'::i6, CAMERA FIELD OF VIEW NUMBERS INDICATE LIGHT CIRCUITS
Fig. 1. Layout of open-concept classroom.
Random samples of frames within core hours (08:OO to 18:OO h) were also selected: one frame for each core hour of each teaching day. This reduced the number of frames examined during core hours by 9110. The proportion of sampled frames showing light usage within a circuit area was calculated for every core hour. These data are also presented in Figs. 3 to 9; solid lines correspond to data from the "detailed" method and dashed lines to data from the
"sampled" method. The correlations between the detailed and sampled examinations for each circuit
Fig. 2. View of classroom through the Super 8 movie camera.
-
D E T A I L E D M E T H O D---
S A M P L E D M E T H O D*
80 - ~3 70 - 3 6 0 - -* 0I
1
I
1
I
I
l
I
I
r
1
i
7 8 9 10 11 1 2 13 14 15 16 11 L R l g 20 21 H O U R OF D A YFig. 3. Light usage profile, Area 1.
-
D E T A I L E D M E T H O D--
---
r'l S A M P L E D M E T H O D I-
.---
.---
A R E A 2-
.--.
7 8 9 10 11 12 13 14 15 16 11 18 19 20 21 H O U R O F D A YFig. 4. Light usage profile, Area 2.
-
D E T A I L E D M E T H O D---
S A M P L E D M E T H O D 9 0loo
L
r--IH O U R O F D A Y
Fig. 5. Light usage pro file, Area 3.
-
D E T A I L E D M E T H O D .00---
S A M P L E D M E T H O D q o 80 7 0 6 0 5 0 4 0 3 0 2 0 1 0 0 7 8 9 1 0 1 1 1 2 13 14 15 1 6 1 7 1 8 19 20 2 1 H O U R OF D A YFig. 6. Light usage profile, Area 4.
-
D E T A I L E D M E T H O D---
S A M P L E D M E T H O DH O U R OF D A Y
Fig. 7. Light usage profile, Area 5.
-
D E T A I L E D M E T H O D---
S A M P L E D M E T H O DH O U R OF D A Y
Fig. 8. Light usage profile, Area 6.
Vol. 15 No. 2 1983
-
D E T A I L E D M E T H O D--
---
S A M P L E D M E T H O DH O U R O F D A Y
Fig. 9. Light usage profile, all areas.
area are shown in Table 1. Fig. 10 shows the
correlation between the two types of examination for every combination of circuit area and core hour
Table 1 Correlations between light usages in detailed and sampled frames
Correlation Area 1 Area 2 Area 3 Area 4 Area 5 Area 6
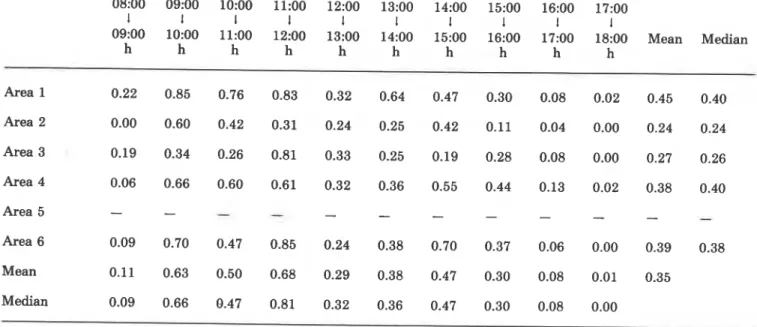
Occupancy in the randomly sampled frames was also examined. The proportion of sampled frames in which one or more persons could be seen in a circuit area was calculated for every core hour. These proportions and those for all circuit areas combined
are shown in Table 2. As occupancy in circuit area
5 could not be properly monitored because of a
partition, this area was eliminated from the analyses where an estimate of occupancy was required. I t should be noted, too, that the camera
S A M P L I N G M E T H O D ( S )
Fig. 10. Correlation of light usage between sampled data and detailed data.
Table
2
Occupancy proportions08:OO 09:OO 1O:OO 11:OO 12:OO 13:OO 14:OO 15:OO 16:OO 17:OO
1 1 1 1 1 1 1 1 1 1
09:OO 10:OO 11:OO 12:OO 13:OO 14:OO 15:OO 16:OO 17:OO 18:OO Mean Median
h h h h h h h h h h Area 1 0.22 0.85 0.76 0.83 0.32 0.64 0.47 0.30 0.08 0.02 0.45 0.40 Area 2 0.00 0.60 0.42 0.31 0.24 0.25 0.42 0.11 0.04 0.00 0.24 0.24 Area 4 0.06 0.66 0.60 0.61 0.32 0.36 0.55 0.44 0.13 0.02 0.38 0.40 Area 6 0.09 0.70 0.47 0.85 0.24 0.38 0.70 0.37 0.06 0.00 0.39 0.38 Mean 0.11 0.63 0.50 0.68 0.29 0.38 0.47 0.30 0.08 0.01 0.35 Median 0.09 0.66 0.47 0.81 0.32 0.36 0.47 0.30 0.08 0.00
provided a better view of some circuit areas than of where L = proportion of frames with observed light
others. Occupancy may therefore be underestimated usage
in certain circumstances. 0 = proportion of frames with observed
Core hour data from the random sampling
procedure were used to plot (Fig. 11) occupancy
(from Table 2) versus light usage (from Figs. 3 to 8)
for every combination of circuit area and core hour.
An occupancy-to-light usage ratio (OIL) can give an
indication of 'problem' areas and times for lighting
energy conservation. If a ratio is equal to 1.0, (i.e.,
if it ties on line A, Fig. 1 I), then 'perfect' behaviour
is exhibited by the occupants; every time the space is unoccupied the lights are off.* Naturally, if
O L = 0 ti.e., points lying on the abscissa) lighting
energy is completely wasted.
The OIL ratios do not, however, give a complete picture of lighting energy conservation. For example, there are certain times with low occupancy to light ratios, but because they
represent a small portion of the energy consumed
during the day (i.e., those points near the origin) they are of little importance. Conversely, there are times with higher occupancy to light ratios when it
would be more profitable to implement conservation
measures because more energy is being used (i.e., those points with very high abscissa values but low or moderate ordinate values). A method for
quantifying lighting energy conservation should therefore consider the absolute lighting energy consumed as well as the occupancy.
A simple measure of lighting energy waste, as
qualitatively discussed by Hunt and Crisp,' can be determined by the difference between light usage and occupancy.
*Note that OIL > 1.0 in Area 2, 09:OO to 10:OO. The teacher occasionally showed movies or slides to students during this time, so that there was sometimes occupancy in the area with no light usage.
occupancy
w = waste term
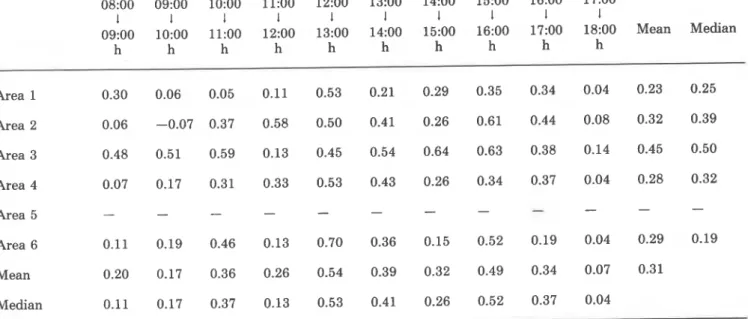
A table of w values for every combination of circuit
area and core hour is shown in Table 3. Row means
and medians indicate typical values for the circuit areas. Column means and medians indicate typical values for the core hours.
The measure, w, is probably more meaningful than OIL for lighting energy conservation; in the former, both absolute light usage and occupancy are considered. Combinations of circuit areas and core hours with the same OIL values do not indicate the same amount of waste. For example, points lying
on line B in Fig. 11 have the same OIL value, but
points further from the origin represent larger amounts of waste simply because the absolute amount of light usage is higher. Conversely, all points lying on a particular line with slope 1.0 (e.g.,
- 0 0.1- 0.2 0.3 0.4 0.5 0.6 0.7 0.8 0.9 1.0 L I G H T U S A G E
Fig. 11. Occupancy versus light usage, sampled data.
Table 3 Waste terms (w)
08:OO 09:OO 1O:OO 11:OO 12:OO 13:OO 14:OO 15:OO 16:OO 17:OO
1 1 1 1 1 1 1 1 1 1
09:OO 10:OO 11:OO 12:00 13:OO 14:OO 15:OO 16:00 17:OO 18:OO Mean Median
h h h h h h h h h h Area 1 Area 2 Area 3 Area 4 Area 5 Area 6 Mean Median
line C) in Fig. 11 represent equal amounts of lighting energy waste. In other words, every point on such a line represents the same amount of unused light. Lowering the absolute value of light usage by the same amount for any point on one of these lines with slope 1.0 represents equal energy savings and, because occupancy is also considered, equal lighting energy conservation.
I t is also worth considering a method of gauging energy conservation efforts, again by taking into account both absolute light usage and occupancy. I t is reasonable to assume that occupancy will be relatively constant for a given combination of circuit area and core hour. I t is unlikely that the teaching activities in open-plan classrooms could be further consolidated. To eliminate wasted lighting energy (w, in equation I ) , therefore, the number of light usage hours (L) will have to be reduced for a given occupancy level (0). After a completely successful energy conservation effort, the points in a plot like that of Fig. 11 will slide horizontally along the light usage abscissa until w = 0. This may well be an unrealistic goal" but it should be possible to select less stringent and more realistic targets so that occupants can improve lighting energy conservation.
Importantly, quantitative targets for lighting energy conservation can be identified by
incorporating the waste term. Equation (1) can be rewritten to give a criterion such as line C in Fig. 11. The criterion line may be written:
where 0 = proportion of frames with observed occupancy
L = proportion of frames with observed light usage
w = waste term
= x intercept
= -(y intercept).
Any points below this criterion line (hatched area) would be candidates for lighting conservation
efforts. Higher criteria (e.g., line D) can also be selected by lowering the waste term (thus
increasing the y intercept). Equation (2), then, can be used to evaluate energy conservation efforts quantitatively. Again, the two important aspects of this measure are absolute light usage and
occupancy. 4 Discussion
Random sampling of events is a traditional, practical and proven method of estimating
characteristics of a large population. A great body of experimental literature rests upon the
assumption that statistics based upon random sampling (e.g., mean, median, standard deviation) can be used to represent features of a larger
population. This same assumption was empIoyed to make the task of analysing the time-lapse data easier. When a check on this assumption was performed, there were high correlations between the detailed data and the sampled data (Table 1, Fig.
10). Based upon traditional statistical assumptions and direct comparisons of detailed and sampled data, subsequent analyses of the sampled data were performed.
The patterns of light usage (based on both detailed and sampled methods) shown in Figs. 3 to 9 were similar to those recorded in other buildings3* 5-9.
Specifically. there was a rapid rise in light usage a t the beginning of the working day, a fairly flat period throughout most; of the core hours, and a gradual tapering off a t the end of the working day. Certain hours during the working day were
associated with high light usage, many exceeding the 90 per cent level. Occupancy patterns must also be considered in ascertaining whether these high usage areas and times resulted from waste or from appropriate utilisation of lighting energy for the occupant activities.
Too often energy conservation efforts are justified solely on the basis of kilowatt hours saved. This philosophy is inappropriate. Assuming that a lighting
system has been designed so that occupants can see well, one wants the lights on whenever a person occupies the space*. By using only kilowatt hours saved as a criterion, one can hamper a person's ability to see by turning lights off in occupied areas or even by dimming or delamping efforts. Of course these procedures will show an immediate savings of lighting energy, but they may in the long run cost
more energy in compensatory efforts to maintain
productivity (e.g., by lighting overtime activities or space for additional manpower). Such productivity assessments are very difficult because of the multifaceted aspects of task performance and thus of productivity. Nonetheless, a wide variety of studies using many measures have demonstrated that people see more poorly as light levels are reduced.'"-[' Again, this large body of data is difficult to translate into profit, but because
employee salaries constitute such a large proportion of building overhead i t seems imprudent to run the
risk of limiting peoples' ability to see.
Wasted light energy should be the prime target of energy conservation; when no one is using a space,
lights should be turned off. This implies that both
kilowatt hours and occupancy need to be considered. Time-lapse photography is capable of providing data on both light usage and occupancy; and meaningful interpretations of such data are possible
with the waste term introduced in this report.
5 Conclusion
Two techniques for time lapse photography have been discussed: (1) The sampling procedure provides accurate data (based upon the high correlation between sampled and detailed techniques) a t a
fraction of the analysis time. (2) The waste term (w
in equation (1 1) can be used to evaluate and
compare lighting energy conservation in various areas for different hours of the day. A change in the waste term can also be used as a measure of the success of lighting energy conservation efforts, Iike
the introduction of more light switches or a poster
campaign. It is hoped that the time-lapse photography technique and the simple analytic procedures introduced here can be used to reduce wasted lighting energy.
Acknowledgements
The authors would like to express their thanks to the teachers and administrative staff of the Robert Hopkins School and the Carleton Board of
*Assuming there is insufficient or unsuitable daylight to satisfy occupants' needs.
Education for their co-operation and for permission to conduct the study. The authors would also like to thank Dr. A. W. Levy, Mr. B. Guzzo and Ms. R. Adm for their contributions.
This paper is a contribution from the Division of Building Research, National Research Council of Canada, and is published with the approval of the Director of the Division.
References
I
Levy, A. W., Lighting controls, patterns of lighting consumption, and energy conservation, IEEE Transactions on Industry Applications, Vol. IA-16, NO. 3, 419-427 (1980).
2
Lowry, R. and Rea, M. S., Energy conservation
through lighting controls, Ltg. Des. & Applic.,
33-35 (1981).
X e v y , A. W., Patterns of lighting use in a large open-plan office 1, Preliminary study and
evaluation, National Research Council of Canada, Division of Building Research, BR Note 129 (1978).
.'
Levy, A. W., Patterns of lighting use in a schoolclassroom. National Research Council of Canada, Division of Building Research, BR Note 132 (1978).
''
Levy, A. W., Patterns of lighting use in a medium open-plan office 2, National Research Council of Canada, Division of Building Research, BR Note 139 (1979).
'
Hunt, D. R. G. and Cockram, A. H., Fieldstudies of the use of artificial lighting in offices:
1 Basic data, Building Research Establishment,
current Paper CP47148, p. 1-23 (1978).
7
Crisp, V. H. C., The light switch in buildings,
Ltg. Res. & Technol., 10, 2, 69-82 (1978).
Hunt, D. R. G., and Crisp, V. H. C., Lighting controls: their current use and possible improvement, Energy Research, 2, 343-374 (1978).
"unt, D. R. G., The use of artificial lighting in
relation to daylight levels and occupancy, Building and Environment, 14, 21-33 (1979).
'O Weston, H. C., The relation between illumination
and visual efficiency: the effect of brightness contrast, Industrial Health Research Board, Medical Research Council, London, England, Report No. 87, 1-35 (1945).
11 Boyce, P. R., Age, illuminance, visual
performance and preference. Ltg. Res. &
Technol., 5, 3, 125-144 (1973).
l 2 Smith, S. W. and Rea, M. S., Proofreading under
different levels of illumination, Jnl. I.E.S.(U.S.A.), 47-52 (October 1978).
T h i s publication is being d i s t r i b u t e d by the Division of
Building R e s e a r c h of the National R e s e a r c h Council of
Canada. I t should not b e r e p r o d u c e d i n whole o r i n p a r t without p e r m i s s i o n of the o r i g i n a l publisher. The Di- vieion would be glad t o b e of a s s i s t a n c e in obtaining s u c h p e r m i s s i o n .
Publications of the Division m a y b e obtained by m a i l - ing the a p p r o p r i a t e r e m i t t a n c e (a Bank, E x p r e s s , o r P o s t Office Money O r d e r , o r a cheque, m a d e payable t o the R e c e i v e r G e n e r a l of Canada, c r e d i t NRC) t o t h e National R e s e a r c h Council of Canada, Ottawa. KlAOR6. S t a m p s a r e not acceptable.
A l i s t of all publications of the Division i s available and m a y b e obtained f r o m the Publications Section, Division of Building R e s e a r c h , National R e s e a r c h Council of Canada, Ottawa. KIA OR6.