HAL Id: hal-00853975
https://hal.archives-ouvertes.fr/hal-00853975
Submitted on 10 Sep 2013
HAL is a multi-disciplinary open access
archive for the deposit and dissemination of
sci-entific research documents, whether they are
pub-lished or not. The documents may come from
teaching and research institutions in France or
abroad, or from public or private research centers.
L’archive ouverte pluridisciplinaire HAL, est
destinée au dépôt et à la diffusion de documents
scientifiques de niveau recherche, publiés ou non,
émanant des établissements d’enseignement et de
recherche français ou étrangers, des laboratoires
publics ou privés.
Inferring Social Ties in Academic Networks Using
Short-Range Wireless Communications
Igor Bilogrevic, Kévin Huguenin, Murtuza Jadliwala, Florent Lopez,
Jean-Pierre Hubaux, Philip Ginzboorg, Valtteri Niemi
To cite this version:
Igor Bilogrevic, Kévin Huguenin, Murtuza Jadliwala, Florent Lopez, Jean-Pierre Hubaux, et al..
Inferring Social Ties in Academic Networks Using Short-Range Wireless Communications. 12th ACM
Workshop on Privacy in the Electronic Society (WPES), Nov 2013, Berlin, Germany. pp.179-188,
�10.1145/2517840.2517842�. �hal-00853975�
Inferring Social Ties in Academic Networks Using
Short-Range Wireless Communications
Igor Bilogrevic
LCA1, EPFL Lausanne, SwitzerlandKévin Huguenin
LCA1, EPFL Lausanne, SwitzerlandMurtuza Jadliwala
Wichita State University Wichita, USA
Florent Lopez
Université Paul Sabatier/IRIT Toulouse, France
Jean-Pierre Hubaux
LCA1, EPFL Lausanne, SwitzerlandPhilip Ginzboorg
Aalto University Espoo, FinlandValtteri Niemi
University of Turku Turku, FinlandABSTRACT
WiFi base stations are increasingly deployed in both public spaces and private companies, and the increase in their den-sity poses a significant threat to the privacy of connected users. Prior studies have provided evidence that it is possi-ble to infer the social ties of users from their location and co-location traces but they lack one important component: the comparison of the inference accuracy between an inter-nal attacker (e.g., a curious application running on a mobile device) and a realistic external eavesdropper in the same field trial. In this paper, we experimentally show that such an eavesdropper is able to infer the type of social relation-ships between mobile users better than an internal attacker. Moreover, our results indicate that by exploiting the under-lying social community structure of mobile users, the accu-racy of the inference attacks doubles. Based on our findings, we propose countermeasures to help users protect their pri-vacy against eavesdroppers.
Categories and Subject Descriptors
C.2 [Computer-Communication Networks]: General; K.4.1 [Computers and Society]: Public Policy Issues—
Privacy
Keywords
Privacy; Social Networks; Mobile Networks; Inference
Permission to make digital or hard copies of all or part of this work for personal or classroom use is granted without fee provided that copies are not made or distributed for profit or commercial advantage and that copies bear this notice and the full citation on the first page. Copyrights for components of this work owned by others than the author(s) must be honored. Abstracting with credit is permitted. To copy otherwise, or republish, to post on servers or to redistribute to lists, requires prior specific permission and/or a fee. Request permissions from [email protected].
WPES’13,November 4, 2013, Berlin, Germany.
Copyright is held by the owner/author(s). Publication rights licensed to ACM. ACM 978-1-4503-2485-4/13/11 ...$15.00.
http://dx.doi.org/10.1145/2517840.2517842.
1.
INTRODUCTION
Innovative Internet mobile services and products, such as location-based services and information-sharing platforms, enable users to enjoy a multitude of applications to easily stay in touch, work, have fun and exchange data. Beside online services accessed through infrastructure-dependent communications (e.g., WiFi hotspots and cell towers), up-coming near-field [22] and peer-to-peer (P2P) technologies, such as Nokia Instant Community (NIC), and Qualcomm’s AllJoin [25], allow for direct device-to-device connections, thus creating a new form of localized and context-aware in-teractions. For instance, Apple’s AirDrop allows users to exchange files between mobile devices by creating an ad-hoc WiFi network. All in all, the amount of data exchanged wirelessly by mobile devices, be it in an infrastructure or P2P ad-hoc mode, has consistently increased over the past few years.
The information that can be inferred only by observing the data exchange patterns, users’ location and co-location traces is of great importance and very sensitive: Home/work locations [18], activities [21], and social networks [9] are of-ten data that people would prefer not to reveal publicly. Users’ social ties are no exception either, as several stud-ies on ubiquitous computing have shown that location and co-location traces alone can reveal the presence and type of social relationships among people [11, 12]. Most of the ex-isting works that evaluate the effectiveness of the inference of social ties from location and proximity data are based on a single source of information: either proximity logs stored on the mobile devices or WiFi/cellular connection data ob-tained from the network operators. Although the existing results are significant and necessary for an initial attempt at tackling the issue of social relationship inference, they lack an important characteristic: data-source diversity for the same experimental settings. In other words, they lack the simultaneous access to proximity data present on both the mobile devices and in the operators’ logs. Having access to these two data sets is paramount, as this enables us to evaluate and compare the accuracy in inferring the social relationships between an internal attacker, who has access
to the data on the device, and an external eavesdropper who does not.
In this paper, we address the problem of social relation-ships inference by carrying a comparative analysis of the ex-posure of such relationships and encounters in a deployed, peer-to-peer and infrastructure-based wireless network. We gathered communication and proximity information from 80 participants carrying smartphones during a four-month ex-periment; Thus our study is the first to possess data-source diversity for the same experimental setting: We collected complementary encounter information both from the smart-phones and from the WiFi sniffing network, comprised of a set of access points (APs) passively intercepting communi-cations between the participants. These two sources reflect accurately the information that can be gathered by (i) a curious application (or rogue firmware) running on a smart-phone or an experimenter and (ii) a network infrastructure owner such as a company which seeks to infer the social relationships between its employees or a network of compro-mised (community) access points; both of them represent realistic and practical adversarial scenarios. By leveraging on such complementary data, we design a statistical infer-ence framework to evaluate the accuracy of the inferinfer-ence of social relationships in localized and pervasive networks. This evaluation provides empirical evidence about the differ-ence between the adversary’s accuracy and that of a curious application in determining the type of social relationships between people. More specifically, our contribution is two-fold:
• We provide the first analysis, to the best of our knowledge, of the exposure of social relationships, based on proximity data, in a deployed adversarial WiFi network with data-source diversity.
• We design a statistical inference framework for rela-tionship classification and use it to evaluate the success of the owner of the WiFi sniffing stations in inferring the type of social relationships between users and com-pare it against a curious application.
Our experimental results show that the infrastructure op-erator is able to infer the relationships between users bet-ter than a curious application that uses on-device proximity data. This is partially due to the fact that the external ad-versary has location information about the encounters be-tween users. In addition, when exploiting the social com-munity structure, the inference accuracy of the attacker is significantly higher. To put our results in perspective, we compare the strength of the considered adversary, in terms of the density of sniffing stations, to some existing hotspot networks.
The remainder of the paper is organized as follows. In Section 2, we introduce the experimental setup and system architecture. In Section 3 we detail the characterization of the social interactions and communities. We describe our relationship inference framework in Section 4 and its appli-cation to the experimental data. In Section 5, we present the results of the inference framework and their implications on the privacy of users’ social relationships. We also discuss the limitations and perspective of this work, as well as coun-termeasures to help users protecting their privacy. Finally, we survey the related work in Section 6 and we conclude the paper in Section 7.
2.
SYSTEM ARCHITECTURE
In this section, we describe the methodology and experi-mental setup of our field experiment, along with the network model and the adversarial model.
2.1
Experiment Setup
During the spring of 2011 (from the beginning of March to the end of June 2011, we conducted a large-scale field exper-iment with 80 participants on a university campus, during which we collected encounter and proximity data. Similarly to previous data collection campaigns [11,17], we configured Nokia N900 smartphones and distributed them to the par-ticipants, sampling from a coherent population of students (96%) and instructors (4%), 80% of the participants being males. The participants answered survey questionnaires at the beginning and in the middle of the experiment, and they were individually interviewed at the end of the experiment. The relevant answers to such questionnaires are used in or-der to construct the ground truth of user relationships. The complete description of the goals and the methodology of the trial, the questionnaires and the interviews is reported in [1]. The experiment was conducted with Nokia and the participants signed a consent form prepared by Nokia and approved by their legal and ethical department.
2.2
Network Model
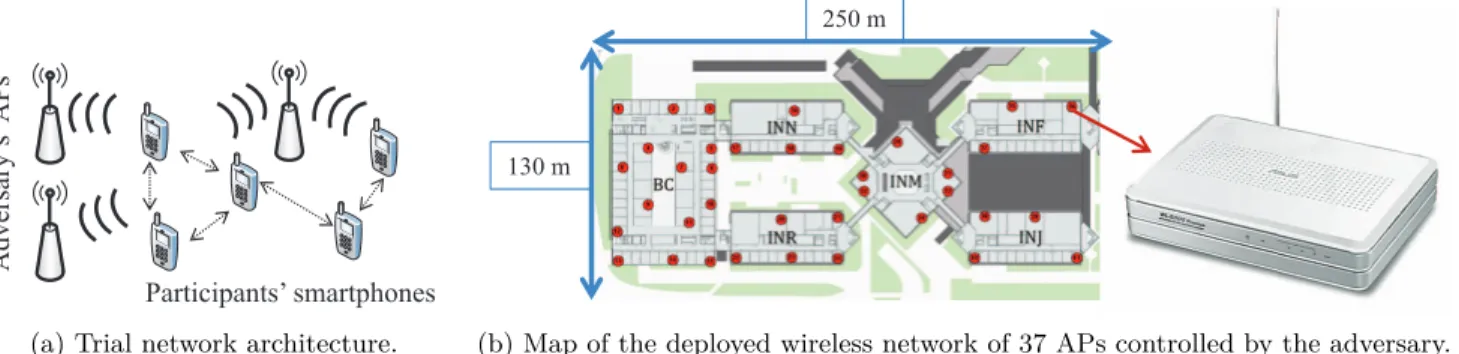
The smartphones were configured with both standard infrastructure-based communications, such as cellular and WiFi, and a WiFi-based P2P technology called Nokia In-stant Community (NIC). Users could connect to standard Internet services by using the WLAN or cellular interface of the device. Also, in order for the participants to exchange information with their physical neighbors in a P2P fash-ion (Figure 1a), the phones were equipped with the NIC wireless P2P messaging platform that allows for localized data exchange and increases the co-located devices’ context-awareness. In addition, several campus and course-related applications were developed in order to encourage the use of the devices throughout the duration of the experiment. To enhance the context-awareness of the pre-installed appli-cations, the devices periodically sent beacon messages and ran background services that collected and stored in the local memory, at regular intervals of [1-30] seconds, infor-mation such as the list of neighbors’ MAC addresses, the associated received signal strength indicator (RSSI) and the timestamp. Each participant was identified by a fixed ran-dom ID assigned at the beginning of the trial, and this ID re-mained unchanged. Considering dynamically changing user IDs, such as temporary pseudonyms in mix-zones [4], is out-side of the scope of this paper. Note that, as of today, most smartphones do not offer easy ways to change their MAC addresses and even when they do, most users never change them manually. And using changing pseudonyms has a neg-ative effect on the usability of the communication features of the device and brings only limited improvement. Whenever a participant’s device connected to the Internet, the new en-counter logs were uploaded on a centralized database storing all device logs. To preserve users’ anonymity, we removed all personal identifier information (such as the mapping be-tween MAC address, IMEI, and participant name) from the database. In order to construct the ground truth for our ex-periments, we kept only the information about (i) the
ran-Adversary’
s
APs
Participants’ smartphones
(a) Trial network architecture.
130 m
250 m
(b) Map of the deployed wireless network of 37 APs controlled by the adversary.
Figure 1: Trial setup and deployed eavesdropping network controlled by the adversary.
dom user IDs, (ii) their self-reported relationships and (iii) the academic registration data (mapped to the user IDs).
2.3
Adversarial Model
We implemented a practical adversary who monitored a fixed area by using a limited number of wireless sniffing sta-tions comprised of either (i) dedicated WiFi APs deployed directly by the adversary or (ii) existing APs compromised by a malware [19, 27], which is a realistic threat to which most of the reconfigurable, current-generation WiFi APs are exposed to. Specifically, the adversary had access to a deployed wireless mesh network of 37 WiFi APs (Asus WL-500gP running OpenWRT Linux) in a specific region of the campus, covering one level of six interconnected build-ings that have a very high user (student) density (Figure 1b). The relative strength of the adversary in terms of the density of APs, is studied by conducting a comparison with a deployed hotspot networks. The coverage area included the classrooms in which two popular courses that the stu-dents attended took place. Each AP passively eavesdropped on the NIC packets generated by the participants’ smart-phones, and it periodically uploaded the eavesdropped data to a server, populating a unified log database. The APs were set in promiscuous mode on the fixed channel used by NIC. Moreover, the adversary did not have access to any informa-tion stored on the mobile devices, and we assume that the devices were honest (i.e., not colluding with the adversary). In order to infer the social relationships, the adversary col-lected the 3-tuple (Timestamp, Source MAC, RSSI) from the sniffed NIC messages. Note that at no time did the participants connect to the Internet through the adversar-ial APs, that were used only for passively sniffing the NIC packets. Due to the localized nature of the NIC message exchanges, they can be captured only by a local adversary. Such data arguably leaks an amount of personal information lower than the data that flows through the infrastructure. Because application-layer encryption was sometimes used to protect the message confidentiality, we assume that the ad-versary did not have access to such data. All adversarial knowledge is built from the analysis of the NIC data, pas-sively collected by the sniffing APs.
3.
SOCIAL INTERACTIONS AND
COM-MUNITIES
In this section, we describe the methodology used to model the user interactions during the experiment. The so-cial graph representing the user interaction is used to infer
the community structure, which is subsequently used to re-fine the social relationships inference mechanism.
In society, people tend to organize themselves in social groups or communities, such as families, colleagues, and friends, where members usually have similarity traits with other members stronger than with non-members [15]. From a graph-theoretic perspective, people and their relation-ships can be represented by an undirected weighted graph
G=(V, E, W ), where the vertex set V corresponds to
peo-ple, the edge set E expresses the existence of a relation-ship between people, and the weight function W : E → R+ quantifies the intensity of such relationships. In their sim-plest form, communities can be represented as subgraphs {Ci= (Vi, Ei, W )}Mi=1, where Ci⊆ G and M is the number
of communities. As people can be members of several com-munities, different community subgraphs can share vertices.
3.1
Experimental Data
In our experimental data, we have two sources of proxim-ity information: (i) the internal data, constituted by local device logs collected by the mobile devices themselves (the devices of all the participants have been compromised by the internal adversary, e.g., through a rogue firmaware up-date) and containing encounter data (list of neighbors’ MAC addresses, the timestamps and the RSSI values of received packets), and (ii) the adversarial data, containing the head-ers of the sniffed packets (sent by the mobile devices), which include the timestamps and RSSI values of received packets at the sniffing APs, as well as the device ID of the sender.
We use these two data sources to formulate the ‘strength’ or intensity of the social relationships between users and to define the weights of the edges that connect the respective vertices in the social graph G = (V, E, W ). From the local device logs, we can directly obtain the device-to-device prox-imity information because the recorded RSSI values on the receiving devices are correlated with the real distances to the sending devices. However, this is not the case for the RSSI values recorded by the adversarial network, as they depend on the distance between the sending device and the receiving sniffing station. Therefore, the adversary needs to derive the device proximity information from the device-to-AP RSSI values: the adversary first estimates the position of a device and then computes the device-to-device proxim-ity information in order to determine the weights between vertices of the graph. To this end, we used a localization al-gorithm based on trilateration; it determines the estimated position of a mobile device that sent a packet based on the RSSI at all sniffing stations that overhear the packet.
Relationship Labels
In addition to the strength of social relationships, we also characterize the type of relationship between users. More specifically, we consider three labels: (i) friends, (ii)
class-mates and (iii) others.1 The possibility of associating multi-ple labels to a single relationship is crucial in social networks, as people can be simultaneously classmates and friends. To construct the ground truth data, each relationship is as-signed one (or more) labels based on (i) the participants’ an-swers to the survey questionnaires (for friends) and (ii) the database of academic course registration provided by the university (for classmates). For instance, if two participants followed the same class during the experiment, their rela-tionship was categorized as classmates; furthermore, if one of the same participants also listed the other as friends in the questionnaires, their relationship was categorized as both
classmates and friends. We note here that for the
friend-ship label, due to the lower number of declared friendfriend-ships, we considered asymmetric relationships as symmetric be-cause of the subjective nature of the friendship relationship that could be perceived by one person and not by the other. From our ground truth data, we observed that 25% of all the 3,160 possible relationships were tagged as classmates and 2% as friends. We tagged the remaining as others.
We choose these types of relationships for two reasons. First, we followed the approach of [7] and selected the types of relationship relevant to our context. For instance, as our population was comprised almost exclusively of students on a university campus, we considered the two relationship types aforementioned, as well as the estimated user loca-tion. For a more diverse on-campus population, including researchers and instructors, we would have had to consider the role of the hierarchy as well. Second, it was possible for us to collect the ground truth for these two types of rela-tionships.
In our proximity network, we consider three distinct weight functions {w(d)i,j}3
d=1 for the edges between vertices
i, j ∈ V to quantify the intensity of their social interactions.
The three weight functions [5], progressively take into ac-count the proximity, the intensity, and the aging/recency of the relationships between users. Moreover, to investigate the effect of community detection on the accuracy of the in-ference attack, we apply the well-suited CPM method [24] to extract community information from the social graph G. In the Evaluation section we present the results of the at-tacker’s success for each of the three weight functions, with and without community detection.
4.
RELATIONSHIP INFERENCE
FRAME-WORK
In this section, we introduce our relationship inference framework by which we evaluate the accuracy of the at-tacker’s reconstruction of users’ social relationships.
4.1
Relationship Characterization
The relationships between two users are characterized by their interactions. To characterize and classify relationships, we first formalize the notion of encounter : it captures a
1Friends and classmate relationships can be more easily
rec-ognized based on just on-campus encounter data. More com-plex relationships, such as “lovers” and “family”, require ad-ditional contextual data which our dataset does not include.
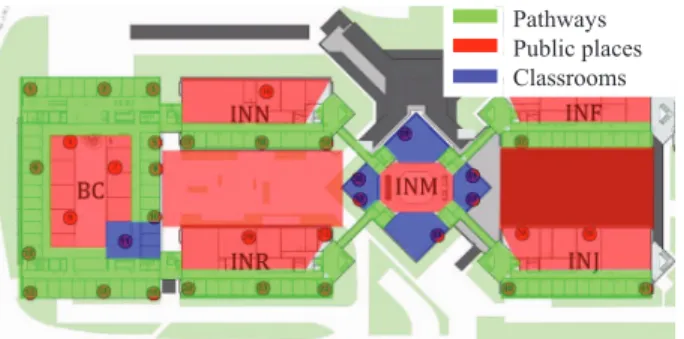
Pathways Public places Classrooms
Figure 2: Partition of the map (in which the ex-periment was conducted) into three types of areas: pathways, public places, and classrooms.
significant interaction between two users. A relationship is
defined by a set of encounters.
Encounter Detection
We define an encounter between any two users as a con-tinuous time interval that meets a threshold, both on its duration and on the proximity of the two involved users. Typical values of these thresholds are 5 minutes and a 20 meters, respectively. The proximity between users is com-puted in two ways, according to the source of the data. From the internal device logs, we use the RSSI values of messages exchanged between users (in a P2P fashion) in order to de-termine their distance, whereas from the adversarial sniffed data, the proximity is determined by computing the Euclid-ian distance between the estimated location coordinates of each user, based on device-to-AP RSSI values.
A number of features are extracted from the inter-nal/adversarial logs, either at the granularity of an en-counter or of a relationship. For instance, we extract the duration of each single encounter and the total number of encounters between the two users for each relationship. The extracted features are then fed to the classification algo-rithm. In order for the adversary to accurately classify the relationships based on specific features, these features must vary significantly from a category (such as friends) to another. Typical discriminating features include encounter duration, the proximity of users during encounters, inter-encounter time, and the number and periodicity of encoun-ters [28]. Training set feature extraction Internal logs / adversarial estimates Parameters optimization (EM, AIC) Trial Data
Survey relationship labels Training Data
Gaussian Mixture Model
Test set feature extraction
Test Data
Maximum Likelihood
Classifier
True / False Positive Rate Synthetic pdfs
Figure 3: Overview of the inference framework.
4.2
Relationship Classification
In order to select the set of possible relationship classes, we use the ground-truth collected through (i) survey ques-tionnaires at the beginning of the trial and (ii) the official
university course-registration database. According to the answers of the participants and the university register, we selected three classes of pairwise relationships between users, i.e., friends, classmates, and others. We then designed an inference framework (Figure 3) based on the features ex-tracted from the internal/adversarial data.
The classification algorithm operates as follows. First, we extract the features of a small subset of the encounters and relationships, namely a training set. From the survey and administrative records, we know the category of each encounter and relationship in the training set. Then, for each of the three categories of relationships, we compute the experimental probability density function (pdf) of the various features and plot the corresponding histograms. We fit each experimental probability density function with an appropriate parametric model, the Gaussian Mixture Model (GMM) [11], and determine the parameters according to two optimization criteria. The obtained synthetic pdfs are subsequently used to classify the encounters of the rest of the data set, i.e., the test set. Based on the synthetic pdfs, for each encounter and for each category of relationships, the likelihood that the encounter belongs to this category is computed from the values of its features. The likelihood that a relationship belongs to a given category is computed by taking into account the different features of the relationship and those of its encounters.
4.2.1
Encounter Location Classification
In our work, the location where encounters take place is a key feature of relationships. This information is only avail-able in the adversarial data and is computed from the users’ locations estimated by the adversary. More specifically, the region of the experiment covered by the adversarial net-work is partitioned into different areas classified in three types: pathways, public spaces and classrooms (Figure 2). We expect such a classification to be discriminating, with respect to the types of relationships the adversary wants to infer. For instance, classmates are expected to experience frequent encounters mostly in classrooms, whereas friends might hangout more frequently in public spaces and path-ways. Because users can move during a given encounter, for each encounter, we compute the proportion of the time spent in each type of location. In this way, we can cap-ture the fact that an encounter that started in a pathway continues through public spaces.
4.2.2
Feature Extraction
We detect encounters based on interaction duration and proximity between users. With the internal data, we as-sume that an encounter occurred if at least two messages are exchanged within an interval of 5 minutes and the average RSSI of the exchanged messages is greater than -80 dBm (to account for radio noise, interference and fading), which cor-responds to a distance of at most 18 meters. These thresh-old values have been determined empirically. The encounter spans from the first exchanged message to the last. For ex-ample, if two users exchange messages, all with RSSI values of -50 dBm, at times 1, 3, 7, and 15 minutes, an encounter is detected and it spans from 1 to 7 minutes (the last message arrives too late to extend the encounter duration). With the adversarial data, we first need to estimate the users’ loca-tions. In order to reduce the noise on the users’ estimated locations, we divide the trial timeline in small sub-intervals
of 30 seconds and we average user locations over each sub-interval. First, we consider that an encounter occurs if at least two messages are exchanged within an interval of 5 min-utes and the distance between the two users’ locations is consistently lower than 5 meters (i.e., lower than 5 meters in each sub-interval between the times at which the messages were exchanged). To compare the results with the internal data, we also considered distance thresholds of 10, 20, 30, and 40 meters, corresponding to RSSI values of -68, -82, -91, and -97 dBm, respectively (according to the Haka-Okumura radio propagation model [8]).
At the granularity of an encounter, we extract the follow-ing features: (i) the encounter duration (the time elapsed between the first and last message exchanged during the en-counter), (ii) the inter-encounter time (the time elapsed since the end of the previous encounter and the beginning of the current encounter), and (iii) the average encounter
RSSI value (the average of the RSSI values of the messages
exchanged during the encounter). For the adversarial data, we further consider (iv) the encounter location, charac-terized by the fraction of the encounter time that takes place at each type of location, such as pathways, public places and classrooms. The location of an encounter is defined as the midpoint of the two users. At the granularity of a relation-ship, we consider an additional feature: the total number
of encounters over the whole trial.
4.2.3
Supervised Learning
In order to train our inference framework, we use a ran-dom subset (the training set) of all the relationships, which account for approximately 30% of the whole data set. We divide the relationships in the training set into three cat-egories, i.e., friends, classmates, and others according to the labels obtained from the surveys and the university database. Because two users can simultaneously be friends and classmates, a relationship can belong to both categories. Note that an alternative way to proceed would be to divide the training set into four categories: friends, classmates,
others, and friends and classmates. However, as in our data
set the “friends and classmates” category does not contain enough relationships to perform a proper training, we con-sider only the first three categories: friends, classmates,
oth-ers. For each category, and for each feature, we compute the
experimental distribution of the feature for all the relation-ships in the category, by means of histograms composed of 100 bins. We denote by ˜fcatfeat, cat ∈ {friends (f ), classmates
(c), others (o)} and feat ∈ {encounter duration (ed), inter-encounter time (iet), average RSSI (rssi), and number of encounters (ne)} (and encounter location (el) for the adver-sarial data), the functions corresponding to the histograms. For example, ˜fed
f (x) gives the proportion, in the training
set, of encounters between friends that last between x and
x + δx minutes. These functions can be thought of as
indi-cators of the likelihood that a given encounter belongs to a given category, based on the value of one of its features, and will be used as such by our classification algorithm.
Intuitively, it can be expected that the pairs of users whose relationships are classified as friends and classmates would experience more frequent encounters than users belonging to the category others. Similarly, classmates are expected to meet according to a fixed pattern (e.g., every Monday for a particular class), whereas on-campus encounters between friends are not expected to follow a fixed pattern. This
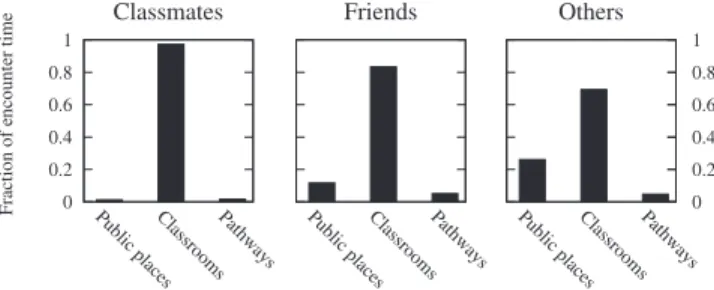
intu-ition is confirmed by our observation of the data, as shown in Figures 4 and 6. The former depicts the experimental distribution of two features: the encounter duration (at the granularity of an encounter) and the number encounters (at the granularity of a relationship), whereas the latter shows the location feature. It can be observed that, as expected, these features discriminate the three categories of relation-ships, therefore we foresee a high potential for classification. For instance, friends meet more than classmates and
oth-ers and classmates meet for longer times (classes). Also, classmates meet mostly in classrooms. Note that the
afore-mentioned intuitions are given for the sake of information, the inference algorithm is based on the rigorous techniques that we describe. 0 0.2 0.4 0.6 0.8 1 Public place s ClassroomsPathways Fraction of HQFRXQWHU time Classmates Public place s ClassroomsPathways Friends Public place s ClassroomsPathways 0 0.2 0.4 0.6 0.8 1 Others
Figure 4: Encounter location feature for the adver-sarial data (distance threshold of 40 meters).
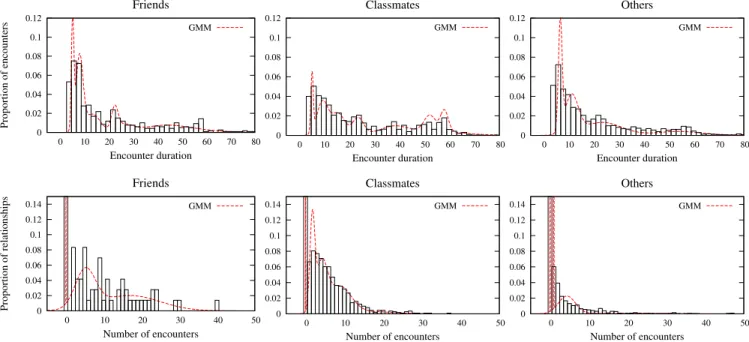
As it can be observed in Figure 6, the experimental dis-tributions are noisy and thus cannot be used as is for clas-sification purposes: For instance, we can observe in the his-tograms that there are no relationships between friends com-posed of exactly 35 encounters in our training set. Therefore, if the histogram of the number of encounters is used as is to determine the likelihood of two users being friends, two users who meet 35 times during the trial would be assigned a null likelihood for the friends category. For this reason, we fit the experimental histograms with parametric pdfs, namely multi-dimensional Gaussian mixture models of the form: p(x; θ) = K X k=1 πk 1 p |Σk|(2π)d/2 e−12(x−µk)TΣ−1k (x−µk), (1) whereP
kπk= 1 and d is the dimension of the feature
vec-tor. The set of parameters is denoted by θ = ((π1, µ1, Σ1),
. . . , (πK, µK, ΣK)), and x is the value of a feature. We use
one-dimensional GMMs for scalar features, e.g, encounter duration, and multi-dimensional GMMs for the encounter location (fractions of time spent in pathways, classrooms, and public places).
The number K of Gaussian components, and their re-spective weights (πk), means (µk), and covariance matrices
(Σk) are free parameters and must be chosen to best fit
the experimental distributions. For a given value of K, we determine the other free parameters of the Gaussian compo-nents through expectation maximization (EM). We choose the values of the parameters that maximize the likelihood that the n values {xi}i=1..nof the features (observed in the
training set) have been drawn from a Gaussian mixture with
these parameters. The likelihood function is given by
`(θ; x1, . . . xn) = n
Y
i=1
p(xi; θ), (2)
and the estimated value of the parameters is ˆθ = arg maxθ
`(θ; x1, . . . xn). We repeat this estimation step for several
values of K, and we subsequently determine the most ap-propriate value of K according to the Akaike information criterion [2]: AIC = 2k0− 2 ln `(θ), where k0
is the number of parameters of the GMM.
The learning phase produces a likelihood function `featcat
for each category cat ∈ {f, c, o} and for each feature feat ∈ {ed, iet, rssi, ne} (and el for the adversarial data).
4.2.4
Relationship Classifier
Our classification algorithm is based on likelihood maxi-mization and operates in two steps. We first determine if the two users are actually involved in a relationship (friends or classmates) or not (others) based on the likelihood of a relationship, with respect to each category. This likelihood is computed from the value of the features and from the syn-thetic distribution obtained from the training set. If users are believed to have a relationship, we refine the classifica-tion by discriminating between friends and classmates.
More specifically, the algorithm operates as follows (see Figure 5 for illustration). If the likelihood is maximized for the others category, the relationship is classified as others and the classification ends. If it is maximized for the friends category, the relationship is assigned the friends label and a second step is performed to decide whether the classmates label is assigned as well. This second step is based on a threshold: If the likelihood of the relationship for the cate-gory classmates is higher than the likelihood of friends mul-tiplied by a factor γ ∈ [0, 1], the relationship is assigned the classmates label as well. The same process applies in the case the likelihood is maximized for the classmates cat-egory. The classification process can be summarized by the decision tree depicted in Figure 5.
ℓf≥max (ℓc, ℓo)
friendsand classmates ℓc≥γ · ℓf friends ℓc< γ · ℓf ℓo>max (ℓf, ℓc) others ℓc≥max (ℓf, ℓo) ℓf< γ · ℓc classmates
friendsand classmates ℓf≥γ · ℓc
Figure 5: Decision tree used by the classifier.
The likelihood `catof a relationship, with respect to each
category cat, is given by
`cat(r) = Y e∈r `edcat(ed(e))·` iet cat(iet(e))·` rssi cat(rssi(e)) ! × `cat(ne(r)) , (3)
where m ∈ r denotes the encounters between the two users concerned by the relationship r. For the adversarial data,
0 0.02 0.04 0.06 0.08 0.1 0.12 0 10 20 30 40 50 60 70 80 Proportion of encounters Encounter duration Friends GMM 0 0.02 0.04 0.06 0.08 0.1 0.12 0 10 20 30 40 50 60 70 80 Encounter duration Classmates GMM 0 0.02 0.04 0.06 0.08 0.1 0.12 0 10 20 30 40 50 60 70 80 Encounter duration Others GMM 0 0.02 0.04 0.06 0.08 0.1 0.12 0.14 0 10 20 30 40 50 Proportion of relationships Number of encounters Friends GMM 0 0.02 0.04 0.06 0.08 0.1 0.12 0.14 0 10 20 30 40 50 Number of encounters Classmates GMM 0 0.02 0.04 0.06 0.08 0.1 0.12 0.14 0 10 20 30 40 50 Number of encounters Others GMM
Figure 6: Experimental distributions (histograms) and fitted GMM pdfs (dashed lines) of two features
extracted from the adversarial data (distance threshold of 40 meters): encounter duration and number
encounters.
the factor `el(el(e)) must be inserted in the product in
Equa-tion (3) to take locaEqua-tion into account.
5.
RESULTS
In this section, we present the performance results of our relationship classification inference framework. First, we de-scribe the metrics used to evaluate the inference accuracy of the adversary, then we discuss the performance of the classi-fier and the effect on the users’ relationship privacy. Finally, based on our results, we discuss possible countermeasures to mitigate the success of the adversary in inferring social re-lationships. We evaluate his success by using both pairwise-only and community-enhanced proximity information.
5.1
Pairwise Relationship Inference
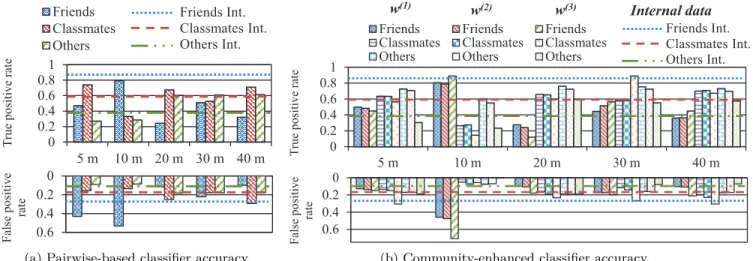
The performance of a classifier is usually evaluated in terms of its true positive rate (TPR) and false positive rate (FPR). Hereafter, we present the accuracy of the adversary’s relationship inference on our data set, where the adversary considers only the estimated pairwise proximity information between users, i.e., without taking into account the under-lying community structure. Figure 7a shows the TPR and FPR for the three classes for different values of the distance threshold.
Internal Proximity Data. By using the internal proximity information between users, the performance of our infer-ence framework is, in general, satisfactory, given the lim-ited amount of training samples (30% of the total). This means that we have a high TPR and a moderate FPR. For the class friends, we observe the best TPR (84%) and a moderate FPR (27%), which means that the actual prox-imity data and the encounter features we selected for the classification are quite discriminating for this class. Class-mates and other relationship classes have a TPR/FPR of
56%/18% and 37%/13% respectively, which are lower than for friends. As a result, the actual proximity data works well for the friends and classmates relationships inference, whereas it has a more limited success in classifying other types of relationships. This is not surprising, as proximity information, without taking into account the actual location of the interaction, is intuitively tied to inferring close and periodic interactions more than sporadic encounters.
Adversarial (Estimated) Proximity Data. First, at a lower encounter-distance threshold (5-10 meters), the adversary has a very high TPR rate for classmates and friends (79% and 74% respectively) while it suffers from an elevated FPR as well (53% for friends). The accuracy for others is rela-tively low at 28%, meaning that the prediction suffers from a significant number of false positives that negatively af-fect the successful recognition of friends and classmates. Whereas, for larger encounter-distance thresholds (20-40 meters), the accuracy for others doubles and is consistently larger than for the friends.
Internal vs. Adversarial. For low encounter-distance thresholds, on one hand the external adversary has a similar or higher accuracy in correctly inferring the relationships of participants compared to the case of the internal adversary (i.e., using the actual proximity data). On the other hand, the FPR is also substantially higher, which renders the rela-tionship prediction much less reliable at low distance thresh-olds. As the adversary can estimate, in addition to users’ proximity, some contextual information (location of the en-counter), it is easier for him to infer the type of relationship given this additional feature, but it is also easier to wrongly include other types of relationships in the friends class.
When increasing the distance threshold (20-40 meters), we can see that the success in inferring friendships from external data decreases by at least 50% when compared to
0 0.2 0.4 0.6 0.8 1 5 m 10 m 20 m 30 m 40 m T rue positiv e ra te Friends Classmates Others 0 0.2 0.4 0.6 Fa lse positiv e rate Friends Int. Classmates Int. Others Int.
(a) Pairwise-based classifier accuracy.
0 0.2 0.4 0.6 0.8 1 5 m 10 m 20 m 30 m 40 m T rue positiv e ra te
Friends Friends Friends
Classmates Classmates Classmates
Others Others Others
w
(3)Internal data
0 0.2 0.4 0.6 Fa lse positiv e ratew
(1)w
(2) Friends Int. Classmates Int. Others Int.(b) Community-enhanced classifier accuracy.
Figure 7: Accuracy of the external adversary in inferring social relationships. The horizontal lines correspond to the accuracy of the classifier when the internal (local device) proximity data is used.
the case where internal data is used. Meanwhile, there is a two-fold increase in TPR for the others category. In other words, the larger the allowed distance between users is, the better the inference accuracy for the others category. And the classmates performance stays at comparable levels for the different distance thresholds.
Overall, we observe that the increase of the encounter-distance threshold for the adversary is highly beneficial for the detection of non-friendships. By adjusting such a thresh-old based on the target relationship class, the external ad-versary obtains an inference performance comparable to that of the internal adversary who uses the actual proximity in-formation available on the devices.
5.2
Community-Enhanced Relationship
In-ference Results
Hereafter, we describe the performance of the relationship inference framework when the adversary relies on the un-derlying structure of user communities. This pre-processing step will enable us to observe the effect of such information on the accuracy of the adversary’s inference compared to the previous case without community information. The results are shown in Figure 7b.
Internal vs. Adversarial. For low-distance threshold val-ues (5 meters), we see that the external adversary has a TPR comparable to the case where no community infor-mation is extracted (for most weight functions). However, the FPR values are significantly different: The false-positive rate for friends and classmates relationships is three to four times lower when using community structure than when not. When inferring the others class of relationships, the TPR is three times better than the community-less counter-part, with only a comparable FPR. These results indicate that by using the community structure of social relation-ships among users, the adversary is able to significantly in-crease his performance (both in terms of TPR and FPR) across all relationship types, especially in terms of false pos-itives. With respect to the weight functions we defined for the CPM community detection algorithm, we can see that the first two functions w(1) and w(2) (see [5] for a detailed
definition and formulation of the weight functions) have a slightly better performance for friend and classmate rela-tionships and are twice as good for the others class. This suggests that by modeling the interactions of non-friends or classmates with memory-less weight functions, the detected community structure is better suited for distinguishing be-tween such types of relationship, as they did not exhibit most of the periodic and close interactions during our ex-periment as friends or classmates.
5.3
Discussion
The results we have presented so far show that, even with-out any additional pre-processing by the adversary, the es-timated location and proximity among mobile users is often enough to make accurate predictions about the kind of social relationship between any two users (Figure 7a). Even if the users rely on encryption for their communications, the con-sidered external adversary can distinguish users as friends, classmates or neither by capturing their identifiers and by correlating them over time and space.
Even more striking is the fact that by adding an extra step in the inference process, both the accuracy (TPR) and reliability (FPR) are improved significantly. In particular, the dynamic social community structure of people and their behavior over time leak a substantial amount of additional private information to the adversary. By pre-processing the proximity data and detecting communities, in most cases the adversary is able to double his performance when inferring the types of relationships between users inside communi-ties, much to the detriment of the privacy of users and their communities. This suggests that even a simplistic charac-terization of human encounters, based on memory-less and time-independent functions, GPS-less data and standard tri-lateration positioning algorithms, is enough to enable a wire-less infrastructure owner to successfully detect communities and to determine the type of relationships among users in-side each community.
Finally, by transposing our results to existing wireless networks, we hypothesize that similar findings can be ob-tained by self-interested or curious third-parties, such as commercial service providers, cellular network operators,
WiFi network operators (commercial, companies, institu-ions). The increasing deployment of low-range cellular base stations [13] and the increased availability of public WiFi hotspots [14] severely undermine people’s ability to resist or opt-out from unwanted scrutiny.
5.4
Countermeasures and Limitations
Countermeasures. A solution for limiting the success of the
inference attack, which is specific to the threat presented in this paper, consists in reducing the information available to the adversary and his confidence in this information. To achieve this, technical solutions include the use of changing pseudonyms as wireless identifiers and sending dummy mes-sages. With pseudonyms, users can change their MAC ad-dress every day while off-campus or, upon encounters, collec-tively interrupt all communications for a certain time and re-connect with fresh random pseudonyms (i.e., mix-zones [4]). The use of pseudonyms makes it difficult for the adversary to link and track identities of users over time. It reduces the learning period to a few hours instead of a the whole trial timespan, therefore decreasing the success of the inference. However, such a mechanism has a negative effect on the us-ability of the communication features, e.g., Bluetooth pair-ing and MAC filterpair-ing. Another technical countermeasure is to dynamically change the transmission power to confuse RSSI-based triangulation and limit the eavesdropping pos-sibilities. However this comes at the cost of decreased net-working performances. Finally, injecting dummy messages would artificially increase the intensity of the encounters, thus, biasing the results of the inference.
Limitations. The results and discussions presented in this study are based on a large-scale experiment conducted on a university campus, where most of the participants are stu-dents. The characteristics of such a population are rather homogeneous, with respect to the utilization of technology and the age. As in several other university-based field ex-periments, the results of our study might apply – to a lower extent – to scenarios involving a more diverse population with respect to education, age, gender and technology us-age habits. In order to mitigate this, as part of our future work we would like to extend our experiment to a more di-verse population, and therefore to assess the effectiveness of the inference attacks in a more mixed environment. Finally, as off-campus interactions are more insightful with respect to social relationships – for instance, the larger variety of location types (e.g., bars, cinemas and residential areas in-stead of just public places and classrooms) – we expect a greatly improved performance of the inference when consid-ering off-campus interactions as well. This would enable us to consider fine-grained social relationships, such as close friends and relatives.
Strength of the Adversary. Regarding the relative strength
of the adversary considered in the paper, with respect to the number of WiFi APs, we studied the density of three de-ployed WiFi AP networks for comparison. First, we looked at the FreeWifi [16] and SFRWifi [26] hotspots networks that consist of the wireless modems and set-top boxes of the subscribers of two major ISPs (Free and SFR respectively, which have ∼5M subscribers each for a population of 65M) operating in France. Such networks of hotspots constitute concrete and illustrative examples of the adversary consid-ered in this paper as they are operated by a single entity, i.e., the ISP. In particular, the ISP can silently update the
firmware of the wireless AP for all hotspots in the network. The maps of these hotspot networks are available on-line, integrated in Google Maps, on dedicated website [16, 26]. By inspecting the traffic generated when visiting the map websites, we were able to extract the url to obtain the list of hotspots (together with their GPS coordinates) located in a given geographic region described by its north east and south west corner. Because the number of returned hotspots was limited to a hundred, we recursively split the region of interest in four until all the hotspots were returned. For the Paris area, the average density is 564±270 APs/km2 (resp.
853±346 APs/km2), and goes up to 1450 APs/km2 (resp. 1560 APs/km2) in populated areas for Free (resp. SFR). The FON [14] hotspots network has an even higher density as it includes the SFRWifi network. For comparison, the adversarial network of sniffing APs considered in our study has a density of 1138 APs/km2(37 APs deployed over a
re-gion of size 130 m×250 m), which is even lower than that of the real networks in densely populated areas. Another illus-trative example is that of a company exploiting its network of WiFi stations to infer the social relationships between its employees. For instance, EPFL has ∼880 WiFi APs de-ployed over a region of 500 m×800 m, that is a density of 2200 APs/km2. As these statistics suggest, there exist
ex-amples of deployed WiFi AP networks that have a similar or higher density than the adversary considered in this pa-per, which shows that the results presented in our work are realistic and applicable to existing networks.
6.
RELATED WORK
Eagle et al. [11, 12] studied complex social systems by col-lecting Bluetooth encounter data from 94 students equipped with mobile phones. In particular, they identified proximity patterns between devices and performed relationship infer-ence on the data by comparing the results with the ground truth obtained from surveys and answers to questionnaires. Similarly to other user studies [10, 23], the authors could only compare their findings (based on Bluetooth encoun-ters between devices) with the ground truth, without hav-ing access to a network infrastructure that would allow them a more thorough analysis by comparing these results with those obtained by a passive third-party adversary. However, off-campus location data was collected in [11, 12] and it sig-nificantly improved the quality of the inference results. A recent study [3], performed on a group of 27 participants, shows that it is possible to accurately infer the social ties between people based on Bluetooth encounters, phone calls, SMSs and cell-tower IDs, without any prior knowledge about the participants. Nevertheless, these findings are based on data that is available only on the local devices, therefore it is unclear to what extent the results apply to the inference suc-cess of an external adversary. Other studies focused on infer-ring the social ties from co-presence of users, as in the case of Flickr [9], and on dynamics of inter-encounter times [28]. A large user study, involving 168 participants over 2 years, was conducted in [20] in order to study people’s behavior with respect to mobile phone usage, activity and location.With regard to location privacy in pervasive wireless networks, [6] studied the efficacy of dynamic allocation of pseudo-random IDs in specific regions called mix-zones [4], showing that in deployed networks such a mechanism provides only limited success in protecting users’ location privacy.
7.
CONCLUSION AND FUTURE WORK
In this work, we experimentally evaluate a practical adver-sary’s accuracy in inferring the type of relationship of users in ubiquitous networks. The availability of source-diversity in our experiment, enables us to compare the accuracy of an external adversary with that of an internal adversary (e.g., a malicious application) who has access to actual proxim-ity information stored on the devices. Our results show the following two aspects. First, social ties are exposed to a significant inference threat by an external adversary, who can quite accurately infer the type of social ties between users simply by relying on location estimates and encounter characteristics, compared to a curious application running on the device (or to the experimenter). Second, by applying a well-suited community detection algorithm, the adversary can double his inference accuracy on the same data set.
As part of our future work we intend to evaluate the effi-cacy of existing countermeasures as well as design a scheme that would limit the adversary’s accuracy, for example by dynamically changing the fixed identifiers (MAC addresses) based on time- and location-context. We also intend to study the effect of the density of the WiFi APs and consider additional features such as the time at which the encoun-ters occur. Finally, we plan to extend our experiments off-campus and refine the relationship categories accordingly.
8.
ACKNOWLEDGEMENTS
This work has been partially conducted while F. Lopez was with EPFL and P. Ginzboorg and V. Niemi were with Nokia. We would like to thank Imad Aad for the fruitfull discussions, as well as Nokia for supporting this project.
9.
REFERENCES
[1] I. Aad, M. Jadliwala, I. Bilogrevic, V. Niemi, J. Hubaux, P. Ginzboorg, and K. Leppänen. Nokia Instant Community at EPFL: A Real-World Large-Scale Wireless Peer-to-Peer Trial. Technical Report 170421, EPFL, 2011.
[2] H. Akaike. A New Look at the Statistical Model Identification. IEEE TAC, 19:716–723, 1974.
[3] J. Banford and J. Irvine. Estimating social graphs in an education environment. IEEE VT Mag., 7(1), 2012. [4] A. Beresford and F. Stajano. Location Privacy in
Pervasive Computing. IEEE Perv. Comp., 2, 2003. [5] I. Bilogrevic, M. Jadliwala, I. Lám, I. Aad,
P. Ginzboorg, V. Niemi, L. Bindschaedler, and J. Hubaux. Big brother knows your friends: on privacy of social communities in pervasive networks.
Pervasive, pages 370–387, 2012.
[6] L. Bindschaedler, M. Jadliwala, I. Bilogrevic, I. Aad, P. Ginzboorg, V. Niemi, and J. Hubaux. Track me if you can: On the effectiveness of context-based identifier changes in deployed mobile networks. In
NDSS, 2012.
[7] S. P. Borgatti, A. Mehra, D. J. Brass, and
G. Labianca. Network Analysis in the Social Sciences.
Science, 323:892–895, 2009.
[8] A. Bose and C. Foh. A Practical Path Loss Model for Indoor WiFi Positioning Enhancement. In ICICS, 2007.
[9] D. Crandall, L. Backstrom, D. Cosley, S. Suri, D. Huttenlocher, and J. Kleinberg. Inferring Social
Ties from Geographic Coincidences. Proc. Nat. Ac.
Sc., 107:22436–22441, 2010.
[10] C. Diot. Haggle Project.
http://www.haggleproject.org/. Last visited 13/Mar/2013.
[11] N. Eagle and A. Pentland. Reality mining: sensing complex social systems. Pers. Ubiq. Comp., 10:255–268, 2006.
[12] N. Eagle, A. Pentland, and D. Lazer. Inferring Friendship Network Structure by Using Mobile Phone Data. Proc. Nat. Ac. Sc., 106:15274–15278, 2009. [13] Femto Forum.
http://femtoforum.org/fem2/pressreleases.php ?id=277, Last visited 13/Mar/2013.
[14] FON. http://corp.fon.com/en. Last visited 13/Mar/2013.
[15] S. Fortunato. Community Detection in Graphs.
Physics Reports, 486, 2010.
[16] Map of FreeWifi Hotspots.
http://iphone.r0ro.fr/fwConnect/map.php, Visited on 01/Nov/2012.
[17] N. Gong, M. Laibowitz, and J. Paradiso. Dynamic Privacy Management in Pervasive Sensor Networks. In
Proc. Int. Joint Conf. on Ambient Intell., 2010.
[18] B. Hoh, M. Gruteser, H. Xiong, and A. Alrabady. Enhancing Security and Privacy in Traffic-Monitoring Systems. IEEE Perv. Comp., 5:38–46, 2006.
[19] H. Hu, S. Myers, V. Colizza, and A. Vespignani. Wifi networks and malware epidemiology. Proc. Nat. Ac.
Sc., 106(5):1318, 2009.
[20] N. Kiukkonen, J. Blom, O. Dousse, D. Gatica-Perez, and J. Laurila. Towards Rich Mobile Phone Datasets: Lausanne Data Collection Campaign. In ICPS, 2010. [21] Y. Matsuo, N. Okazaki, K. Izumi, Y. Nakamura,
T. Nishimura, and K. Hasida. Inferring Long-term User Property based on Users. In IJCAI, 2007. [22] A Definitive List of NFC Phones.
http://www.nfcworld.com/nfc-phones-list/, Last visited 13/Mar/2013.
[23] T. Nicolai, E. Yoneki, N. Behrens, and H. Kenn. Exploring Social Context with the Wireless Rope. In
OTM, 2006.
[24] G. Palla, I. Derényi, I. Farkas, and T. Vicsek. Uncovering the Overlapping Community Structure of Complex Networks in Nature and Society. Nature, 435, 2005.
[25] Qualcomm AllJoin.
https://developer.qualcomm.com/develop/ mobile-technologies/peer-peer-alljoyn, Last visited 13/Mar/2013.
[26] SFR Carte Wifi. http://cartewifi.sfr.fr, Last visited 13/Mar/2013.
[27] P. Traynor, K. Butler, W. Enck, P. McDaniel, and K. Borders. Malnets: Large-Scale Malicious Networks via Compromised Wireless Access Points. Security and
Communication Networks, 3(2):102–113, 2010.
[28] E. Yoneki, D. Greenfield, and J. Crowcroft. Dynamics of Inter-Meeting Time in Human Contact Networks. In Proc. Int. Conf. on Adv. in Soc. Net. Analysis and