HAL Id: hal-02394536
https://hal.archives-ouvertes.fr/hal-02394536
Preprint submitted on 4 Dec 2019
HAL is a multi-disciplinary open access
archive for the deposit and dissemination of sci-entific research documents, whether they are pub-lished or not. The documents may come from teaching and research institutions in France or abroad, or from public or private research centers.
L’archive ouverte pluridisciplinaire HAL, est destinée au dépôt et à la diffusion de documents scientifiques de niveau recherche, publiés ou non, émanant des établissements d’enseignement et de recherche français ou étrangers, des laboratoires publics ou privés.
The role of an Environmental Goods Agreement in the
quest to improve the regime complex for climate change
Jaime de Melo, Jean-Marc Solleder
To cite this version:
Jaime de Melo, Jean-Marc Solleder. The role of an Environmental Goods Agreement in the quest to improve the regime complex for climate change. 2019. �hal-02394536�
fondation pour les études et recherches sur le développement international
LA FERDI EST UNE FOND
ATION REC ONNUE D ’UTILITÉ PUBLIQUE . ELLE ME T EN ŒUVRE A VEC L ’IDDRI L ’INITIA TIVE POUR LE DÉ VEL OPPEMENT E
T LA GOUVERNANCE MONDIALE (IDGM).
ELLE C
OORDONNE LE LABEX IDGM+ QUI L
’ASSOCIE A U CERDI E T À L ’IDDRI. CE TTE PUBLIC ATION A BÉNÉFICIÉ D ’UNE AIDE DE L ’É TA T FR ANC AIS GÉRÉE P AR L ’ANR A U TITRE DU PR OGR A MME «INVESTISSEMENT S D ’A VENIR» POR
TANT LA RÉFÉRENCE «ANR-10-LABX
-14-01».
The role of an Environmental
Goods Agreement in the quest
to improve the regime complex
for climate change
Jaime de Melo
Jean-Marc Solleder
Abstract
The environment-trade nexus requires action. Environmentalists have claimed that the interests of the trade community, as represented at the WTO, would trump environmental concerns while trade specialists have claimed that an open trading system is key to meet the environmental challenge facing us. After a decade-long negotiation at the WTO on the reduction of tariffs on environmental goods (EGs) failed to produce an agreement, in 2014 a group of 14 countries entered plurilateral negotiations aiming for an Environmental Goods Agreement (EGA) that would have substantially reduced or eliminated tariffs on a long list of EGs. This also failed. This paper discusses the hurdles faced by these negotiations, the resulting stalemate, and avenues for reviving the negotiations. We argue that conclusion of the EGA negotiations under the current narrow agenda would help build trust to go further but would produce only very modest gains. Extending the agenda to include non-tariff barriers (NTBs) and environmental services remains the acid test for an EGA to address meaningfully the climate-change challenge.
Key words: Environmental Goods; WTO; Climate Change. JEL Classification: F18, Q56
.
Jean-Marc Solleder, Teaching and Research Assistant at University of Geneva. Jaime de Melo, Scientific Director at FERDI and Emeritus Professor at the University of Geneva.
Dev
elopment Po
lic
ie
s
W
ork
ing Paper
255
September 2019The role of an Environmental Goods Agreement in the quest to improve the regime
complex for climate change *
Jaime de Melo
∆Jean-Marc Solleder◊
Abstract
The environment-trade nexus requires action. Environmentalists have claimed that the interests of the trade community, as represented at the WTO, would trump environmental concerns while trade specialists have claimed that an open trading system is key to meet the environmental challenge facing us. After a decade-long negotiation at the WTO on the reduction of tariffs on environmental goods (EGs) failed to produce an agreement, in 2014 a group of 14 countries entered plurilateral negotiations aiming for an Environmental Goods Agreement (EGA) that would have substantially reduced or eliminated tariffs on a long list of EGs. This also failed. This paper discusses the hurdles faced by these negotiations, the resulting stalemate, and avenues for reviving the negotiations. We argue that conclusion of the EGA negotiations under the current narrow agenda would help build trust to go further but would produce only very modest gains. Extending the agenda to include non-tariff barriers (NTBs) and environmental services remains the acid test for an EGA to address meaningfully the climate-change challenge.
JEL categories
F18, Q56
Keywords
Environmental Goods; WTO; Climate Change
∆ : FERDI and University of Geneva ◊ : University of Geneva
* Melo acknowledges support from the French National Research Agency under program ANR-10-LABX-14-01. Solleder acknowledges support from the Global Governance Programme of the Robert Schuman Centre for Advanced Studies at the EUI. Both thank Ronald Steenblik for helpful comments and suggestions, Senior Fellow at the International Institute for Sustainable Development.
Introduction
Against a decade-long stalemate at the WTO to reduce barriers for trade in environmental goods (EGs) and environmental services (ESs) during the Doha negotiations, at the margin of the January 2014 Davos meetings, a group of 14 countries committed to pursue ‘global free trade’ in EGs. The joint statement reads that the group is to ‘…build on the ground-breaking [see below] commitment to reduce tariffs on the APEC [Asia-Pacific Economic Forum (APEC)] list of 54 Environmental Goods by the end of 2015 to achieve global free trade in Environmental goods’. This plurilateral agreement ‘…would take effect once a critical mass of WTO members participates….and we are committed to exploring a broad range of additional products’ (Davos 2014). This initial group (eventually extended to 18) included many APEC members plus Costa Rica, the EU, Norway, and Switzerland. Negotiations towards an Environmental Goods Agreement (EGA), launched at the WTO in July 2014, broke down in December 2016.
This paper puts this episode into perspective, taking as a point of departure the urgency to take action on the legal aspects of the environment-trade nexus. Why success at the EGA negotiations is important for climate, for the environment, and for the evolution of the climate and trade regimes is discussed next. Technical and economic difficulties encountered during the Doha Round are then recalled because they are instructive of the hurdles now faced under the EGA negotiations. An anatomy of the EGS lists proposed by negotiators shows that only crumbs are on the negotiating table. We then discuss possible next steps, from the least to the more ambitious. We start with steps to take on a tariff-only agenda ‘to declare victory’. The paper tackles necessary--but difficult to negotiate--extensions of the agenda to include non-tariff barriers (NTBs) and environmental services (ESs), touching upon a more ambitious sectoral approach in which trade policy could also serve to deter free-riding and encourage participation in the global-public-good challenge that climate change represents. The paper closes with concluding thoughts on reforms at the WTO that would help realign the world trading system to contribute meaningfully to the climate-change challenge.
1. The environment-trade nexus requires action
For a long time, the trade and environment regimes have been odd bedfellows as environmentalists have claimed that the interests of the trade community, as represented at the WTO, would trump environmentalists’ concerns while trade economists have argued that an open world trading system is essential for carrying out the Sustainable Development Agenda. Environmentalists have raised two concerns. First, globalization-induced increases in trade flows can magnify trade-embodied pollution, as discussed in the abundant ‘pollution haven’ literature (production of pollution-intensive goods relocates from countries with strict environmental regulations towards countries with weak environmental regulations). Second, improvements in technology make it increasingly easy to intensify the exploitation of natural resources, potentially exacerbating the depletion of natural capital, especially in the weak governance environment of many least-developed countries (LDCs) that contain a large part of the natural capital on Earth.
Two landmarks in the agenda on negotiations building the multinational global architecture recognize that trade and the state of the environment are intertwined and that this architecture must be extended to include the environment (including climate) regime.1 The first landmark was the launch of
the Doha Round, which explicitly recognized that environmental concerns would be fully taken into account during the round (it was dubbed the round for the “developing countries and for the protection
1
The growing physical interactions between countries are not recognized in the multinational global architecture IMF-WB-WTO (Whalley 2011). Stern (2007) presents the case to create a new institution—A World Climate Organization--to recognize the growing importance of physical linkages between countries.
of the environment”) to address the fears that the gains from growth and globalization could be undermined by their environmental side-effects. The second landmark was the adoption of the Sustainable Development Agenda (SDA) by the United Nations in 2015 (embraced by the G20 in 2016) and the Paris Accord of 2015. This agenda calls for taking action to combat climate change (Sustainable Development Goal (SDG) 13).
The Doha negotiations went nowhere. So far, the only progress on the reduction of barriers to trade in EGs has been the agreement among the 21 APEC members at an Asia-Pacific Economic (APEC) Forum in Vladivostok in 2012 where they pledged, on a voluntary basis, that they would limit tariffs on a list of 54 EGs to a maximum of 5% by end 2015. All but two products on the list had already featured on lists submitted during the Doha Round negotiations, and APEC members accounted for 70% of world trade for the products on the list. Virtually all goods on the list are goods for pollution prevention (sometimes called goods for environmental management). In some cases (e.g. natural-gas related technologies) the environmental credentials of the goods have been challenged. In other cases (e.g. non-wind powered generators and alternating generators) the products can be combined with either renewable or fossil-energy sources so they face what is often called ‘the dual-use problem’. Few products that inflict less damage to the environment in their production, use or disposal, were considered. In spite of these shortcomings, and the fact that the overall average simple average tariff on the 54 goods was 2.6%, the APEC agreement has been considered a success. It has been said that the voluntary non-binding nature of APEC decisions could have encouraged members to be bolder than they would have been at the WTO in maintaining these lower tariff levels. Also, unlike other regional trade agreements (RTAs), the benefits of the APEC outcome have been extended to non-participating WTO economies on an MFN basis, such as the EU.
Since December 2016, the EGA negotiations launched in July 2014 under the auspices of the WTO by a group of 14 (later expanded to 18) economies are stalled. The EGA negotiations also only cover tariffs. Non-tariff barriers (NTBs) are not on the agenda. Neither are barriers to trade in environmental services. Environmental services are highly complementary with trade in EGs, especially for developing countries for whom ESs are bundled with EGs in environmental projects.2
For a decade now, observers have been warning about a legal collision between trade and environment ‘rules’ (especially those relating to climate change) at the nexus between trade and climate (trade measures affect the environment and the environment affects trade) could be on its way (see e.g. Brainard and Sorkin eds. (2009)). It will intensify as evidence of environmental damages grows. Therefore, the WTO and the UNFCCC must move towards more affirmative actions. Concluding a meaningful outcome of the EGA negotiations figures among the four areas singled out by Bacchus (2018) as priority for action.3
2. Why success at the EGA negotiations is important
As shown below, few countries have participated in the EGA negotiations, and there is very little on the negotiating table because of a narrow agenda covering only reductions in bound tariffs. Yet, a successful EGA outcome important for the world trading system at a time when multilateralism is under increasing threat.4
2
Steenblik et al. (2006a) discuss the complementarities between trade in EGs and trade in ESs. They provide evidence from several case studies showing benefits for developing countries of a simultaneous liberalisation of trade in EGs and ESs.
3 The other areas identified by Bacchus are: (i) clarifying the uncertainty over the legal status of border tax adjustments;
(ii) establishing rules to facilitate carbon markets and climate clubs; (iii) introduction of disciplines on fossil fuels subsidies; (iv) legalising renewable energy and other green subsidies. Esty (1994) gave an early warning of the upcoming collision and Mavroidis and Melo (2015) an update of measures needed to help avoid collision.
4 Melo and Solleder (2018a) elaborate on why a successful conclusion to the EGA negotiations is important for co-existence
First, as a plurilateral agreement (PA), if a ‘critical mass’ is achieved (usually between 85% and 90% of trade in the products covered), if there is no objection by other WTO members, the tariff reductions would be extended to all WTO members so that, like the Information Technology Agreement (ITA), the result would be, effectively, a global treaty, even though not all countries would have exchanged concessions. With the world moving towards variable geometry, an issue-specific PA offers advantages over a preferential trade area (PTA) as it avoids the linkage issue (Hoekman 2013) and is open to newcomers wishing to join in the negotiations. If the critical mass is not reached, there would still be progress as was the case with the Government Procurement agreement. In the current atmosphere where the viability of the multilateral trading system enshrined in the WTO is increasingly challenged, a plurilateral success would be a shot in the arm. The plurilateral approach would be an alternative to the multilateral and regional approaches to reach a negotiated agreement that would slash tariff barriers on green goods. A successful EGA would also be a step towards reconciling trade and environmentalists’ concerns.
Second, if one takes a ‘value chain’ perspective that recognizes that goods cross borders multiple times, low tariffs will have a cumulative effect so a zero tariff is still the desirable goal. Moreover, benefits to consumers should not be ignored. As an example, using household expenditure surveys for the United States, Mahlstein and McDaniel (2017) estimate that lower prices on EGs would give a household saving of USD 485 million a year, disproportionately benefitting lower-income households. Switching to more energy-efficient light bulbs would save 238 million kilowatt hours, equivalent to 120% of the GHG emissions from coal in the state of Maine.
Third, an EGA would satisfy the monitoring, reporting and verification (MRV) criterion of the UNFCC, which is still eluding implementation of the Paris Agreement on climate Change. This is because the pledges on tariff reductions are easily verified through the national treatment and non-discrimination principles at the GATT that apply to all WTO members.
Fourth, a success would have a much needed demonstration effect. Success would give support to those who argue that an issue-specific ‘club approach’ to climate (and environmental) negotiations would be a promising route to build a sustainable climate and environmental architecture.
Fifth, if the experience of the ITA and of the Montreal Protocol Treaty repeats itself, momentum would be garnered for follow-up action. The original Montreal Protocol Treaty (1987) phasing out the production and consumption of ozone-depleting substances has been expanded several times, initially by increasing ambition, and lately by covering other gases.5 One could hope that an initial success at the
current EGA negotiations might follow the same path. In a first step, negotiations would be on the APEC list, perhaps over ‘nuisance’ tariffs. In a second step, the list could be expanded and mechanisms for updating the list of EGs (i.e. setting up a ‘living list’) would be put in place. Later on, negotiators could tackle the removal of NTBs once these have been distinguished from Non-tariff Measures (NTMs) (see below).
Sixth, an EGA would be an ‘issue-based’ (as opposed to the current ‘country-based’) WTO plurilaterals. Since it is often said that the WTO has to move towards ‘issue-based’ plurilaterals to deliver on the SDGs, the EGA would then serve as a benchmark for other agreements among a subset of WTO members.
3. Hurdles during the Doha Round and EGA negotiations
From the start of the Doha Round multilateral trade negotiations, once NTBs and barriers to trade in environmental services were excluded from the agenda (they were covered in discussions on liberalizing
5
The Montreal Protocol initially called for reducing the production and use of chlorofluorocarbons (CFCs), then for their complete elimination. Since the Kigali amendment of 2016, the protocol now covers a phased reduction of hydrochlorofluorocarbons (HFCs), another potent emitter of GHGs.
trade in services), WTO members could not agree on the approach to follow (project, request and offer, or list). Disagreements prevailed when a group of 13 high-income WTO members decided to pursue negotiations on the basis of submissions of lists of EGs. When high-income countries submitted lists, most developing countries refrained from participating. First, they feared that goods in which they had a comparative advantage —so-called ‘environmentally preferable products’ (EPPs) — if they were to be included in the final lists would in some cases necessitate differentiation among ‘like’ products. Such a distinction would face opposition at the WTO.6 Developing countries also feared that they would face
large disruptions as a result of trade liberalization on the import side, but not on the export side. Following several preliminary rounds of submissions, six lists with little product overlap were retained. This in itself is not an obstacle to progress since countries could have agreed to recognize each other’s lists (i.e. the combined WTO list of 411 products). But they did not as some countries resisted approving the lists, so when the EGA negotiations were announced, signatories decided that negotiations would also be by a list with, as a starting point, the APEC (54) (numbers in parenthesis next to the lists refer to the number of HS-6 level products in the list) list that had obtained approval across the 21 APEC members. The APEC list covers almost exclusively goods for environmental management that, at the current level of product differentiation at the WTO (HS-6 level) are not distinguished by end use (e.g. pipes for sewage versus pipes for carrying fuels). As stated in the introductory paragraph, the aim of the negotiations was then be to expand the EGA’s coverage to the WTO (411) list and beyond.
Technical difficulties and lack of commitment
Observers have noted the inherent difficulties in defining EGs. A lack of commitment during the Doha negotiations towards preserving the environment and towards the developing countries (the Doha Round was dubbed the Round for the ‘Developing Countries and for the Environment’) has also been evident. Goods in which developing countries have a comparative advantage rarely made it on the lists.7 As
shown later on, this lack of commitment carried over to the negotiations on the EGA.
Difficulties in obtaining a consensus about ‘environmental goods’ was evident through the successive rounds of submissions. Overlap across lists was minimal, an indication of the diverging perceptions. Taking the WTO(411) compendium of submissions as an indicator, not a single product appeared on all lists, only seven products were common to four lists, and more than two-thirds of the products appeared on only one list. Divergence in perceptions also carried over in the description of the environmental function to be carried out by products on the lists.8
Unilateral tariff reductions would have helped, but the evolution of average tariff levels across EG lists indicates a lack of commitment to reduce tariff barriers in that way. Balineau and Melo (2013) document this lack of progress. First, over the period 1996-2010, no acceleration in the reduction of tariffs on EGs was observed since the launch of the negotiations in 2001. This was the case across all
6 Developing countries have a comparative advantage in EPPs. These products cause less harm to the environment at all
stages (production, use, disposal). Taking the EPP list proposed by Tothova (2006), Melo and Solleder (2018 figure 2) show that low and lower-middle income countries have a higher share of products with a revealed comparative advantage (RCA>1) on this list than upper-middle and high-income countries.
7 Paragraph 31(iii) of the Doha ministerial decisions of November 2001 states that negotiations would cover the ‘reduction
or, as appropriate, elimination of tariff barriers to environmental goods and services’. Steenblik (2003; 2005), Balineau and Melo (2013), and Bucher et al. (2014) discuss the technical difficulties in defining EGs. Melo and Vijil (2016) discuss difficulties in defining ESs and in measuring trade restrictions in ESs. Cosbey (2015) discusses difficulties in establishing a ‘living list’ by which EGs would be added and subtracted from the list.
8
Next to each selected product on their respective lists, countries were asked to choose one (or several) among six categories of categories of environmental goods (air pollution control, renewable energy, carbon capture and storage, water management and treatment, environmental energy, other). Balineau and Melo (table 1) report on selections for a ‘core list’ of 26 products show a great divergence in selected categories across submitters, an indication that countries had different visions of how EGs should be defined: by specification (type of good) or by criteria (persistent pollution) .
income groups, and the gap in average tariffs between the EG and non-EG lists remained unchanged. For many OECD countries with low, but non-zero “nuisance” tariffs, keeping these tariffs was a useful concession to have in hand for future FTA negotiations. Second, for high-income countries, average applied MFN tariffs on EGs stood at 5% so, taking the perspective of negotiators, their perceived gains from participation would be from reductions by developing countries (for low-income countries average tariffs stood at 12% by 2010). Third, in a standstill compromise, whereby tariffs would have stood at applied rather than at bound levels, the loss of flexibility in tariff-setting would have fallen mostly on low-income countries.
Mercantilist behaviour by negotiators
Most importantly, as expected from lists drawn up by negotiators, mercantilist behaviour was apparent across the several rounds of submissions. Negotiators generally included in their lists goods in which their country had a revealed comparative advantage (RCAi>1) while they systematically excluded from
their lists, goods with high tariffs.9 If negotiators had taken on board the mandate of reducing barriers
to trade in EGs, they would not have excluded systematically from their lists EGs with high tariffs. Balineau and Melo report results from probit estimates for the WTO list of EGs showing that submitters usually selected goods with RCA values higher than those not on the list. This selection is not incompatible with the objective of reducing barriers to trade in EGs. However, all countries systematically excluded goods from the WTO list with high tariffs. This systematic exclusion of goods with high tariffs contradicted the objectives of the Doha mandate.
4. Anatomy of the stalled negotiations at the EGA
The above remarks on the behaviour of negotiators at the Doha negotiations apply also for the EGA negotiations initiated in July 2014. Negotiators got close to, but ultimately failed to agree on an extension of the APEC (54) list. Until December 2016 when negotiations were put to rest, negotiators wrangled over the time frame for elimination of tariffs and over extensions to the APEC list. Because the proposed text circulated to negotiators allowed for delays and exceptions, China requested (and was denied) the possibility of maintaining a tariff of 5% on 11 tariff lines. China also requested a delay for removing tariffs as a developing country member. On the extensions side, bicycles and parts that have tariffs 9.7% in the US and 14.6% in the EU were proposed for inclusion by China but their inclusion was opposed by the EU. Bicycles is an interesting case because, unlike different types of products subject to technical change justifying their addition or removal from an EG list (e.g. incandescent vs. led light bulbs), regardless of technical progress, bicycles are an obvious environmentally preferable product. By any criterion, bicycles would always remain on a living list of EGs.10 Bicycles emit no GHGs and have
co-benefits by improving health indicators (
here
).Also, at the time when negotiations were suspended, countries had not dealt with the possibility of defining products at the national tariff line (NTL) level, where environmental goods could be better distinguished than at the HS6 level. Nor had the modalities of importation (such as certificates of use) for goods with multiple end-use been discussed. Likewise, modalities for the functioning of the Agreement (revision of the list, membership access for newcomers) had not been discussed. In sum, discussions revolved essentially on the goods that would enter the EG list.
9 An RCA value for a product above (below) 1 indicates a comparative advantage (disadvantage) for the good. For example,
China has a revealed comparative in bicycles (HS 871200) because its share in the world trade of bicycles (about 20% in 2014) is greater than its overall share in world trade (about 7%). China’s RCA for bicycles is RCA=0.2/0.07=2.8. A tariff peak is a tariff that exceeds three times the country’s average tariff.
10 Bicycles are not on the EPP list. (Which EPP list? They certainly were on the Tothova list.) To avoid any misinterpretation,
To reflect the range of divergence across negotiators on products to enter EG lists, tariffs are reported for three lists: Two lists, the APEC (54) and the WTO (411) lists are representative of the interests of the developed countries that submitted lists during the Doha negotiations. These lists focus almost exclusively on pollution prevention goods (i.e. environmental remediation technologies and natural resource management technologies). The third list of environmentally preferable products (EPP (106)) taken from a list developed by the OECD (Tothova, 2006), itself inspired by earlier work carried out by UNCTAD (reference). This list includes mostly goods that cause less environmental damage in their production, end use or disposal. The EPP list would be more representative of the interests of developing countries that have not participated in the submission of lists. A fourth, for comparison, the ALL list, is the universe of all HS6 level goods. Since production, use and disposal of any product has an impact on the environment, this list would be the most ambitious list EGA negotiators might envisage as point of departure for negotiations that would then take a negative (rather than the current positive) list approach.11
Crumbs on the table
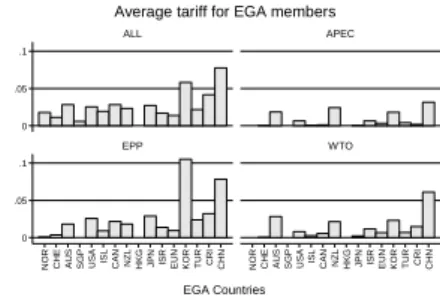
Figure 1 compares average applied bilateral tariffs for 17 of the 18 negotiating countries (data for Chinese Taipei are missing)) for these four lists. Note that the comparisons in figure 1 are for simple average applied bilateral tariffs for each list. Since all negotiating countries are members to preferential trade agreements, bilateral applied (rather than MFN applied) tariffs is the more relevant indicator of required adjustment efforts from an elimination of tariffs. The data presented in descending order of per capita GDP (at PPP exchange rates for 2014) for all lists confirms higher averages for lower income countries. Among EGA negotiators, all are OECD members except for Turkey, Costa Rica and China.
Figure 1. Average Applied Bilateral tariffs of EGA countries
Source: WITS. Data for 2015.
Notes: Simple average applied tariffs in percent. The ALL list includes all HS6 level products
11 Many other lists have been proposed during the Doha and EGA negotiations. Short of delegating this task to a committee
of scientific experts (see below), one could add the WTO and EPP lists. To save space, this option is not pursued here. 0 .05 .1 0 .05 .1 N O R C H E A U S S G P U S A IS L C A N N Z L H K G J P N IS R E U N K O R T U R C R I C H N N O R C H E A U S S G P U S A IS L C A N N Z L H K G J P N IS R E U N K O R T U R C R I C H N ALL APEC EPP WTO B ila te ra l ta ri ff EGA Countries Average tariff for EGA members
Several patterns appear in figure 1. First, for both the APEC and WTO lists, 6 of the 17 countries, Norway, Singapore, Hong-Kong, Switzerland, Japan, Iceland, have zero or quasi-zero bilateral tariffs. On the APEC list, only New Zealand and Korea have an average tariff of 2% and China of 4%. Second, for all countries, average tariffs are lower for the APEC and WTO lists than for the ALL list. This reflects the product composition of these lists. Most goods on these lists are intermediate products that face counter-lobbying by downstream producers using these goods as inputs. This pattern also hints at the political economy trade-offs facing negotiators. Upstream producers (e.g. producers of electric motors) want protection and downstream producers (e.g. vehicle producers) want zero tariffs on producers of energy-efficient of electric motors. Third, for all lists in figure 1, China is the country with the highest average bilateral tariff, slightly above 5% for all lists except the APEC list.
Including the EPP list as a possibility for negotiation shows that average applied tariffs are highest for this list. Broadly interpreted, this pattern shows that high-income countries protect this category of environmental goods more than for other categories. Had a larger group, including more developing countries, participated in the negotiations via submission of lists, welfare gains from tariff reductions would have been greater (welfare gains from tariff reductions increase more than proportionately with the tariff so the higher the tariff, the larger are the marginal gains). Also, this is a hint that disagreements would have been more widespread.
Reductions in tariffs are from GATT-bound levels, but these are close to the applied MFN tariffs reported in table 1.12 The simple average tariffs in cols. 1-4 are very close in magnitude to the applied
bilateral tariffs in figure 1. For all lists, trade-weighted average tariffs (not reported here) are less than simple averages (see averages at bottom of table 1).13 Taking into account membership in Regional
Trade Agreements (RTAs) has little effect on the overall landscape.
As a first indicator on their dashboard, negotiators are likely to take a close look at goods with ‘tariff peaks’ (i.e. goods with a tariff that exceeds three times the average applied MFN tariff). Across all lists, the percentage of tariff peaks is low, only exceeding 10% for Korea for the EPP list (cols. 5-8). This low percentage, is a reflection of the success of the formula-based multilateral tariff reductions that have applied larger percentage cuts for high tariffs, which are the most distortionary.
Mindful that these lists do not represent agreement among negotiators, two other indicators complete the anatomy of products in these lists: the number of ‘nuisance tariffs’ defined as tariffs of less than 3%, and the number of ‘exchange tariffs’ defined as tariffs above 10%, a threshold of an economically worthwhile bargain (counting tariff peaks when the average tariff is across the sample is 1.2% is not informative). Figure 2 reports the results of this count for the EPP and WTO lists (the APEC list is omitted for lack of tariffs for ‘exchange’). With the combination of a high number of nuisance tariffs and very few tariff peaks, only crumbs made it to the negotiating table.
12
Except for low-income countries and a few middle-income countries, applied tariffs are close to bound tariffs. See Balineau and Melo (2013, figure 3).
13
Displaying simple (rather than trade-weighted) applied tariffs avoids underestimating the importance of tariffs in the eyes of negotiators who are unlikely to have applied bilateral tariffs in hand, were they to be concerned about the magnitude of the expected adjustment from a reduction in tariffs.
Table 1: Applied MFN Tariffs and peak tariffs (in percent)
Source: WITS. Data for 2015
Notes: Figures rounded to one digit after the decimal
EG lists in columns: APEC (54); EPP(106); WTO(410); ALL is all HS6 tariffs a Share of products with tariff simple average tariff > 3 times simple average tariff b. Corresponding trade-weighted average in parenthesis
Simple average
Percentage of peak tariffs
aAll
APEC
EPP
WTO
All APEC EPP WTO
Country
(1)
(2)
(3)
(4)
(5)
(6)
(7)
(8)
AUS
2.8
1.9
1.8
2.8
0.2
0
0
1.9
CAN
2.8
0.1
2.2
0.6
3.6
5.7
7.8
9.0
CHE
1.1
0
0.4
0
1.6
0
2.2
0
CHN
7.8
3.1
7.9
6.1
2.4
1.9
0
6.4
CRI
4.2
0.2
3.2
1.5
1.4
5.7
0
12.5
EUN
1.4
0.3
1.0
0.7
0.9
0
0
0
HKG
0
0
0
0
0
0
0
0
ISL
1.9
0.1
0.9
0.3
3.8
9.4
2.2
9.8
ISR
1.7
0.7
1.4
1.2
4.8
5.7
7.8
0.8
JPN
2.7
0
2.9
0.2
3.2
1.9
1.1
2.4
KOR
5.8
1.8
10.5
2.3
2.3
0
2.2
0
NOR
1.8
0
0.1
0
4.1
0
3.3
0
NZL
2.3
2.4
1.8
2.1
4.4
0
5.6
0
SGP
0.6
0
0
0
0
0
0
0
TUR
2.2
0.4
2.4
0.7
6.9
0
2.2
0
USA
2.5
0.7
2.6
0.8
5.7
0
8.9
1.9
Average
b2.6(1.7) 0.7(0.7) 2.4(1.8) 1.2(1.5)
2.8
1.9
2.7
2.8
Figure 2: Count of Nuisance (<3%) and Exchange (>10%) Tariffs by EG list * Figure 2a: WTO (376 HS-1992) list
2b: EPP list (90 HS-1992)
* Applied bilateral tariffs. Total number of products on vertical axis. Dashed lines at 100% and 50% of the total number of products on the list after conversion to HS-1992. Number of goods in the list in parenthesis next to the HS). See text for source of lists.
The count of nuisance tariffs for the WTO list (figure 2a) shows that, except for China and Korea, all countries have over 50% in the ‘nuisance’ range, and 10 more have almost all their tariffs in the nuisance range. By this criterion, only China, and to a lesser extent Costa Rica, have economically meaningful concessions to offer. Interestingly, the pattern is quite similar for the EPP list even though Korea and the United States could find it worthwhile to enter into an exchange of market access with China.
One interpretation of these low tariff averages and few high peaks is that negotiators have again been successful in their mercantilist tactics: making up lists as a political exercise in which countries select
goods in which they have particular interests and others agree in return for their own suggestions being accepted. Occasionally, as in the case of bicycles, there is a clash and the good does not make it onto the collective list. A second is to remark that the foundations for a successful negotiation were not laid down: given the stalemate in the Doha Round negotiations, countries should have requested from negotiators a statement of purpose of the EGA. Then negotiators should have been instructed to entrust the choice of approach to a committee of experts (more on this below).14 A third is to look into the
patterns of comparative advantage in EGs as an explanation of the non-participation by developing countries.
The non-participation by developing countries
Countries participate in negotiations when they anticipate benefits. Since the announcement by the 14 countries to start the EGA negotiations from the APEC list, developing countries knew from the stalemate in the Doha Round that not much market access for their products could be expected even if the list were to be expanded to the WTO list.15 A second reason could be the loss of tariff revenues in
situations wherein trade taxes are a non-negligible source of government revenue and they experience a large increase in imports. Using HS6-level price import demand elasticities, Melo and Solleder (2018) estimate that a removal of tariffs for the EG and EPP lists would increase imports of low-income countries on average by, respectively, 15% and 12%. The corresponding estimates for high-income countries are 1% and 2%. A third reason is the small demand for EGs in these economies. This is because the demand for environmental quality, and hence for EGs rises with per capita income.16 Low-income
countries having few environmental regulations, their markets for EGs will de facto be small.
Relatedly, economies with large home markets produce a greater variety of products. The price indexes for these products is then lower so countries with large markets should be low-cost producers of EGs and hence, have a comparative advantage in these products (a distribution of indices of product complexity shows that EGs are more complex than other manufactures).17
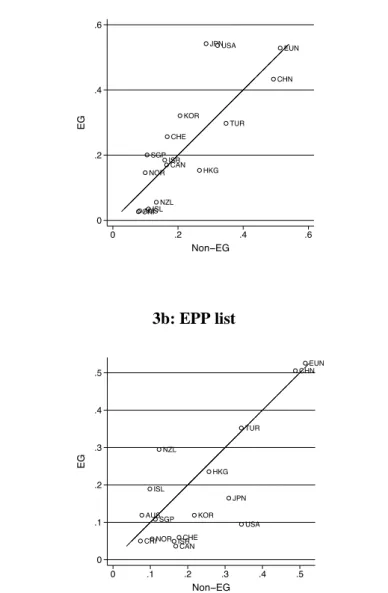
Figure 3 plots average RCA values for the WTO-411 and EPP EG lists on the vertical axis against the corresponding average value for all remaining non-EG goods on the horizontal axis. If one takes an RCA value above the 45° line as an indication of success at negotiation in the submission process in the Doha Round, a comparison of the WTO and EPP lists confirms that submitters fared well. The scatter plot of RCA values for the EPP list shows that if the emphasis were on products that do less environmental damage in production, use and disposal, Doha Round submitters would not have fared as well.
14 Among others, the committee of experts would have considered adopting a living list with criteria for listing and delisting
goods. Controversial proposals could then be decided by a 2/3 majority as under the Convention on International Trade in Endangered Species (CITES). See Cosbey (2015) for further discussion and the difficulties of dealing with delisting.
15
Average MFN tariffs among EGA countries are 1.3% for APEC list and 2.2% for WTO list.
16
Barbier et al. (2017) give evidence that the income elasticity of willingness to pay for eutrophication in the Baltic sea increases with income.
17 A comparison of the distribution of an index of product complexity for EGs and non-EGs shows greater complexity for
Figure 3: Revealed Comparative Advantage (RCA): EGs vs. non-EGs by EGA member (2014)*
3a: WTO list
3b: EPP list
* Notes. Country averages. Points above (below) the 450 indicate a comparative advantage (disadvantage) for EG goods. Higher values correspond to a larger basket of goods with high RCA values
The formula for Revealed comparative advantage for country i of product j is: 𝑅𝐶𝐴𝑖𝑗=
𝐸𝑖𝑗 ∑ 𝐸𝑖𝑡𝑡
𝐸𝑛𝑗 ∑ 𝐸𝑛𝑡𝑡
𝐸𝑖𝑗is the exports of product j from country i
∑ 𝐸𝑡 𝑖𝑡 exports of all products from country i
𝐸𝑛𝑗 world exports of product j
∑ 𝐸𝑡 𝑛𝑡 total world exports
The RCA for country i is the average over all j=1,…,K products exported by i is 𝑅𝐶𝐴𝑖 = 1
𝐾∑ 𝑅𝐶𝐴𝑖 𝑗 𝐾
Several patterns stand out. First, in comparison with large countries (e.g. China, the EU, Japan and the United States), small economies (e.g. NZL) have low RCA values for both EGs and non-EGs and for both lists. This is an indication of the larger diversity in the production structures of large economies. Second, China and Turkey, which did submit lists of proposed EGs in the period leading up to the publication of the WTO list, have greater comparative advantage on the EPP list. Third, Japan and the US would not fare as well if EGs were selected from the EPP list. In sum, since giving preferable treatment to EPPs is important for mitigation efforts, the issue of likeness at the WTO will need to be raised at the WTO.18
An important reason for non-participation by developing countries is their disappointment with the Technology Mechanism established in 2010 (as an application of article 4.5 of the UNFCCC adopted in 1992 that called for engagement by developed countries to transfer technology to developing countries). The Technology Mechanism was a key condition imposed by developing countries to agree to the breakdown of the firewall between Annex 1 and non-Annex 1 countries established at the Kyoto Protocol. This breakdown amounted to an engagement by developing countries to submit Intended Nationally Determined Contributions. Technology transfer in the broad sense (including hardware, software and ‘orgware’) is to develop credible mechanisms to allow developing countries to catch up technologically. Only then would developing countries be able to develop a strategy for participating in the value chains for renewable energy, electric vehicles, CO2 capture installations and other
environmental goods. Mastery of technology would allow developing countries to become suppliers and develop a comparative advantage as China has managed to do so for solar PV. However, adoption of the Technology Mechanism was not accompanied by a commitment for funding, nor by financial transfers (Coninck and Bhasin 2015).
In conclusion, along with China, Costa Rica is the only developing country that has participated in the EGA to date. Unlike China, Costa Rica’s comparative advantage is for a narrow range of goods for both EGs and non-EGs so participation was not guided by the objective of getting market access for exports. Rather, participation was part of Costa Rica’s commitment to put the economy on a green industrialization track. Thus, in 2008, while all other developing countries were opposing participation in a climate agreement, Costa Rica announced its objective to become carbon neutral by 2021. At the COP21, unlike most signatories, Costa Rica selected an absolute CO2 reduction target. By 2015, only
1.05% of its electricity was generated using fossil fuels (Araya 2016, p. 14)). Also, Climate Tracker (2015) selected Costa Rica among the four countries with a satisfactory target in relation to the Paris Agreement objectives.
5. Next steps to revive the negotiations
Since the EGA negotiations broke down in December 2016 in haggling over offensive and defensive interests (here), several participating countries have kept claiming that they are keen to reach a deal, but they have been in a stand-by mode, waiting to see what the US position would be. Japan, who co-sponsored a symposium in Beijing in 2017 is the exception (here). No other initiatives have been tabled. Below are two options to revive the negotiations, one to eliminate nuisance tariffs and a way to declare victory, the other to make progress by what would amount to an exchange of concessions by negotiating parties. This latter approach would call for including high-tariff goods on the EG list for tariff elimination. This more ambitious option might start addressing the climate challenge. It would also require more cooperation from negotiators.
18
If a label is used to identify an EPP, likeness can no longer be a matter of case law, as in 20XX the Appellate Body ruled that it is up to consumers to decide whether a regulatory distinction that creates submarkets is legitimate. Likeness has to be a matter of policy. See the discussion of the Chile-Alcoholic Beverages case in Mavroidis and Melo (2015).
Eliminate nuisance tariffs
With the exception of China, the tariff patterns in figure 2 reveal generally very low tariff levels with a few high tariffs that would be suitable for an exchange of market access. In a first step, agreeing on a list of ‘nuisance tariffs’ for elimination could be reached. Since nuisance tariffs would not be the same for all EGA members, this would still require some horse trading, although as under the early GATT negotiations, some participants might still oppose their elimination.19
Expected gains would, however, be negligible and far from reaching a ‘critical mass’. Gains for the environment and for development would still be negligible even if agreement were also reached on a standstill for other non-nuisance tariffs on the list since most countries have a small gap to close between applied and bound rates.
Include high energy-efficiency and high-tariff products on the EG List
Fortunately, changes in the latest update of the HS nomenclature (now HS-2017) make it easier to add products to EG lists because several can now be easily distinguished in terms of their energy performance. Composite LED light bulbs (but not the individual light-emitting diodes) are now distinguished from incandescent light bulbs. Three categories of automobiles are now included in the HS.20 Inclusion of the LED category makes it easier for the many countries that have already banned the
import of incandescent light fixtures (LEDs emit about 30% less CO2 per watt than incandescent light
fixtures). For automobiles, the reduction in emissions from plug-in hybrids and all-electric cars will depend on the source fuels used to generate the electricity that recharges their batteries. In the case of automobiles, economies of scale and the network infrastructure for recharging or replacing batteries is compatible with old combustion engines and the inherited stock of cars; it is even more the case for LED lamps as replacements for incandescent light bulbs.21 The network characteristic for recharging
batteries will also make it easy to eventually exclude low-cost non-compliers from benefits as was the case with MARPOL as non-compliers were excluded from major ports.
Inclusion of high-tariff goods on the EG list is also important. In the absence of an environmental externality, the efficiency benefits from tariff reductions increase more than proportionately with the height of the tariff, hence it is desirable to include high-tariff goods on an EG list.22 If producing and
using the good generates a smaller negative environmental externality than the good it replaces, a tariff reduction on that EG will confer an extra welfare gain as a result of reducing the externality.23 To that
end, the best approach would be to use a negative list, taking the entire HS as point of departure. Then high-tariff goods would be included.
In this regard, it deserves mention that, until the passage to a formula-based approach to tariff reductions under the Kennedy Round (1964-67), bilateral exchange through the request-offer approach
19 During the Uruguay Round, the EEC strongly opposed the elimination of nuisance tariffs (3% or less) unless no
compensation or credit were claimed for such action. Hoda (2002, p.34).
20 Two examples of the new HS are separate HS-6 digit sub-headings for (a) LED lamps (HS 8539.90) and (b) hybrid-electric,
plug-in hybrid-electric, and all-electric vehicles. The previous category of other vehicles (8703.90) has been replaced by the following sub-categories: (8703.40) non-diesel hybrid-electric vehicles not capable of being charged by plugging into an external source of electric power; (8703.50) diesel hybrid-electric vehicles not capable of being charged by plugging into an external source of electric power; (8703.60) non-diesel plug-in hybrid-electric vehicles; (8703.70) diesel plug-in hybrid-electric vehicles; and (8703.80) other vehicles, with only electric motor for propulsion.
21 Average applied tariffs on automobiles in EGA countries range from 0% in Singapore, Norway, Japan, Hong Kong, and
Iceland to 24.7% in Chinese Taipei.
22
All formulas for across-the-board reduction in tariffs propose deeper cuts for high-tariff goods. The concertina method, which tackles high-tariff goods first, guarantees an improvement in welfare.
23 The principles of the theory of second-best call for eliminating the externality at source – that is, at the point of production
focussing on high-tariff goods was the norm under the GATT. At the time, average tariffs were still high (15%) and the number of participants small (around 20-30 until the Dillon Round in 1960) – similar to the number of participants in the EGA.24 For the request-offer approach to be worthwhile, tariffs should
be sufficiently high, perhaps 10% or more. This would require a larger list, perhaps starting from an aggregation of the WTO and EPP lists. The request-offer was proposed, but discarded, during the Doha Round negotiations, and also during the Uruguay Round by the United States.25 Perhaps it would have
greater success with the smaller number of participants under a revived EGA.
With negotiators at the helm, this approach remains unrealistic even among a small group of countries. Because of the reticence of negotiators to include goods with high-tariffs on their lists, acceptance of high-tariff goods would be more likely if, as discussed below, delegation of responsibility to an independent committee of experts were to take place. Such delegation, however, is not part of the institutional governance under the current WTO.
6. Moving on towards a meaningful EGA
For an EGA to deliver meaningful benefits to participants (beyond building trust via an elimination of nuisance tariffs) at the very least high-tariff goods must be included in the EG list. The behaviour of negotiators during the past fifteen years strongly suggests that they will be unable to cooperate to put up such a list. So a first step is to devolve the function of setting up a list to an independent scientific body, as has been the case in other environmental treaties. Such a body would also be necessary to revise goods on the EG list.26
Next, the agenda should be extended beyond tariffs. First, NTBs should be included. Second, the agenda should also tackle reduction of barriers on environment services. Barriers to trade in both are harder to identify, let alone evaluate their effects, but progress is still possible.
A third, more radical, approach is to shift away from the list approach towards a sectoral approach (some call it a ‘climate club’). This approach, which has worked for gases depleting the ozone layer, would be a more radical departure from current EGA negotiations. Just as the EGA was envisaged on the side-lines of a meeting in Davos in 2014, such an approach could conceivably be launched at another Davos meeting or at a G20 meeting. It would require commitment by major emitters, say the OECD countries plus China.
These extensions, however, would present, additional challenges for negotiators. NTBs, and barriers to trade in services, unlike tariffs, are not amenable to simple formulaic approaches to harmonization. If any new EGA attempts to tackle these simultaneously with tariffs, the negotiations could end up taking much, much longer, a reason for excluding them from the agenda. As to the sectoral approach, boundaries of the selected sector are not neatly circumscribed by distinct chapters of the HS (unlike, say, primary products of agriculture). A revision (or rather a construction) of an HS for negotiations on EGs would be required to move towards a meaningful EGA. 27
24 Bown and Irwin (2015) estimate that average tariffs stood at about 22% in 1947 and were around 15% at the start of the
Kennedy Round, levels appropriate for the request-offer approach.
25
During the Uruguay Round, the United States proposed the return to a request-offer approach because the linear reductions left little on the table and because “… modern data-processing techniques made it possible to conduct request-offer negotiations efficiently” (Hoda 2002, p.33).
26
Cosbey (2015) gives examples of environmental treaties in which decisions are made with the help of scientific committees and majority voting procedures. Amendments to CITES are from criteria on decline of population and the Stockholm Convention of list.
27 See Steenblik (2006) and Balineau and Melo (2013). Steenblik discusses challenges in improving HS descriptors through
Entrust an independent Committee of Experts
At best, negotiators represent the interests of producers and consumers, though usually it is producers’ interests that dominate, most often those of protected sectors where losses from tariff reductions are most concentrated. As documented above, mercantilist behaviour prevailed under the Doha and EGA negotiations. To overcome this situation, as argued by Cosbey (2015), negotiators should have started with a statement of purpose clarifying the “objective” of the EGA. Clarifying the purpose in a preamble or stating the purpose in the Articles of the Agreement could have been followed by the nomination of a commission of experts that would have been instructed to define EGs by some criterion to avoid the repetition of disagreements over the lists encountered during the Doha Round negotiations. However, if past nominations of commissions of experts is a guideline, commissions of experts are likely to be, once more, populated by negotiators.28
Include non-tariff barriers (NTBs)
Because applied tariffs are low among EGA countries, NTBs are viewed as the most important barriers to trade in EGs. NTBs are difficult to select from the large number of non-tariff measures (NTMs) that have been growing rapidly in number and in complexity as they often serve multiple purposes. NTMs fall under two categories: (i) those that give information on the characteristics of the product that are precautionary in their intent; and (ii) those that are protectionist in intent and referred to as NTBs. NTBs include contingent-protection measures, local-content requirements, anti-dumping duties (e.g., against solar photovoltaic cells and modules), and weak intellectual property regimes.29
Table 2 selects from among the NTMs applied to EGs those that are most likely to be protectionist in intent. Indices of potential NTBs displayed in table 2 give an indication of the potential importance of NTBs. Because the collection of this count is at the country level, indices are not comparable across countries. Nor can differences in the number of NTMs captured by the prevalence scores in table 2 be unequivocally interpreted as regulatory stringency as one particular form of NTMs could be much more stringent than several different NTMs combined at the same product. Prevalence scores are best viewed as a measure of the regulatory obligations faced by trade flows.
Three patterns stand out. First is the large count of potential NTBs for most countries, half in the group having high frequency and coverage ratios (scores of 1 in cols. 1-8). Second, frequency and coverage indices are generally higher for high-income countries, a reflection of the observation that the number of NTMs on products is positively correlated with measures of product quality, which increases with per capita income. Third, China is an exception. China has high scores for all indices, comparable to those for the EU and the US, potentially an indication of NTBs.
28 Coninck and Bhasin (2015) attribute the disappointing performance of the Technology Mechanism to a lack of resources
and to the setting up of a policy arm (the ‘Technology Expert Committee’) made up in majority of ‘… climate negotiators which hampers practical discussions and replicates the same deadlocks and differences that can be observed in the climate negotiations’ (p. 457).
29 Local content and contingent-protection measures were perceived by respondents as barriers to trade in a sample of 136
Table 2: Indicators of non-tariff barriers (NTBs)
Frequency Index
Coverage ratio
Prevalence score
EG List ALL APEC EPP WTO ALL APEC EPP WTO ALL APEC EPP WTO
Country
(1)
(2)
(3)
(4)
(5)
(6)
(7)
(8)
(9)
(10) (11)
(12)
AUS
1.0
1.0
1.0
1.0
1.0
1.0
1.0
1.0
14.1 12.9 15.0 15.7
CAN
0.0
0.0
0.0
0.1
0.1
0.1
0.0
0.2
0.1
0.1
0.0
0.2
CHN
0.6
0.7
0.8
0.7
0.8
0.5
1.0.
0.9
5.5
8.8
3.7 10.1
CRI
0.1
0.0
0.1
0.1
0.2
0.0
0.1
0.1
0.5
0
0.4
0.1
EUN
0.8
1.0
0.5
1.0
0.9
1.0
0.7
1.0
3.9
7.3
2.6
5.8
JPN
0.3
0.1
0.5
0.3
0.6
0.1
0.8
0.7
2.4
0.2
2.3
1.9
NZL
1.0
1.0
1.0
1.0
1.0
1.0
1.0
1.0
3.3
1.6
4.0
2.3
SGP
1.0
1.0
1.0
1.0
1.0
1.0
1.0
1.0
2.3
1.9
2.8
2.2
USA
1.0
1.0
1.0
1.0
1.0
1.0
1.0
1.0
6.9
6.9
7.6
8.0
Average 0.7
0.7
0.7
0.7
0.7
0.3
0.3
0.8
4.3
4.39
4.3
5.1
Notes:Includes countries in the UNCTAD-WTO NTM data base. Data for one year, mostly over the period 2003-4. Definition of NTM coverage at the country-level. EG lists in columns are those in table 1: APEC (54); EPP(106); WTO(410) and ALL is all HS6 tariffs.
NTBs reported in the table defined at the HS6 level are selected in two steps. First, an exhaustive list of NTMs was gathered by UNCTAD following the
MAST
classification. In a second step, Ederington and Ruta (2016) categorized NTMs into four groups: Consumer, Process, Products and Customs. Customs measures selected from this group were augmented by contingent trade-protection and local content measures. Indices in table 2 are from this augmented group. See Melo and Solleder (2018) for discussion.Indices computed at the HS6 level are country averages over lists.
Frequency index: 𝐹
𝑗=
∑𝐷𝑖𝑀𝑖∑𝑀𝑖
Occurrence of NTBs at HS6 level
Coverage Ratio: 𝐶
𝑗=
∑𝐷𝑖𝑉𝑖∑𝑉𝑖
; Percentage of trade covered by NTBs
Prevalence score: 𝑃
𝑗=
∑𝑁𝑖𝑀𝑖∑𝑀𝑖
Average number of NTBs in the list
where Mi is an indicator variable indicating whether good i is imported; 𝐷𝑖 indicates the presence of at
least one NTB on good i ; 𝑉𝑖 is the value of imports of good i ; 𝑁𝑖 is a count variable indicating the
number of NTBs on good i
Converting these count indices of NTMs at the HS6 level into estimates of the efficiency costs of NTBs require additional information on import demand elasticities at that level of disaggregation and that further assumptions about the determinants of import demand. Assuming that the count estimates of NTMs represent NTBs, Melo and Vijil (2016) give estimates of the efficiency costs of NTBs relative to tariffs for the APEC and WTO lists for the EGA negotiating countries. These estimates rely on estimating the ad-valorem equivalent of NTMs at the HS6 level. For the EGA negotiating group, they estimate that the average uniform protection from NTBs when combined with tariffs is 4 (APEC list) to 10 times (WTO list) greater than the average uniform protection from tariffs alone.30
30
These orders of magnitude estimated by Melo and Vijil (2016, table 1) for EGs at the HS6 level apply the import demand elasticity estimates of Kee et al. (2008) to the Ad-Valorem Equivalents (AVEs) estimates of Kee et al. (2009). These ‘bottom up’ estimates of AVEs are obtained as residuals of a structural trade model where only a few determinants of
These estimates are crude, at best orders of magnitude. If NTMs act as NTBs, especially when they are widespread as suggested by the indices in table 2, they also have informational content that help address market failures. Minimum Energy Performance Standards (MEPS) and labelling, mandatory and voluntary, help inform buyers and can reduce environmental damage. These MEPS vary greatly across countries which imposes costs associated with conformity assessments. In a comparison of emissions of GHGs across Regional Trade Agreements (RTAs) with and without environmental provisions, Bhagdadi et al. (2013) estimate that emissions of GHGs per capita are lower and converge only for RTAs with environmental provisions. This suggests that some form of regulatory convergence among EGA members could also be expected to improve environmental outcomes.
Regulatory convergence is also found to increase bilateral trade at a disaggregated HS6 level. Melo and Solleder (2018) estimate a gravity model of bilateral trade for the WTO and EPP lists for 2014 on a sample of 51 countries. For all estimations, after controlling for the standard determinants of bilateral trade (distance, common language, etc.), their estimates suggest that a reduction in tariffs would increase bilateral trade. Importantly, estimates also reveal that, controlling for tariffs, an increase in regulatory overlap following from regulatory harmonization would increase bilateral trade.
Then, rather than negotiate on an elimination of NTBs which are numerous and difficult to identify from measures that correct environmental externalities in the NTM data bases, regulatory recognition/harmonization would be a promising avenue to move EGA negotiations forward. Mutual Recognition Agreements (MRAs) are encouraged under article 6.1 of the TBT agreement which obliges WTO members to use “relevant international standards” for both technical regulations (article 2.4) and Conformity Assessment (CA) measures (article 5.4). Sugathan (2016) documents the costs imposed by lengthy Conformity Assessment (CA) procedures. He suggests that cooperation among EGA members could lead to a plurilateral MRA on CA which would reduce these costs. Cooperation could extend from a simple exchange of information to recognition of mutual equivalence as is the case in the EU Services Directive mentioned below.
Agreement on common labelling, a domestic measure, could also be a first-step objective for an EGA. Obtaining cooperation would be easier in a small-group setting, but achieve deeper still complicated under the current WTO legal framework. Take industrial electric motors as example. Adopting the same MEPs for electric motors through labelling, would be an example of regulatory convergence.31 Next, creating new HS6 codes at the WCO (HS codes are modified once every five
years) would open the way for negotiated zero tariffs reductions for the most efficient category. However, because technical progress will result in new products, procedures for a living list to add and take off products from the list would have to be agreed among members. Tariff reductions would then only apply for the most EE category and, ideally, WTO law would have to be modified to allow imposing tariffs on the least efficient category which is not possible under the GATT which precludes raising bound tariffs once lowered or eliminated.
Furthermore, under current WTO law, labelling falls under the Technical Barriers to Trade (TBT) agreement where ‘likeness’ is not adjudicated by reference to the HS but by consumers. So in case of a complaint by a WTO member that is not part of the EGA that the labelling is unnecessary and discriminatory, so far WTO case law has ruled that it is up to the consumer to decide if the labelling, which has to be non-discriminatory, is necessary (Mavroidis and Melo 2015). A move towards a WTO 2.0 is then necessary for labelling to contribute to avert climate change.
imports at the HS6 level beyond tariffs can be accounted for. Melo and Nicita (2018) discuss assumptions and limitations of these estimates.
31
The International Electrotechnical Commission (IEC) has published a standard of efficiency for electric motors with three levels of efficiency that has been adopted by many countries. This standard could enter into a MEPs agreed by EGA members; see Sugathan (2016).
Include environmental services (ESs)
A reduction in tariffs and in welfare-reducing NTBs should help diffuse products and technologies to developing countries that reduce environmental damage. But these products and technologies are often part of projects that include environmental services. The degree of ‘jointness’ in environmental projects is great especially for projects in developing countries but it is difficult to measure.32 Unfortunately,
environmental services were excluded from the EGA agenda, both in the hope of concluding the negotiations quickly and because environmental services were already being dealt with under the Trade in Services Agreement (TiSA) negotiations among 23 members, which started in 2013.33
Even if included on the agenda of a revived EGA negotiation, progress towards liberalizing trade in environmental services would still be difficult. First, many services do not cross customs so missing data are pervasive. Second, building indicators of restrictiveness in services is even harder than for NTBs.34 Even though there is some evidence that trade costs in Services are high, and are probably
falling, disparity in estimates across countries and sectors is high.35 Even with a better list of ESs,
negotiators are likely, once more to stumble when it comes to agreeing on a more appropriate list than the current UN CPC W/120 list.36
In sum, measuring impediments to trade in Services (beyond ordinal score commitments on market access and national treatment) is at least as hard as for NTBs. It is also harder to monitor the fulfilment of commitments to liberalization for Services. Consequently, disincentives to negotiate on ESs will be strong, especially when negotiating partners have little trust in each other. This is why Messerlin (2013) suggests that Mutual Equivalence (ME) in selected Services sectors might be easier to achieve than going for harmonization. ME would also be preferable for third parties not participating in the negotiations as they would be free to choose the least costly regulation. ME was the route followed by the EU Services Directive. Following this path might be difficult in the context of the EGA as mutual evaluation is a first step in the process. This evaluation would require CAs that will involve regulators in charge of the services under consideration.
Trade Restrictions in a sector or club approach
The EGA is about reducing tariffs and trade restrictions for EGs and eventually ESs. Climate Change affects the ‘global commons’, and the atmosphere is a common pool resource–i.e., it is quasi impossible to exclude others from enjoying it or degrading it use. This makes it very difficult to get collective action to protect it, as illustrated in the EGA negotiations so far. Collective action leading to cooperation requires putting in place incentives to participate (deter free riding) and, upon participation, to deter
32 This jointness is documented in several OECD publications. See, e.g. OECD (2005), Steenblik and Geloso Grosso (2011),
Sauvage and Timiliotis (2017).
33
As with the EGA, TiSA would be multilateralized if a critical mass is achieved which is unlikely because the BRICS are not participating. From a procedural standpoint, at the WTO, liberalization negotiations on EGs fall under the Non-Agricultural Market Access (NAMA) negotiations Committee while negotiations on market access for services fall under the General Agreement on Trade in Services (GATS).
34 The mix of local presence of suppliers in the mix of cross-border and locally-produced services will be higher than in the
case of goods. Melo and Vijil (2016) discuss these difficulties and propose an Environmental Services Index inspired from Miroudot et al. (2013). They apply this index to compare GATS commitment scores for environmental and other services by income for 37 countries. They find greater commitments for high-income countries for environmental services than for other services, but only for high-income countries.
35
Anderson et al. (2017) use a structural gravity model to measure trade costs for OECD countries for seven services sectors over the period 2000-2007. Their estimates show great heterogeneity across countries and services sectors.
36
Under the current UN Central Product Classification (CPC) W/120 list, which served for the GATS negotiations during the Uruguay Round, of the 155 sub-sectors, only 4 are classified as environmental services. The list is exclusive so engineering cannot appear as both an environmental service and as a stand-alone services sector.