Publisher’s version / Version de l'éditeur:
PERD/CHC Report 20-71, 2003-03
READ THESE TERMS AND CONDITIONS CAREFULLY BEFORE USING THIS WEBSITE. https://nrc-publications.canada.ca/eng/copyright
Vous avez des questions? Nous pouvons vous aider. Pour communiquer directement avec un auteur, consultez la première page de la revue dans laquelle son article a été publié afin de trouver ses coordonnées. Si vous n’arrivez pas à les repérer, communiquez avec nous à PublicationsArchive-ArchivesPublications@nrc-cnrc.gc.ca.
Questions? Contact the NRC Publications Archive team at
PublicationsArchive-ArchivesPublications@nrc-cnrc.gc.ca. If you wish to email the authors directly, please see the first page of the publication for their contact information.
Archives des publications du CNRC
For the publisher’s version, please access the DOI link below./ Pour consulter la version de l’éditeur, utilisez le lien DOI ci-dessous.
https://doi.org/10.4224/12340903
Access and use of this website and the material on it are subject to the Terms and Conditions set forth at
Update, quality assurance and query results for the PERD Grand Banks iceberg database: 2003
Comfort, G.; Verbit, S.
https://publications-cnrc.canada.ca/fra/droits
L’accès à ce site Web et l’utilisation de son contenu sont assujettis aux conditions présentées dans le site LISEZ CES CONDITIONS ATTENTIVEMENT AVANT D’UTILISER CE SITE WEB.
NRC Publications Record / Notice d'Archives des publications de CNRC:
https://nrc-publications.canada.ca/eng/view/object/?id=ddc46fa3-d3b4-4d56-85fd-269e0348ef89 https://publications-cnrc.canada.ca/fra/voir/objet/?id=ddc46fa3-d3b4-4d56-85fd-269e0348ef89
UPDATE, QUALITY ASSURANCE AND QUERY RESULTS FOR THE PERD GRAND BANKS ICEBERG DATABASE: 2003
March, 2003
G. Comfort S. Verbit
Submitted to: Dr. Garry W. Timco Canadian Hydraulics Centre National Research Council Canada
Ottawa, Ontario K1A 0R6
Submitted by: Fleet Technology Limited
311 Legget Drive Kanata, ON
K2K 1Z8
E-mail: FTL Contact: George Comfort Tel: 613-592-2830, Ext. 226
Fax: 613-592-4950 E-mail: gcomfort@fleetech.com
______________________________________________________________________________________ ACKNOWLEDGEMENTS
Dr. Garry Timco of the National Research Council was the project officer. He is thanked for his suggestions and guidance throughout the project.
Don Murphy of the International Ice Patrol (IIP) is thanked for supplying iceberg data for the Year 2002 for inclusion in the PERD Iceberg Sighting Database.
Pip Rudkin of Provincial Airlines Limited is thanked for supplying iceberg observations at oil industry sites. He is also thanked for supplying an advance copy of the Iceberg
Management Database.
DISCLAIMER
The views expressed in this report are those of BMT Fleet Technology Limited, and are not necessarily representative of those of the National Research Council.
Page
1.0 INTRODUCTION 1
1.1 Background 1
1.2 Objectives and General Description of the Work 1
1.3 Software Application for Database 2
1.4 Query String Output to File 3
1.5 Query Generator Clears 3
2.0 NEW ICEBERG DATA AND SOURCES 4
2.1 2002 Iceberg Season International Ice Patrol Data 4
2.2 Oil Industry Data 5
2.3 Data Breakdown by Source 5
3.0 INVESTIGATION OF DUPLICATE ICEBERG SIGHTINGS 7
3.1 Purpose 7
3.2 Approach 7
3.3 Results 7
4.0 ICEBERG MANAGEMENT DATABASE 12
5.0 NUMBER OF ICEBERG SIGHTINGS 13
5.1 Analysis Scope 13
5.2 Sample Results for the Grand Banks and Vicinity 13
5.3 Sample Results for the Oil Development Area in the Grand Banks 16
6.0 DATABASE IMPROVEMENTS 19
6.1 Improvements to the Database Functionality 19
6.2 Removal of Errors Associated With the Counts Field 19
7.0 RECOMMENDATIONS 20
8.0 REFERENCES 21 APPENDICES:
Appendix A – Duplicate Iceberg Sighting Elimination Appendix B – Statistical Density Tabulation
Appendix C – Counts Field Error Elimination Appendix D – Functionality Improvements
Appendix E – Iceberg Sighting Results for the Grand Banks and Area
______________________________________________________________________________________
LIST OF FIGURES
Page
Figure 2.1 Iceberg Locations for the 2002 IIP Sightings 4
Figure 2.2 Iceberg Locations for the 2002 PAL Sightings 5
Figure 3.1 Comparison of the Year 2000 PAL #21 and AMEC #141 8
Figure 3.2 Comparison of the Year 2002 PAL #2007 and IIP March Icebergs 10
Figure 5.1 Sample Result: Number of Iceberg Sightings in May for All Years 14
Figure 5.2 Sample Result: Iceberg Sightings in May Based on Only IIP Data 15
Figure 5.3 Sample Result: Iceberg Sightings in May Based on All Data 16
Figure 5.4 Sample Result: Number of Iceberg Sightings in May For All Years 17
Figure 5.5 Sample Result: Iceberg Sightings in May Based on Only IIP Data 18
Figure 5.6 Sample Result: Iceberg Sightings in May Based on All Data 18
LIST OF TABLES
Page
Table 2.1 Data Breakdown by Source 6
Table 3.1 Duplicate Icebergs Found and Corrective Actions Taken 9
Table 3.2 Description of Database Fields 11
Table 5.1 Summary Statistical Results for the Number of Iceberg Sightings
in the Grand Banks and Vicinity 15
Table 5.2 Summary Statistical Results for the Number of Iceberg Sightings
1. INTRODUCTION
1.1 Background
Fleet Technology Ltd, (FTL) compiled a database (termed the PERD Iceberg Sighting Database) in 1998 for iceberg sightings within the Grand Banks and eastern Canada, in collaboration with Agra Earth and Environmental (Singh et al. 1998).
The PERD Iceberg Sighting Database was updated and changed structurally in 1999 to improve its user-friendliness and performance (Singh et al. 1999).
The PERD Iceberg Sighting Database was updated again in 2000 with data collected during the 1998-1999 iceberg seasons, and with historical data compiled by the Institute of Marine Dynamics (IMD). Any erroneous data discovered were corrected or removed from the database at that time, and some minor layout changes were made (Verbit et al. 2000).
The PERD Iceberg Sighting Database was further updated in 2001 with data collected during the year 2000 (Verbit et al, 2001). It also underwent extensive error-checking at that time (e.g., with respect to cells that were blank, out-of-range, etc).
The PERD Iceberg Sighting Database was updated again in 2002 with data collected during the year 2001 (Verbit et al, 2002). Iceberg sightings from the PERD Iceberg Shape Database (Canatech et al, 1999) were added to the PERD Iceberg Sighting
Database as well. Detailed checks were made to identify duplicate sightings for the year 2000 data. A number of duplicates were found and they were removed from the PERD Iceberg Sighting Database.
The above projects were all funded by the Program on Energy Research and Development (PERD).
1.2 Objectives and General Description of Work
The present project was a follow-on to the previous studies. The objectives were to: (a) update the PERD Iceberg Database with data collected during the 2002 iceberg
season. The following work was done:
• add the 2002 data – the following sources were checked, and data added:
o International Ice Patrol (IIP) – 4,735 iceberg sightings were added
o Industry data – 1,956 iceberg sightings were added. These were
supplied by Provincial Airlines Limited (PAL) on behalf of the supporting oil companies
• check the new data for incorrect iceberg positions (i.e. on land or out of range), and remove ones that failed these checks.
______________________________________________________________________________________ A CD with the updated PERD Iceberg Sighting Database was provided to the National Research Council (NRC) under separate cover.
This report describes the updating process, and the new data that were added. The previous reports (i.e., Singh et al., 1998; Singh et al., 1999; Verbit et al., 2000; Verbit et al, 2001; Verbit et al, 2002) should be referred to for information regarding the database layout and previously-completed updates.
(b) duplicate sightings – detailed checking was done for all sightings except for the year 2000 to find duplicates. The Year 2000 data were checked during the previous project (Verbit et al, 2002).
(c) Iceberg Management Database – this database, which was prepared by Provincial Airlines Limited (PAL), was reviewed to assess the most appropriate method of linking it to the PERD Iceberg Sighting Database.
(d) Query the database to determine the number of iceberg sightings by year, month, and latitude by longitude cells. Although the database’s search engine allows the user to perform these queries, it would have been a tedious job to make such an extensive set of queries using it. Consequently, these queries were done using
Excel macros written for this purpose. The following queries were made:
- Whole database: this was queried for each 1° by 1° latitude by longitude cell for each month of each year of record. Excel files were produced with this information.
- Grand Banks: This area was queried in greater detail. Iceberg sightings were determined for each 0.5° by 0.5° latitude by longitude cell for each month of each year of record. The ranges of latitudes and longitudes covered were N45° to N47.5° inclusive, and W45° to W49.5° inclusive, respectively. Excel files were produced with this information.
Both sets of Excel files were provided to the NRC under separate cover on the same CD that contained the updated PERD Iceberg Sighting Database, described in item (a) above.
(e) improvements to the database’s usability – several improvements were made.
1.3 Software Application for Database
The PERD Iceberg Sighting Database can only be run with Microsoft Access 2000 using the file supplied, which is “PERD Iceberg Database 2000.mdb”. Previous versions of the database were distributed in both MS Access 97 and MS Access 2000.
A workgroup file called Perd.mdw was created for the PERD Iceberg Database
2000.mdb. This workgroup has established permissions for the database administrator to add new data to the Main Data table, using the User ID and password. The User ID and
are not accessible for editing.
1.4 Query String Output to File
When a query is created and the output saved to Excel, the query conditions used to generate the query table is outputted to a second sheet in the Excel output file.
1.5 Query Generator Clears
When a query is executed by pressing the Query button, the Query Generator controls are reset. The next additional query statements entered are added to the existing query string and applied to the existing query table. The full main table will only be the source of a new query when the user depresses the “reset” button. Upon output the entire query string is placed in the Excel file.
______________________________________________________________________________________
2. NEW ICEBERG DATA AND SOURCES
All known iceberg information sources were contacted to obtain any newly-available data. . The following sightings from the Year 2002 were collected:
(a) International Ice Patrol (IIP) – 4,735 iceberg sightings
(b) Industry data – 1,956 iceberg sightings. These were supplied by Provincial Airlines Limited (PAL) on behalf of the supporting oil companies.
2.1 2002 Iceberg Season International Ice Patrol Data
The IIP collected data on 2,170 icebergs for the 2002 ice season, for a total of 4,735 sightings. All of these sightings were found to have valid coordinate positions (meaning that they did not fall on land or in unreasonable geographic regions). They are shown in Figure 2.1.
2.2 Oil Industry Data
PAL collected data on 100 icebergs for the 2002 ice season, and tracked these for a total of 1,956 sightings. All of these sightings were found to have valid coordinate positions. They were all located in the vicinity of Hibernia, located within the 45.5 to 49.0 degree north parallels, and the 46.5 to 52.0 west meridians. They are shown in Figure 2.2.
Figure 2.2: Iceberg Locations for the 2002 PAL sightings
2.3 Database Breakdown by Source
The PERD Iceberg Sighting Database now contains a total of 193,437 sightings, and 116,915 unique icebergs. The 14,701 historical icebergs (IMD) have no data as to whether they are unique icebergs or not.
Approximately 86% of the database are from the IIP. The remainder of the data are from several sources (Table 2.1).
______________________________________________________________________________________
Table 2.1 Database Breakdown by Source
Source Years Number of Sightings
Large-Area Surveys:
• IIP 1960-2002 166,331
Industry Data:
• MEDS (Wellsite reports)
• Isometrics (PetroCanada -Terra Nova)
• Coretec (Conquest Drill Site)
• Provincial Airlines Limited
• Agra & AMEC (Hibernia)
1983 – 1990 1984 – 1990 1984 – 1985 2000 & 2002 1998 & 2000 7,155 255 133 1,344 & 1,956 28 & 658 Historical Data: • IMD (various) 1810 – 1958 14,701
Detailed Field Surveys:
• C-CORE • Shape Database 1997 1979 - 1985 17 859 Totals 1810-2002 193,437
It should be noted that the Table 2.1 numbers reflect the number of icebergs submitted by each sighting source. After performing the duplicate sightings process described in section 3, database queries by sighting source only will potentially give slightly different numbers. The same iceberg entries from different sources are altered to be recognized as a single iceberg. The altered entries are also flagged.
3. INVESTIGATION OF DUPLICATE ICEBERG SIGHTINGS
3.1 Purpose
During the previous update (Verbit et al, 2002), it was discovered that a number of entries for the Year 2000 that were listed as separate icebergs were in fact the same iceberg that was sighted by different sources. This was manually investigated and corrected for the Year 2000 sightings.
To enable the process to be done for the entire existing database, and the newly available data, the process was automated using MS Access querying functions, and a final manual check once duplicate were found. The automation process enabled us to find several duplicates in this project.
3.2 Approach
The process was comprised of the following steps. They are described in greater detail in Appendix A.
(a) query the database to create groupings of icebergs with the same date and position within applied tolerances.
(b) eliminate bergs without re-sights. A single sighting could not be proven to be a duplicate.
(c) eliminate bergs from the same data source. The assumption is that each data source has a reliable tracking and numbering system.
(d) eliminate duplicate groupings holding one berg following the above elimination steps (b) and (c).
(e) eliminate potential duplicate bergs based on dissimilar size.
(f) plot the trajectory of the remaining bergs and manually eliminate the groupings of icebergs which are deemed to be truly unique.
(g) Combine the remaining matching icebergs by changing the sighting source and iceberg number of the entries originating from the source with the least sightings of the iceberg being compared to that of the sighting source having spotted the iceberg the largest number of times.
3.3 Results
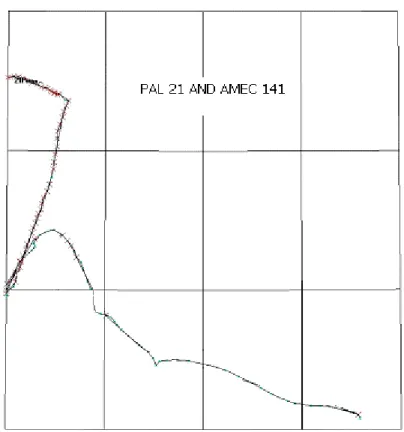
This process identified several icebergs and sightings that were clearly duplicates, of which samples are shown in Figure 3.1.
Figure 3.1 shows a sample comparison of the trajectories for an AMEC and PAL iceberg found in from the year 2000 data cleaning process. It is noted that the two trajectories
______________________________________________________________________________________ overlap, and that the combination of the two data sources provides better definition of the overall iceberg trajectory.
Figure 3.1 Comparison of the Year 2000 PAL #21 and AMEC #141
The database was then corrected for these duplicate sightings so that a single search would return all of the relevant sighting data. The “data source” was set to that which originally contained the most sightings. Sightings with a changed “data source” were identified by a flag.
The above filtering process identified 9 duplicate icebergs in the existing database. Table 3.1 summarizes the action taken in each case.
Group # Data Source Iceberg No. Year No. Sightings Action Code 11 AMEC 138 2000 7 5 PAL 18 2000 >30 - IIP 255 2000 11 6 14 AMEC 151 2000 84 - IIP 229 2000 11 7 PAL 48 2000 >40 2 16 AMEC 174 2000 7 5 IIP 500 2000 NO MATCH - PAL 67 2000 19 - 21 AMEC 182 2000 6 5 IIP 828 2000 NO MATCH - PAL 72 2000 7 - 28 IIP 251 2000 6 6 PAL 3 2000 7 - 83 MEDS 140 1985 7 - IIP 1717 1985 3 8 96 MEDS 16 1984 30 - IIP 338 1984 7 8
Conversion Action Code Definition: 2 - PAL to AMEC 3 - PAL to IIP 4 - AMEC to IIP 5 - AMEC to PAL 6 - IIP to PAL 7 - IIP to AMEC 8 - IIP to MEDS
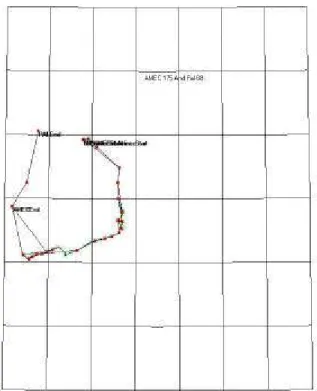
The new 2002 data showed no duplicates using the method described above, where one of the sightings must be in the same location at the same time. Figure 3.2 shows one PAL iceberg trace and the icebergs from the IIP from the same time period as an example.
______________________________________________________________________________________
Figure 3.2 Comparison of the Year 2002 PAL #2007 and IIP March Icebergs.
Table 3.2 contains an outline of the different fields filled for each iceberg entry in the database. During this new revision, the data source field list was added to, to allow queries with respect to the PAL and Shape Database sources. Also, after duplicate checks were completed additional flags were defined. These definitions are also accessed
A. Data Source
(A numeric code to indicate the source of the data)
1. IIP 6. CORETEC 2. MEDS 7. IMD 3. Isometrics 8. AMEC 4. C-CORE 9. PAL
5. Agra 10. Shape Database B. Flag symbol
1 = A flag denoting a longitudinal error for 1994 IIP data only.
2 = PAL converted to AMEC 3 = PAL converted to IIP 4 = AMEC converted to IIP 5 = AMEC converted to PAL 6 = IIP converted to PAL 7 = IIP converted to AMEC 8 = IIP converted to MEDS
C. Iceberg # A number assigned to the berg. This is not unique and could change from
year to year and source to source
D. Resight First berg sighting - “N”; Subsequent - “Y”; Or - “Unknown (Historical
data)”
E. Sighting Source 1. Aircraft 4. Miscellaneous
2. Ship 5. Unknown 3. Offshore Industry
F. Sighting Method 1. Radar 4. Measured
2. Visual 5. Estimated or Synthetic 3. Radar and visual 6. Unknown
G. Latitude In decimal degrees
H. Longitude In decimal degrees
I. Ice Season e.g., the 1995-1996 season is noted as 1996 (used only for IIP data)
J. Sighting Year Calendar year of iceberg sighting
K. Sighting Month Format: January
L. Sighting Date e.g., 4-Dec-1975
M. Sighting Time in UTC (hrs) e.g., 1201
N. Iceberg Size 1. Growler 5. Large
2. Bergy Bit 6. Very Large 3. Small 7. Unknown
4. Medium 8. Unidentified Target
O. Iceberg Shape 1. Wedge 6. Drydock
2. Tabular 7. Fragments 3. Non-Tabular 8. Blocky 4. Dome 9. Unknown 5. Pinacle
P. Iceberg Length (m)
Q. Length Flag M for measured; E for estimated; and X for unknown
R. Iceberg Height (m)
S. Height flag M for measured; E for estimated; and X for unknown
T. Iceberg Width (m)
U. Width Flag M for measured; E for estimated; and X for unknown
V. Iceberg Draft (m)
W. Draft Flag M for measured; E for estimated; and X for unknown
X. Iceberg Mass Tons
Y. Mass Flag M for measured; E for estimated; and X for unknown
Z. Well Site Name of the drill-well site
______________________________________________________________________________________
4.0 ICEBERG MANAGEMENT DATABASE
An Iceberg Management Database has recently been prepared by Provincial Airlines Limited (PAL). This database is in the final stages of development.
This database is of interest to the PERD Iceberg Sighting Database as: (a) it contains positional information regarding icebergs
(b) iceberg management operations, such as towing, may affect the drift patterns of icebergs. Therefore, it is of interest to know whether positions for icebergs in the PERD Iceberg Sighting Database are “natural” ones, or whether they were
affected by iceberg management operations.
An early version of the Iceberg Management Database was reviewed. Quantititave positional data could not be obtained from the database searches, although drift plots were available. Thus, it appears that significant effort would be required to extract quantitative positional data from the plots in the Iceberg Management Database. It would be more feasible to add a field, or flag, to the PERD iceberg sighting database which identified whether or not the iceberg had been towed. This would satisfy objective (b) above. Unfortunately, differences were noted in the iceberg numbering systems used in the two databases which would hinder this process (of adding a flag). Further
5.1 Analysis Scope
The database was queried to determine the number of iceberg sightings for each month of each year for the following areas:
(a) whole area encompassed by the database – iceberg counts were determined for each 1° by 1° latitude by longitude cell.
(b) Grand Banks and vicinity - iceberg counts were determined for each 0.5° by 0.5° latitude by longitude cell, within the following ranges:
a. latitude: N 45° to N 47.5° inclusive b. longitude: W 45° to W 49.5° inclusive This represents an area of 96,000 square kilometers.
Although the search wizard in the database allows the user to perform this type of search, a query of this magnitude would have been a tedious task. Consequently, this search was automated using code written for this purpose.
The following sections present sample results. The full set of raw results were stored on Excel files which were supplied on the same CD containing the updated database, which was submitted under separate cover.
5.2 Sample Results for the Grand Banks and Vicinity
Analyses were done for the icebergs counted within the full range of latitudes and longitudes covered by the “Grand Banks” search (item (b) above) for two cases:
(a) only the IIP data
(b) all data – for this case, sightings from other sources (than the IIP) were included in the iceberg counts.
Figure 5.1 shows a sample result for the number of iceberg sightings per month for each year of record. A full set of monthly plots is provided in Appendix E. As expected, the number of icebergs sighted varied significantly from year to year. Considerably fewer icebergs were sighted prior to 1960 (Figure 5.1). This reflects the fact that only historical data are available prior to 1960.
Direct comparisons are also difficult due to the fact that, for recent years, the database includes sightings from both the IIP and other sources, such as the oil industry. To help illustrate trends, both the total number of sightings, and only the IIP sightings, were
______________________________________________________________________________________ plotted. As expected, the number of iceberg sightings was reduced when only the IIP data were considered (Figure 5.1).
Iceberg Sightings in May 1820 - 2001
Grand Banks and Surrounding Area, 45ºN to 47.5ºN, 45ºW to 49.5ºW
0 100 200 300 400 500 600 700 800 900 1000 1100 1200 1300 1400 1820 1830 1840 1850 1860 1870 1880 1890 1900 1910 1920 1930 1940 1950 1960 1970 1980 1990 2000 Year Number of Sightings Historical Data, 1820 - 1959 IIP Data All Data Only IIP Data Available for this Year
Figure 5.1 Sample Result: Number of Iceberg Sightings in May For All Years
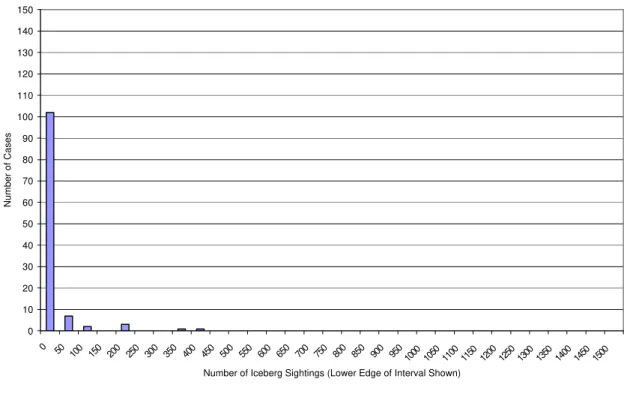
Figures 5.2 and 5.3 show sample histograms for the number of iceberg sightings per month based on only IIP data, and based on all data, respectively. A full set of histograms is provided in Appendix E. Tabulated results are shown in Table 5.1.
As expected, the number of iceberg sightings peaks in April and May.
The mean number of sightings is higher for each month when only the IIP data are considered. This reflects the fact that only historical data are available prior to 1960.
Table 5.1 Summary Statistical Results for the Number of Iceberg Sightings in The Grand Banks and Vicinity
All Data IIP Data Only
Month Number of Iceberg Sightings # of Number of Iceberg Sightings # of
Mean Max Min Years Mean Max Min Years
January 1.7 123 0 136 4.5 123 0 42 February 12.5 473 0 136 28.6 473 0 42 March 38.2 813 0 136 101.4 813 0 42 April 66.6 1261 0 136 161.0 1261 0 42 May 53.8 1337 0 136 187.5 1337 0 42 June 27.1 586 0 136 95.1 586 0 42 July 9.2 152 0 136 29.7 152 0 42 August 2.6 113 0 136 8.4 113 0 42 September 0.5 20 0 136 0.9 16 0 42 October 0.1 7 0 136 0.2 7 0 42 November 0.2 28 0 136 0.0 1 0 42
Iceberg Sightings for the Grand Banks and Area for May Based Only on IIP Data
0 5 10 15 20 25 30 35 40 45 0 50 100 150 200 250 300 350 400 450 500 550 600 650 700 750 800 850 900 950 1000 1050 1100 1150 1200 1250 1300 1350 1400 1450 1500 Number of Iceberg Sightings (Lower Edge of Interval Shown)
Number of Cases
______________________________________________________________________________________
Iceberg Sightings for the Grand Banks and Area for May Based Only on All Data
0 10 20 30 40 50 60 70 80 90 100 110 120 130 140 150 0 50 100 150 200 250 300 350 400 450 500 550 600 650 700 750 800 850 900 9501000 1050 1100 1150 1200 1250 1300 1350 1400 1450 1500 Number of Iceberg Sightings (Lower Edge of Interval Shown)
Number of Cases
Figure 5.3 Sample Result: Iceberg Sightings in May Based on All Data
5.3 Sample Results for the Oil Development Area in the Grand Banks
The “oil development area” was defined as follows: (a) latitude: N 46° to N 47.5° inclusive
(b) longitude: W 47.5° to W 49.5° inclusive This represents an area of 25,370 square kilometers. The analyses were done for two cases:
(a) only the IIP data
(b) all data – for this case, sightings from other sources were included in the iceberg counts.
Figure 5.4 shows a sample result for the number of iceberg sightings per month for each year of record. A full set of monthly plots is provided in Appendix F.
Figure 5.5 and 5.6 show sample histograms for the number of iceberg sightings per month based on only IIP data, and based on all data, respectively. A full set of histograms is provided in Appendix F. Tabulated results are provided in Table 5.2.
As expected, fewer icebergs were sighted in the oil development area compared to the whole Grand Banks, as the search area is about 4 times less (i.e., about 25, 370 km2 vs 96,000 km2, respectively). When the results are compared on a per-unit area basis, the data show that iceberg spatial frequencies were higher in the oil development area. This is probably due to more frequent and/or extensive observations in the oil development area.
Iceberg Sightings in May 1820 - 2001
Grand Banks, Latitude 46ºN to 47.5ºN, Longitude 47.5ºW to 49ºW
0 100 200 300 400 500 600 700 800 900 1000 1100 1200 1300 1400 1820 1830 1840 1850 1860 1870 1880 1890 1900 1910 1920 1930 1940 1950 1960 1970 1980 1990 2000 Year Number of Sightings Historical Data, 1820 - 1959 IIP Data All Data Only IIP Data Available for this Year
Figure 5.4 Sample Result: Number of Iceberg Sightings in May For All Years
Table 5.2 Summary Statistical Results for the Number of Iceberg Sightings in the Oil Development Area of the Grand Banks
All Data IIP Data Only
Month Number of Iceberg Sightings # of Number of Iceberg Sightings # of
Mean Max Min Years Mean Max Min Years
January 0.3 15 0 116 1.2 43 0 43 February 2.3 44 0 116 13.8 271 0 43 March 7.6 202 0 116 33.2 211 0 43 April 21.4 292 0 116 72.6 630 0 43 May 12.1 356 0 116 88.9 525 0 43 June 4.6 286 0 116 44.3 250 0 43 July 1.4 106 0 116 12.7 62 0 43 August 0.3 27 0 116 2.7 30 0 43 September 0.2 18 0 116 0.1 3 0 43 October 0.0 3 0 116 0.0 1 0 43 November 0.2 26 0 116 0.0 0 0 43 December 0.5 47 0 116 0.1 2 0 43
______________________________________________________________________________________
Iceberg Sightings for the Grand Banks and Area for May Based Only on IIP Data
0 5 10 15 20 25 30 35 40 45 0 50 100 150 200 250 300 350 400 450 500 550 600 650 700 750 800 850 900 950 1000 1050 1100 1150 1200 1250 1300 1350 1400 1450 1500 Number of Iceberg Sightings (Lower Edge of Interval Shown)
Number of Cases
Figure 5.5 Sample Result: Iceberg Sightings in May Based on Only IIP Data
Iceberg Sightings for the Grand Banks and Area for May Based Only on All Data
0 10 20 30 40 50 60 70 80 90 100 110 120 130 140 150 0 50 100 150 200 250 300 350 400 450 500 550 600 650 700 750 800 850 900 9501000 1050 1100 1150 1200 1250 1300 1350 1400 1450 1500 Number of Iceberg Sightings (Lower Edge of Interval Shown)
Number of Cases
6.1 Improvements to the Database Functionality
The following improvements were added to the database:
(a) the “<>” not equal to Query condition was added for the Data Source search criteria.
(b) old obsolete versions of Excel were removed from the Saving Options. (c) changes made to allow the “Back” button to step back through to 3 previous
Queries. This allows a multi-step query to be referred back to without having to reset the table and repeating the entire query.
(d) creation of a Bookmarks Table with a form which will display the bookmark. Information is displayed with the Query in English form as it appears on the Query Form and the date that the Query was created. A “Bookmarked” query may be selected for recall or deleted.
(e) a “Go To Bookmarks” button was added. It appears on the Query Form to open the bookmark table.
6.2 Removal of Errors Associated With the Counts Field
It was noted that errors had been made in eliminating the “counts” field (in a previous project). The “counts” field was part of the some of the original IIP data. It was used to show when multiple icebergs were spotted in one location and reported as a single sighting record. In a past updating program, the counts field was removed by inserting copies of the parent iceberg into the database, under the same iceberg number, as a re-sight. These added icebergs were not treated as unique, resulting in counting errors. The correction process involved renumbering the added icebergs by appending a multiple of (0.01) to the original iceberg number, and changing the re-sight field back to “N”. For example, an iceberg numbered 542 with a counts field of 3 was previously reported as:
Data Source … Iceberg No. … Re-Sight
MyName … 542 … N
MyName … 542 … Y
MyName … 542 … Y
Upon correction of the error, this iceberg is now reported as follows:
Data Source … Iceberg No. … Re-Sight
MyName … 542 … N
MyName … 542.01 … N
MyName … 542.02 … N
______________________________________________________________________________________
7.0 RECOMMENDATIONS
The current work has expanded and improved the PERD iceberg database. The following recommendations are made for further expansion and improvement:
(a) Continued Updates – the PERD database should be updated with any new iceberg
sighting data that become available in 2003.
(b) Iceberg Management Database – the sightings in this database should be
referenced to PERD Iceberg Sighting Database. Icebergs that were towed should be flagged. To accomplish this, the iceberg numbering systems in this database should be compared and referenced to the ones in the PERD Iceberg Sighting Database.
(c) Investigation of Sampling Done – the PERD Iceberg Sighting Database only
contains sighting observations. It does not contain information regarding the sampling that was done to obtain these observations. As a result, the database is not capable of providing information regarding iceberg frequencies, population densities, or fluxes.
The database would be significantly enhanced if sampling information were inputted as well so that users could determine this type of iceberg data. BMT FTL is aware of previous studies that were aimed at comparing iceberg sightings and sampling efforts. As a start, these studies should be reviewed and information should be added from them to the database, where possible.
8.0 REFERENCES
1. Canatech Consultants Ltd., ICL Isometrics Ltd., Coretec Inc., and Westmar
Consultants Ltd., 1999, Compilation of Iceberg Shape and Geometry Data for the Grand Banks Region, report submitted to PERD PERD/CHC report 20-43.
2. Singh, S., Green, S., Ennis, T., Comfort, G., and Davidson. L., 1998, PERD
Iceberg Database for the Grand Banks Regions, report 4807 submitted by Fleet Technology Ltd. and AGRA to the National Research Council.
3. Singh, S., Li, X., and Comfort, G., 1999, PERD Grand Banks Iceberg Database
Update, Fleet Technology Ltd report 4901 submitted to the National Research Council.
4. Verbit, S., Trott, B., Gong, Y., and Comfort, G., 2000, PERD Grand Banks
Iceberg Database Update II, FTL report 5068 submitted to the National Research Council.
5. Verbit, S., and Comfort, G., 2001, Update and Quality Assurance of the PERD
Grand Banks Iceberg Database, FTL report 5186 submitted to the National Research Council
6. Verbit, S., Trott, B., and Comfort, G., 2002, Update and Quality Assurance of the
PERD Grand Banks Iceberg Database, FTL report 5273 submitted to the National Research Council
______________________________________________________________________________________
APPENDIX A DUPLICATE ICEBERG SIGHTING ELIMINATION
A.1 DUPLICATE ICEBERG SIGHTING ELIMINATION
A.1.1 Introduction
The task involved renaming iceberg sightings reported as two different icebergs, to the same name, number, and details. This problem occurred when several data sources were tracking the same iceberg, with different naming and numbering conventions. Each duplicate iceberg that was found and changed, is recognized by the addition of a non-zero number in the “flag” column. The corresponding explanation for each change is detailed in the “Notes” dialog.
The process used relies on a time and position and tracking proof. We only renamed icebergs tracked for a multitude of sightings. We could not prove that single sighted icebergs were the same via this method.
A.1.2 Process Overview
The process was comprised of the following steps, which are described in detail in section A.2:
(a) Query the database to create groupings of icebergs with the same date and position within applied tolerances.
(b) Eliminate bergs without re-sights. A single sighting could not be proven to be a duplicate.
(c) Eliminate bergs from the same data source. It was assumed that each data source had a reliable tracking and numbering system.
(d) Eliminate duplicate groupings holding one berg following the above elimination steps (b) and (c).
(e) Eliminate bergs which were not similar size to their potential duplicates. (f) Plot the trajectory of the remaining bergs to eliminate those which are truly
unique.
The above filtering process identified 9 duplicate icebergs.
A.2 THE PROCESS
A.2.1 Step 1 – Position/Time Criteria
An automated query process was created to search all 186,746 records in the “Main Data” table searching for entries matching the date, latitude ± 0.01°, and longitude ± 0.01° criteria. An example of the query used follows:
Select MainData.* from MainData Where .Date = “Selected Date” And (.latitude < “Selected Latitude” + 0.01 And .latitude > “Selected Latitude” –0.01) And (.longitude < “Selected Longitude” + 0.01 And .longitude > “Selected Longitude – 0.01)
______________________________________________________________________________________ The query used the date, latitude and longitude data from each record in the “MainData” table. After the query found all matching entries, the list of entries were moved to a second “Sort Table”. Each query result found was assigned a group number which represented the matching groups of bergs. The query then selected the same three criteria from the next iceberg in the main table, and repeated the process until the “MainData” table was empty.
This process identified 45,838 possible duplicate records out of the 186,746 original records.
A2.2 Checking for re-sights
A second search was conducted to find the icebergs having multiple sightings. If multiple sightings existed in the “MainData” table, the entry could potentially be proven to be a duplicate. If not, the iceberg was removed from the potential list.
A query process similar to the first step was created using the new “Sort Table”. All non re-sights were extracted from the “Sort Table” and stored in a temporary “OnlyNo” table. A second query would use the iceberg#, year and data source fields from each record of the “OnlyNo” table and search the “MainData” table for records with the matching criteria. If only one record was found in the “MainData” table, the queried iceberg entry was deleted from the “SortTable”, thereby reducing the list of potential duplicates. After this process, the number of possible duplicate records dropped to 39,751 from 45,838.
A2.3 Same Data Source Criteria
A query was created to check for iceberg entries that originated from the same data source. The assumption was made that each company had a reliable numbering system, and thus duplicates would not have originated from the same data source.
This query checked for icebergs based on matching data source, iceberg#, and group number. It found “Exact Duplicate” entries. The duplicate criteria stated the bergs must originate from different data sources.
A.2.4 Unique Berg Removal
A unique berg was defined as the only iceberg contained within a numbered grouping. If similar icebergs were removed due to any steps of the above process, leaving a single entry within a grouping, the single berg grouping was eliminated.
A manual comparison of the remaining iceberg entries was conducted to compare the size of the icebergs that were found in each group of the SortTable. Due to the differences in judgment between individuals spotting the icebergs, the size comparison for each set of possible duplicates was based on the following groupings:
• Growler = Bergy Bit = Small
• Medium = Large
• Large = Very Large
• Unknown possibly = to all sizes
• Unidentified Target removed.
For example, if a group contained 2 entries that were Small and Large, then both entries were removed as not being the same iceberg.
If a group contained three entries with sizes of Growler, Small and Large, then the Large entry was removed. The two remaining entries were kept as being possibly duplicate sightings.
After this final manual check, 350 possible duplicate iceberg entries remained. A.2.6 Iceberg Tracking Extraction & Mapping
The remaining iceberg entries were queried from “MainData” for mapping and a final visual inspection to determine if they were in fact following the same path and were duplicates. Each Group of icebergs was queried and then stored in separate Group# Excel files. The group Excel files were used to create input files for the Versamap plotting program. Forty maps were created.
______________________________________________________________________________________
A.3.0 MAP INSPECTION & RESULTS
Upon close inspection of each map, a total of seven maps containing sixteen icebergs were found to have duplicates. Nine icebergs were altered within the database. The table below summarizes the final inspection process and the action taken in each case.
Group # Data Source
Iceberg
No. Year No. Sightings Action Code
11 AMEC 138 2000 7 5 PAL 18 2000 >30 - IIP 255 2000 11 6 14 AMEC 151 2000 84 - IIP 229 2000 11 7 PAL 48 2000 >40 2 16 AMEC 174 2000 7 5 IIP 500 2000 NO MATCH - PAL 67 2000 19 - 21 AMEC 182 2000 6 5 IIP 828 2000 NO MATCH - PAL 72 2000 7 - 28 IIP 251 2000 6 6 PAL 3 2000 7 - 83 MEDS 140 1985 7 - IIP 1717 1985 3 8 96 MEDS 16 1984 30 - IIP 338 1984 7 8
Conversion Action Code Definition: 2 - PAL to AMEC 3 - PAL TO IIP 4 - AMEC to IIP 5 - AMEC to PAL 6 - IIP to PAL 7 - IIP to AMEC 8 - IIP to MEDS
Figure A.1: Comparison of PAL 21 and AMEC 141
______________________________________________________________________________________
Figure A.3: Comparison of PAL 48 and AMEC 151
Figure A.5: Comparison of PAL 68 and AMEC 175
______________________________________________________________________________________
Figure A.7: Comparison of PAL 80 and IIP 2558
Figure A.9: Comparison of AMEC 150 and PAL 43
______________________________________________________________________________________
APPENDIX B STATISTICAL DENSITY TABULATION
______________________________________________________________________________________
B.1 INTRODUCTION
The task first involved counting the number of icebergs sighted within a 1° latitude by 1° longitude region for every month of every year in the database. The task involved a two step process, as follows:
(a) re-sights within the analyzed area were eliminated to not inflate the density results,
(b) the remaining icebergs were counted to determine the number of sightings within the time period and region.
The process was then repeated with more precision, of ½° latitude by ½° longitude, for the area surrounding the Grand-Banks. The region analyzed with more precision was from 45° to 48° latitude North, and 45° to 50° longitude West.
B.1.1 Re-sight Elimination
An automated query was written which examined every entry in the database against its re-sights based on year, month and position criteria. Icebergs were only deleted from the table if the re-sights found occurred in the same month and position. All other bergs were counted. Once the repeat bergs were removed, the remainder were saved to Excel files for counting.
B.1.2 Density Counting
An Excel macro was used for counting which included the lower bound of a cell within the cell. For example, in the large scale case, the counts labeled in the 46°N category can have a latitude range of 46°N = Latitude < 47°N. The same is true for longitude values and for the Grand Banks cases, on the range changes.
The resulting annual statistical density files are named based on the year of data they contain (e.g. 1972.xls). Within each file there are three worksheets. One contains the queried data and is named after the year queried, the second, named “Density” contains the 1° by 1° results, and the third named “Grand Banks” contains the ½° by ½° results. A sample results table for the Grand Banks region in January 1993 is presented below.
January Lat/Long 45 45.5 46 46.5 47 47.5 48 48.5 49 49.5 45 0 0 1 0 0 0 2 2 0 0 45.5 0 1 1 2 1 3 1 0 0 0 46 3 0 4 4 6 0 1 1 0 1 46.5 0 1 1 12 9 1 1 1 0 1 47 1 4 1 4 6 0 2 1 0 1 47.5 0 1 1 3 5 14 4 9 4 1
______________________________________________________________________________________
APPENDIX C COUNTS FIELD ERROR ELIMINATION
______________________________________________________________________________________
C.1.0 COUNTS FIELD ERROR ELIMINATION
It was noted that errors had been made previously in eliminating the “counts” field (in a previous project). The “counts” field was originally used to show when multiple icebergs were spotted in one location and reported as a single sighting record. In a past updating program, the counts field was removed by simply inserting copies of the parent iceberg into the database, under the same iceberg number, as a re-sight. These added icebergs were no-longer treated as unique resulting in counting errors.
The correction process involved renumbering the added icebergs by appending a multiple of (0.01) to the original iceberg number, and changing the re-sight field back to “N”. For example, an iceberg numbered 542 with a counts field of 3 was previously reported as follows:
Data Source … Iceberg No. … Re-Sight
MyName … 542 … N
MyName … 542 … Y
MyName … 542 … Y
Upon correction of the error, this iceberg is now reported as follows:
Data Source … Iceberg No. … Re-Sight
MyName … 542 … N
MyName … 542.01 … N
MyName … 542.02 … N
______________________________________________________________________________________
APPENDIX D FUNCTIONALITY IMPROVEMENTS
______________________________________________________________________________________
D.1.0 FUNCTIONALITY IMPROVEMENTS
The following improvements were added to the database:
(f) The “<>” not equal to Query condition was added for the Data Source search criteria.
(g) Old obsolete versions of Excel were removed from the Saving Options. (h) Changes made to allow the “Back” button to step back through to 3 previous
Queries. This allows a multi-step query to be referred back to without having to reset the table and repeating the entire query.
(i) Creation of a Bookmarks Table with a form which will display the bookmark. Information is displayed with the Query in English form as it appears on the Query Form and the date that the Query was created. A “Bookmarked” query may be selected for recall or deleted.
(j) A “Go To Bookmarks” button appears on the Query Form to open the bookmark table.
______________________________________________________________________________________
APPENDIX E ICEBERG SIGHTING RESULTS FOR THE GRAND BANKS AND AREA
Search Area: Latitude: N45° to N47.5° Inclusive Longitude: W45° to W49.5° Inclusive
______________________________________________________________________________________ Iceberg Sightings in January
1820 - 2001
Grand Banks and Surrounding Area, 45ºN to 47.5ºN, 45ºW to 49.5ºW
0 100 200 300 400 500 600 700 800 900 1000 1100 1200 1300 1400 1820 1830 1840 1850 1860 1870 1880 1890 1900 1910 1920 1930 1940 1950 1960 1970 1980 1990 2000 Year Number of Sightings Historical Data, 1820 - 1959 IIP Data All Data Only IIP Data Available for this Year
Figure E.1 January
Iceberg Sightings in February 1820 - 2001
Grand Banks and Surrounding Area, 45ºN to 47.5ºN, 45ºW to 49.5ºW
0 100 200 300 400 500 600 700 800 900 1000 1100 1200 1300 1400 1820 1830 1840 1850 1860 1870 1880 1890 1900 1910 1920 1930 1940 1950 1960 1970 1980 1990 2000 Year Number of Sightings Historical Data, 1820 - 1959 IIP Data All Data Only IIP Data Available for this Year
______________________________________________________________________________________ Iceberg Sightings in March
1820 - 2001
Grand Banks and Surrounding Area, 45ºN to 47.5ºN, 45ºW to 49.5ºW
0 100 200 300 400 500 600 700 800 900 1000 1100 1200 1300 1400 1820 1830 1840 1850 1860 1870 1880 1890 1900 1910 1920 1930 1940 1950 1960 1970 1980 1990 2000 Year Number of Sightings Historical Data, 1820 - 1959 IIP Data All Data Only IIP Data Available for this Year
Figure E.3 March
Iceberg Sightings in April 1820 - 2001
Grand Banks and Surrounding Area, 45ºN to 47.5ºN, 45ºW to 49.5ºW
0 100 200 300 400 500 600 700 800 900 1000 1100 1200 1300 1400 1820 1830 1840 1850 1860 1870 1880 1890 1900 1910 1920 1930 1940 1950 1960 1970 1980 1990 2000 Year Number of Sightings Historical Data, 1820 - 1959 IIP Data All Data Only IIP Data Available for this Year
______________________________________________________________________________________ 1820 - 2001
Grand Banks and Surrounding Area, 45ºN to 47.5ºN, 45ºW to 49.5ºW
0 100 200 300 400 500 600 700 800 900 1000 1100 1200 1300 1400 1820 1830 1840 1850 1860 1870 1880 1890 1900 1910 1920 1930 1940 1950 1960 1970 1980 1990 2000 Year Number of Sightings Historical Data, 1820 - 1959 IIP Data All Data Only IIP Data Available for this Year
Figure E.5 May
Iceberg Sightings in June 1820 - 2001
Grand Banks and Surrounding Area, 45ºN to 47.5ºN, 45ºW to 49.5ºW
0 100 200 300 400 500 600 700 800 900 1000 1100 1200 1300 1400 1820 1830 1840 1850 1860 1870 1880 1890 1900 1910 1920 1930 1940 1950 1960 1970 1980 1990 2000 Year Number of Sightings Historical Data, 1820 - 1959 IIP Data All Data Only IIP Data Available for this Year
______________________________________________________________________________________ Iceberg Sightings in July
1820 - 2001
Grand Banks and Surrounding Area, 45ºN to 47.5ºN, 45ºW to 49.5ºW
0 100 200 300 400 500 600 700 800 900 1000 1100 1200 1300 1400 1820 1830 1840 1850 1860 1870 1880 1890 1900 1910 1920 1930 1940 1950 1960 1970 1980 1990 2000 Year Number of Sightings Historical Data, 1820 - 1959 IIP Data All Data Only IIP Data Available for this Year
Figure E.7 July
Iceberg Sightings in August 1820 - 2001
Grand Banks and Surrounding Area, 45ºN to 47.5ºN, 45ºW to 49.5ºW
0 100 200 300 400 500 600 700 800 900 1000 1100 1200 1300 1400 1820 1830 1840 1850 1860 1870 1880 1890 1900 1910 1920 1930 1940 1950 1960 1970 1980 1990 2000 Year Number of Sightings Historical Data, 1820 - 1959 IIP Data All Data Only IIP Data Available for this Year
______________________________________________________________________________________ 1820 - 2001
Grand Banks and Surrounding Area, 45ºN to 47.5ºN, 45ºW to 49.5ºW
0 100 200 300 400 500 600 700 800 900 1000 1100 1200 1300 1400 1820 1830 1840 1850 1860 1870 1880 1890 1900 1910 1920 1930 1940 1950 1960 1970 1980 1990 2000 Year Number of Sightings Historical Data, 1820 - 1959 IIP Data All Data Only IIP Data Available for this Year
Figure E.9 September
Iceberg Sightings in October 1820 - 2001
Grand Banks and Surrounding Area, 45ºN to 47.5ºN, 45ºW to 49.5ºW
0 100 200 300 400 500 600 700 800 900 1000 1100 1200 1300 1400 1820 1830 1840 1850 1860 1870 1880 1890 1900 1910 1920 1930 1940 1950 1960 1970 1980 1990 2000 Year Number of Sightings Historical Data, 1820 - 1959 IIP Data All Data Only IIP Data Available for this Year
______________________________________________________________________________________ Iceberg Sightings in November
1820 - 2001
Grand Banks and Surrounding Area, 45ºN to 47.5ºN, 45ºW to 49.5ºW
0 100 200 300 400 500 600 700 800 900 1000 1100 1200 1300 1400 1820 1830 1840 1850 1860 1870 1880 1890 1900 1910 1920 1930 1940 1950 1960 1970 1980 1990 2000 Year Number of Sightings Historical Data, 1820 - 1959 IIP Data All Data Only IIP Data Available for this Year
Figure E.11 November
Iceberg Sightings in December 1820 - 2001
Grand Banks and Surrounding Area, 45ºN to 47.5ºN, 45ºW to 49.5ºW
0 100 200 300 400 500 600 700 800 900 1000 1100 1200 1300 1400 1820 1830 1840 1850 1860 1870 1880 1890 1900 1910 1920 1930 1940 1950 1960 1970 1980 1990 2000 Year Number of Sightings
Historical Data, 1820 - 1959 IIP Data
All Data Only IIP Data Available for this Year
______________________________________________________________________________________
Iceberg Sightings for the Grand Banks and Area for January Based Only on IIP Data
0 5 10 15 20 25 30 35 40 45 0 50 100 150 200 250 300 350 400 450 500 550 600 650 700 750 800 850 900 9501000 1050 1100 1150 1200 1250 1300 1350 1400 1450 1500 Number of Iceberg Sightings (Lower Edge of Interval Shown)
Number of Cases
Figure E.13 January
Iceberg Sightings for the Grand Banks and Area for February Based Only on IIP Data
0 5 10 15 20 25 30 35 40 45 0 50 100 150 200 250 300 350 400 450 500 550 600 650 700 750 800 850 900 950 1000 1050 1100 1150 1200 1250 1300 1350 1400 1450 1500 Number of Iceberg Sightings (Lower Edge of Interval Shown)
Number of Cases
______________________________________________________________________________________
Iceberg Sightings for the Grand Banks and Area for March Based Only on IIP Data
0 5 10 15 20 25 30 35 40 45 0 50 100 150 200 250 300 350 400 450 500 550 600 650 700 750 800 850 900 950 1000 1050 1100 1150 1200 1250 1300 1350 1400 1450 1500 Number of Iceberg Sightings (Lower Edge of Interval Shown)
Number of Cases
Figure E.15 March
Iceberg Sightings for the Grand Banks and Area for April Based Only on IIP Data
0 5 10 15 20 25 30 35 40 45 0 50 100 150 200 250 300 350 400 450 500 550 600 650 700 750 800 850 900 950 1000 1050 1100 1150 1200 1250 1300 1350 1400 1450 1500 Number of Iceberg Sightings (Lower Edge of Interval Shown)
Number of Cases
______________________________________________________________________________________
Iceberg Sightings for the Grand Banks and Area for May Based Only on IIP Data
0 5 10 15 20 25 30 35 40 45 0 50 100 150 200 250 300 350 400 450 500 550 600 650 700 750 800 850 900 950 1000 1050 1100 1150 1200 1250 1300 1350 1400 1450 1500 Number of Iceberg Sightings (Lower Edge of Interval Shown)
Number of Cases
Figure E.17 May
Iceberg Sightings for the Grand Banks and Area for June Based Only on IIP Data
0 5 10 15 20 25 30 35 40 45 0 50 100 150 200 250 300 350 400 450 500 550 600 650 700 750 800 850 900 950 1000 1050 1100 1150 1200 1250 1300 1350 1400 1450 1500 Number of Iceberg Sightings (Lower Edge of Interval Shown)
Number of Cases
______________________________________________________________________________________
Iceberg Sightings for the Grand Banks and Area for July Based Only on IIP Data
0 5 10 15 20 25 30 35 40 45 0 50 100 150 200 250 300 350 400 450 500 550 600 650 700 750 800 850 900 950 1000 1050 1100 1150 1200 1250 1300 1350 1400 1450 1500 Number of Iceberg Sightings (Lower Edge of Interval Shown)
Number of Cases
Figure E.19 July
Iceberg Sightings for the Grand Banks and Area for August Based Only on IIP Data
0 5 10 15 20 25 30 35 40 45 0 50 100 150 200 250 300 350 400 450 500 550 600 650 700 750 800 850 900 950 1000 1050 1100 1150 1200 1250 1300 1350 1400 1450 1500 Number of Iceberg Sightings (Lower Edge of Interval Shown)
Number of Cases
______________________________________________________________________________________
Iceberg Sightings for the Grand Banks and Area for September Based Only on IIP Data
0 5 10 15 20 25 30 35 40 45 0 50 100 150 200 250 300 350 400 450 500 550 600 650 700 750 800 850 900 950 1000 1050 1100 1150 1200 1250 1300 1350 1400 1450 1500 Number of Iceberg Sightings (Lower Edge of Interval Shown)
Number of Cases
Figure E.21 September
Iceberg Sightings for the Grand Banks and Area for October Based Only on IIP Data
0 5 10 15 20 25 30 35 40 45 0 50 100 150 200 250 300 350 400 450 500 550 600 650 700 750 800 850 900 950 1000 1050 1100 1150 1200 1250 1300 1350 1400 1450 1500 Number of Iceberg Sightings (Lower Edge of Interval Shown)
Number of Cases
______________________________________________________________________________________
Iceberg Sightings for the Grand Banks and Area for November Based Only on IIP Data
0 5 10 15 20 25 30 35 40 45 0 50 100 150 200 250 300 350 400 450 500 550 600 650 700 750 800 850 900 950 1000 1050 1100 1150 1200 1250 1300 1350 1400 1450 1500 Number of Iceberg Sightings (Lower Edge of Interval Shown)
Number of Cases
Figure E.23 November
Iceberg Sightings for the Grand Banks and Area for December Based Only on IIP Data
0 5 10 15 20 25 30 35 40 45 0 50 100 150 200 250 300 350 400 450 500 550 600 650 700 750 800 850 900 950 1000 1050 1100 1150 1200 1250 1300 1350 1400 1450 1500 Number of Iceberg Sightings (Lower Edge of Interval Shown)
Number of Cases
______________________________________________________________________________________
Iceberg Sightings for the Grand Banks and Area for January Based Only on All Data
0 10 20 30 40 50 60 70 80 90 100 110 120 130 140 150 0 50 100 150 200 250 300 350 400 450 500 550 600 650 700 750 800 850 900 9501000 1050 1100 1150 1200 1250 1300 1350 1400 1450 1500 Number of Iceberg Sightings (Lower Edge of Interval Shown)
Number of Cases
Figure E.25 January
Iceberg Sightings for the Grand Banks and Area for February Based Only on All Data
0 10 20 30 40 50 60 70 80 90 100 110 120 130 140 150 0 50 100 150 200 250 300 350 400 450 500 550 600 650 700 750 800 850 900 9501000 1050 1100 1150 1200 1250 1300 1350 1400 1450 1500 Number of Iceberg Sightings (Lower Edge of Interval Shown)
Number of Cases
______________________________________________________________________________________
Iceberg Sightings for the Grand Banks and Area for March Based Only on All Data
0 10 20 30 40 50 60 70 80 90 100 110 120 130 140 150 0 50 100 150 200 250 300 350 400 450 500 550 600 650 700 750 800 850 900 9501000 1050 1100 1150 1200 1250 1300 1350 1400 1450 1500 Number of Iceberg Sightings (Lower Edge of Interval Shown)
Number of Cases
Figure E.27 March
Iceberg Sightings for the Grand Banks and Area for April Based Only on All Data
0 10 20 30 40 50 60 70 80 90 100 110 120 130 140 150 0 50 100 150 200 250 300 350 400 450 500 550 600 650 700 750 800 850 900 9501000 1050 1100 1150 1200 1250 1300 1350 1400 1450 1500 Number of Iceberg Sightings (Lower Edge of Interval Shown)
Number of Cases
______________________________________________________________________________________
Iceberg Sightings for the Grand Banks and Area for May Based Only on All Data
0 10 20 30 40 50 60 70 80 90 100 110 120 130 140 150 0 50 100 150 200 250 300 350 400 450 500 550 600 650 700 750 800 850 900 9501000 1050 1100 1150 1200 1250 1300 1350 1400 1450 1500 Number of Iceberg Sightings (Lower Edge of Interval Shown)
Number of Cases
Figure E.29 May
Iceberg Sightings for the Grand Banks and Area for June Based Only on All Data
0 10 20 30 40 50 60 70 80 90 100 110 120 130 140 150 0 50 100 150 200 250 300 350 400 450 500 550 600 650 700 750 800 850 900 9501000 1050 1100 1150 1200 1250 1300 1350 1400 1450 1500 Number of Iceberg Sightings (Lower Edge of Interval Shown)
Number of Cases
______________________________________________________________________________________
Iceberg Sightings for the Grand Banks and Area for July Based Only on All Data
0 10 20 30 40 50 60 70 80 90 100 110 120 130 140 150 0 50 100 150 200 250 300 350 400 450 500 550 600 650 700 750 800 850 900 9501000 1050 1100 1150 1200 1250 1300 1350 1400 1450 1500 Number of Iceberg Sightings (Lower Edge of Interval Shown)
Number of Cases
Figure E.31 July
Iceberg Sightings for the Grand Banks and Area for August Based Only on All Data
0 10 20 30 40 50 60 70 80 90 100 110 120 130 140 150 0 50 100 150 200 250 300 350 400 450 500 550 600 650 700 750 800 850 900 9501000 1050 1100 1150 1200 1250 1300 1350 1400 1450 1500 Number of Iceberg Sightings (Lower Edge of Interval Shown)
Number of Cases
______________________________________________________________________________________
Iceberg Sightings for the Grand Banks and Area for September Based Only on All Data
0 10 20 30 40 50 60 70 80 90 100 110 120 130 140 150 0 50 100 150 200 250 300 350 400 450 500 550 600 650 700 750 800 850 900 9501000 1050 1100 1150 1200 1250 1300 1350 1400 1450 1500 Number of Iceberg Sightings (Lower Edge of Interval Shown)
Number of Cases
Figure E.33 September
Iceberg Sightings for the Grand Banks and Area for October Based Only on All Data
0 10 20 30 40 50 60 70 80 90 100 110 120 130 140 150 0 50 100 150 200 250 300 350 400 450 500 550 600 650 700 750 800 850 900 9501000 1050 1100 1150 1200 1250 1300 1350 1400 1450 1500 Number of Iceberg Sightings (Lower Edge of Interval Shown)
Number of Cases
______________________________________________________________________________________
Iceberg Sightings for the Grand Banks and Area for November Based Only on All Data
0 10 20 30 40 50 60 70 80 90 100 110 120 130 140 150 0 50 100 150 200 250 300 350 400 450 500 550 600 650 700 750 800 850 900 9501000 1050 1100 1150 1200 1250 1300 1350 1400 1450 1500 Number of Iceberg Sightings (Lower Edge of Interval Shown)
Number of Cases
Figure E.35 November
Iceberg Sightings for the Grand Banks and Area for December Based Only on All Data
0 10 20 30 40 50 60 70 80 90 100 110 120 130 140 150 0 50 100 150 200 250 300 350 400 450 500 550 600 650 700 750 800 850 900 9501000 1050 1100 1150 1200 1250 1300 1350 1400 1450 1500 Number of Iceberg Sightings (Lower Edge of Interval Shown)
Number of Cases
______________________________________________________________________________________
APPENDIX F ICEBERG SIGHTING RESULTS FOR THE OIL DEVELOPMENT AREA IN THE GRAND BANKS
Search Area: Latitude: N46° to N47.5° Inclusive Longitude: W47.5° to W49.5° Inclusive
______________________________________________________________________________________
F.1 Number of Icebergs Sighted By Month and Year
Iceberg Sightings in January 1820 - 2001
Grand Banks, Latitude 46ºN to 47.5ºN, Longitude 47.5ºW to 49ºW
0 100 200 300 400 500 600 700 800 900 1000 1100 1200 1300 1400 1820 1830 1840 1850 1860 1870 1880 1890 1900 1910 1920 1930 1940 1950 1960 1970 1980 1990 2000 Year Number of Sightings Historical Data, 1820 - 1959 IIP Data All Data Only IIP Data Available for this Year
Figure F.1 January
Iceberg Sightings in February 1820 - 2001
Grand Banks, Latitude 46ºN to 47.5ºN, Longitude 47.5ºW to 49ºW
0 100 200 300 400 500 600 700 800 900 1000 1100 1200 1300 1400 1820 1830 1840 1850 1860 1870 1880 1890 1900 1910 1920 1930 1940 1950 1960 1970 1980 1990 2000 Year Number of Sightings Historical Data, 1820 - 1959 IIP Data All Data Only IIP Data Available for this Year
______________________________________________________________________________________ 1820 - 2001
Grand Banks, Latitude 46ºN to 47.5ºN, Longitude 47.5ºW to 49ºW
0 100 200 300 400 500 600 700 800 900 1000 1100 1200 1300 1400 1820 1830 1840 1850 1860 1870 1880 1890 1900 1910 1920 1930 1940 1950 1960 1970 1980 1990 2000 Year Number of Sightings Historical Data, 1820 - 1959 IIP Data All Data Only IIP Data Available for this Year
Figure F.3 March
Iceberg Sightings in April 1820 - 2001
Grand Banks, Latitude 46ºN to 47.5ºN, Longitude 47.5ºW to 49ºW
0 100 200 300 400 500 600 700 800 900 1000 1100 1200 1300 1400 1820 1830 1840 1850 1860 1870 1880 1890 1900 1910 1920 1930 1940 1950 1960 1970 1980 1990 2000 Year Number of Sightings Historical Data, 1820 - 1959 IIP Data All Data Only IIP Data Available for this Year
______________________________________________________________________________________ Iceberg Sightings in May
1820 - 2001
Grand Banks, Latitude 46ºN to 47.5ºN, Longitude 47.5ºW to 49ºW
0 100 200 300 400 500 600 700 800 900 1000 1100 1200 1300 1400 1820 1830 1840 1850 1860 1870 1880 1890 1900 1910 1920 1930 1940 1950 1960 1970 1980 1990 2000 Year Number of Sightings Historical Data, 1820 - 1959 IIP Data All Data Only IIP Data Available for this Year
Figure F.5 May
Iceberg Sightings in June 1820 - 2001
Grand Banks, Latitude 46ºN to 47.5ºN, Longitude 47.5ºW to 49ºW
0 100 200 300 400 500 600 700 800 900 1000 1100 1200 1300 1400 1820 1830 1840 1850 1860 1870 1880 1890 1900 1910 1920 1930 1940 1950 1960 1970 1980 1990 2000 Year Number of Sightings Historical Data, 1820 - 1959 IIP Data All Data Only IIP Data Available for this Year
______________________________________________________________________________________ Iceberg Sightings in July
1820 - 2001
Grand Banks, Latitude 46ºN to 47.5ºN, Longitude 47.5ºW to 49ºW
0 100 200 300 400 500 600 700 800 900 1000 1100 1200 1300 1400 1820 1830 1840 1850 1860 1870 1880 1890 1900 1910 1920 1930 1940 1950 1960 1970 1980 1990 2000 Year Number of Sightings Historical Data, 1820 - 1959 IIP Data All Data Only IIP Data Available for this Year
Figure F.7 July
Iceberg Sightings in August 1820 - 2001
Grand Banks, Latitude 46ºN to 47.5ºN, Longitude 47.5ºW to 49ºW
0 100 200 300 400 500 600 700 800 900 1000 1100 1200 1300 1400 1820 1830 1840 1850 1860 1870 1880 1890 1900 1910 1920 1930 1940 1950 1960 1970 1980 1990 2000 Year Number of Sightings Historical Data, 1820 - 1959 IIP Data All Data Only IIP Data Available for this Year
______________________________________________________________________________________ Iceberg Sightings in September
1820 - 2001
Grand Banks, Latitude 46ºN to 47.5ºN, Longitude 47.5ºW to 49ºW
0 100 200 300 400 500 600 700 800 900 1000 1100 1200 1300 1400 1820 1830 1840 1850 1860 1870 1880 1890 1900 1910 1920 1930 1940 1950 1960 1970 1980 1990 2000 Year Number of Sightings Historical Data, 1820 - 1959 IIP Data All Data Only IIP Data Available for this Year
Figure F.9 September
Iceberg Sightings in October 1820 - 2001
Grand Banks, Latitude 46ºN to 47.5ºN, Longitude 47.5ºW to 49ºW
0 100 200 300 400 500 600 700 800 900 1000 1100 1200 1300 1400 1820 1830 1840 1850 1860 1870 1880 1890 1900 1910 1920 1930 1940 1950 1960 1970 1980 1990 2000 Year Number of Sightings Historical Data, 1820 - 1959 IIP Data All Data Only IIP Data Available for this Year