HAL Id: hal-02929360
https://hal.archives-ouvertes.fr/hal-02929360v2
Submitted on 13 Jan 2021HAL is a multi-disciplinary open access archive for the deposit and dissemination of sci-entific research documents, whether they are pub-lished or not. The documents may come from teaching and research institutions in France or abroad, or from public or private research centers.
L’archive ouverte pluridisciplinaire HAL, est destinée au dépôt et à la diffusion de documents scientifiques de niveau recherche, publiés ou non, émanant des établissements d’enseignement et de recherche français ou étrangers, des laboratoires publics ou privés.
David Cluet, Ikram Amri, Blandine Vergier, Jérémie Léault, Astrid Audibert,
Clémence Grosjean, Dylan Calabrési, Martin Spichty
To cite this version:
David Cluet, Ikram Amri, Blandine Vergier, Jérémie Léault, Astrid Audibert, et al.. A Quantitative Tri-fluorescent Yeast Two-hybrid System: From Flow Cytometry to In cellula Affinities. Molecular and Cellular Proteomics, American Society for Biochemistry and Molecular Biology, 2020, 19 (4), pp.701-715. �10.1074/mcp.TIR119.001692�. �hal-02929360v2�
A quantitative tri-fluorescent yeast two-hybrid system:
from flow cytometry to in-cellula affinities
David Cluet, Ikram Amri, Blandine Vergier, Jérémie Léault, Astrid Audibert, Clémence Grosjean, Dylan Calabresi, and Martin Spichty#
Laboratoire de Biologie et de Modélisation de la Cellule, Ecole Normale Supérieure de Lyon, CNRS, Université Lyon 1, Université de Lyon; 46 allée d’Italie; 69364 Lyon cedex 07; France.
#) corresponding author. Phone: +33 472 72 8645; Email: [email protected].
Keywords
Yeast 2 Hybrid, Protein-Protein interactions, Affinity, Fluorescence, Flow cytometry, Computational Biology
Abbreviations
PPIs, Protein-Protein interactions; qY2H, quantitative yeast two-hybrid; BD-Bait, DNA Binding Domain fused to the Bait; AD-Prey, Activation Domain fused to the Prey; ATS, Affinity Test Set; STS, Specificity Test Set; RRS, Random Reference Set.
Abstract
We present a technological advancement for the estimation of the affinities of Protein-Protein Interactions (PPIs) in living cells. A novel set of vectors is introduced that enables a quantitative yeast two-hybrid system based on fluorescent fusion proteins. The vectors allow simultaneous quantification of the reaction partners (Bait and Prey) and the reporter at the single-cell level by flow cytometry. We validate the applicability of this system on a small but diverse set of PPIs (eleven protein families from six organisms) with different affinities; the dissociation constants range from 117 pM to 17 µM. After only two hours of reaction, expression of the reporter can be detected even for the weakest PPI. Through a simple gating analysis, it is possible to select only cells with identical expression levels of the reaction partners. As a result of this standardization of expression levels, the mean reporter levels directly reflect the affinities of the studied PPIs. With a set of PPIs with known affinities, it is straightforward to construct an affinity ladder that permits rapid classification of PPIs with thus far unknown affinities. Conventional software can be used for this analysis. To permit automated analysis, we provide a graphical user interface for the Python-based FlowCytometryTools package.
Introduction
Protein-protein interactions (PPIs) are essential for many functions in living cells, including communication of signals, modulation of enzyme activity, active transportation, or stabilization of the cell structure by the cytoskeleton (1–4). Resolving the complex cellular network of PPIs remains one of the major challenges in proteomics (5). Thus, the quest for reliable methods that identify PPIs and quantify their strength is unbroken.
The yeast two-hybrid technique (Y2H) is a commonly used approach to probe the interaction between proteins (6–8). In contrast to biochemical in-vitro methods (such as mass spectrometry, ITC or SPR) that require purified proteins, Y2H is based on a genetic assay. It relies on the in-cellula expression of fusions of the two proteins of interest, usually named Bait and Prey. Upon physical interaction of Bait and Prey, a functional transcription factor is reconstituted that drives the expression of a reporter gene (e.g., -galactosidase). As a consequence, a read-out is observed (e.g., color, fluorescence, or growth) that permits high-throughput screens; see for example Refs. (9, 10).
Y2H has been extensively used in the past decades to decipher PPI networks (11, 12). With growing experience, the scientific community became aware of the limitations of this approach. Standard Y2H is prone to false positive/negative results (8). For example, the absence of a detectable read-out may reflect insufficient expression of the Bait and/or Prey. More laborious Western blottings can be performed to verify the expression (13). Furthermore, Y2H provides often only a qualitative result. With X-gal-based Y2H (14), for instance, the measured read-out (color) cannot be assumed to be proportional to the reporter level, i.e., -galactosidase activity, but exceptions exist (15, 16). Also, the extent of -galactosidase activity does not necessarily reflect
the extent of interaction between Bait and Prey (due to varying expression levels of Bait and Prey fusions). Furthermore, steric effects due to the auxiliary domains BD and AD fused to the Bait and Prey, respectively, may influence the accessibility of the binding interface and thereby alter the interaction strength (13).
Several groups tried to overcome the qualitative limitations of the two-hybrid system in yeast and other organisms. Extensive overviews can be found in the literature, for example Ref. (8). Many applied methods could rank PPIs according to their affinity using the quantified read-out, examples are included in Refs. (13, 15, 17, 18, 10, 19). It should be noted, however, that mainly mutants were compared. Similar expression levels for the Bait and Prey fusions can be assumed for such mutational studies. Comparing proteins from different families often breaks the correlation (13). It speaks to the need of quantifying not only the read-out but the Bait and Prey fusions as well. Thus far, only low-throughput methods exist that address this simultaneous quantification. For example, by measuring the fraction of co-localized fluorescent “Bait” and “Prey” fusions in human cells by high-resolution microscopy (20) it was possible to increase the affinity of an inhibitor (21). Another approach used a fluorescent antibody to quantify the amount of retained Prey by the Bait associated to the periplasm (22). Following this idea, different yeast surface two-hybrid approaches emerged (18, 23) using antibodies or purified proteins.
Here, we present a novel set of Y2H vectors that enable the detection of the reaction partners (Bait and Prey), and the reporter without the need of any antibodies or purified proteins (Fig. 1). Three different fluorescent proteins serve as sensors to probe the cellular expression levels. Thus far, the use of fluorescent proteins in yeast-two hybrid was restricted to either the detection of the Bait or/and Prey proteins (19, 24), or the quantification of the reporter (9, 17, 18, 25). Our quantitative yeast two-hybrid (qY2H) approach permits for the first time the simultaneous quantification of the three proteins at the single cell level by flow cytometry. The new vectors were
tested on a set of well-studied protein-protein interactions (26–37). To encompass the sensitivity of the qY2H approach, we selected PPIs that span a wide range of affinities (known from independent in-vitro experiments), ranging from 117 pM to 17 µM. Finally, we challenged the qY2H system on a set of 59 potential negative controls to test its specificity.
Experimental procedures
Experimental design
Starting from the original high copy (2 plasmids pLexA and pB42AD (38), several new multiple cloning sites (MCS) were introduced that permit convenient sub-cloning into the expression cassettes via homologous recombination in yeast or Gibson assembly cloning (see Suppl. Fig. S1 for detailed vector maps). Thus, the newly designed vectors facilitate the construction of novel fusion proteins with tailored functionalities. Here we generated cassettes that code for BD-Bait, AD-Prey and reporter fusions with several new features as shown in Fig. 1. We copied the HA tag (that was originally only in the AD-Prey expression cassette) to the BD-Bait cassette to enable the simultaneous quantification of expressed BD-Bait and AD-Prey fusions by Western Blotting. In addition, we added red and green fluorescent tags (Tag RFP and yEGFP) to the BD-Bait and AD-Prey cassettes, respectively. Furthermore, the original reporter (-galactosidase) was replaced by a tandem of the Tag-BFP in the 2 pSH18-34 vector (38). The tandem arrangement of fluorescent proteins is a common strategy to obtain brighter reporters (39, 40). The three fluorescent tags emit at considerably different wavelength ranges so that their individual expression levels can be simultaneously monitored at the single-cell level by flow cytometry (Fig. 1B). In addition, a spacer sequence was inserted between the fluorescent tags and the Prey/Bait to reduce potential steric hindrance in the expressed fusions.
To perform the qY2H assay, haploid cells were transformed with either Prey or Bait plasmids; in the latter case we used haploid cells that were previously transformed with the reporter plasmid. Transformed yeast cells were mated and amplified to generate diploid cultures for the desired BD-Bait / AD-Prey couples or controls (see below). Selection and amplification of the diploids occurred in glucose medium which represses the expression of the AD-Prey fusion (under the control of the GAL1 promoter). Transfer of the diploid cells into Galactose/Raffinose medium induced the expression of the AD-Prey fusion and enabled the expression of the reporter.
The reaction was stopped by fixation. The samples were then submitted to flow cytometry measurements to monitor the fluorescence intensities at the single cell level for three different channels matching the emission ranges of the fluorescent BD-Bait, AD-Prey and reporter fusions; hereafter these channels are named Tag-RFP-H, yEGFP-H and Tag-BFP-H, respectively.
We analyzed the expression level of the fluorescent proteins either for the entire cell population (to which refer as “global” hereafter) or for subpopulations using interval gatings.
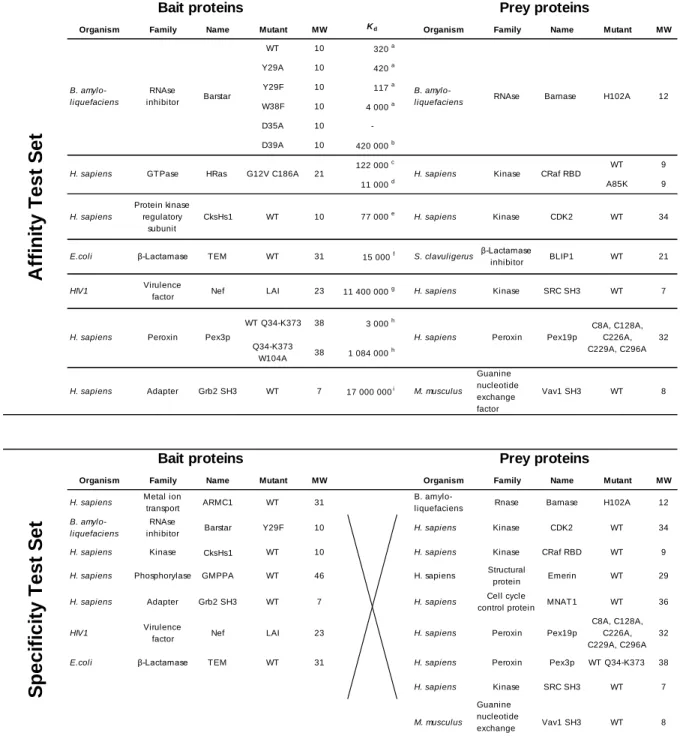
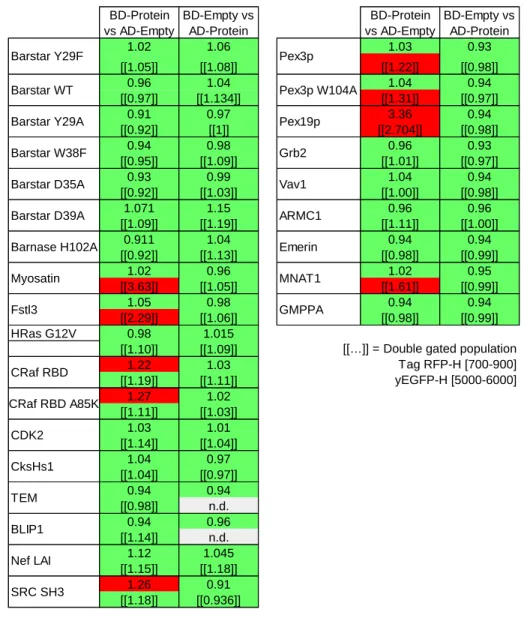
The qY2H approach was validated on the set of PPIs with known in-vitro affinity given in Table 1 (Affinity Test Set, ATS). First, the auto-activation potential of each protein was determined when used as Bait or Prey. Therefore, the constructs BD-Bait or AD-Prey were tested in combination with proper controls, i.e., AD-Empty and BD-Empty fusions, respectively. The term “Empty” indicates that no coding sequence was fused to the fluorescent BD or AD. If a given BD-Bait fusion protein (paired with AD-Empty) yielded a significantly higher auto-activation than the pair BD-Empty / AD-Empty (named CTRL hereafter), it was not considered suitable for further investigations (see subsection “Statistical analyses” of the “Experimental procedures”). The same test was carried out for the AD-Prey fusion proteins (paired with BD-Empty).
By exchanging Bait and Prey for a given couple it is possible to probe the corresponding PPI in two different orientations. It is known that the two orientations may lead to different
read-outs (13). As a second filter (after the auto-activation filter), we measured therefore for each couple the reporter level for both orientations (see Suppl. Fig. S2 & Suppl. Data 1). Table 1 lists the couples in the orientation with the stronger reporter level (when the cellular contents of BD-Bait and AD-Prey are standardized, see below). This orientation is considered as the molecular configuration with the higher accessibility of the PPI binding interface (13). In other words, this orientation may feature the smaller steric hindrance due to the fused fluorescent BD and AD and probably resembles more closely the situation of free (not fused) proteins. We focus therefore in the following sections on the orientation given in Table 1.
The entire procedure starting from the transformation up to the flow cytometry measurement was repeated at least three times for each protein-protein interaction with known affinity of Table 1.
Often the specificity of Y2H methods is evaluated on a Random Reference Set (RRS) (41, 42). Such sets contain protein pairs unlikely to interact with affinities on the order of those in the ATS. Our qY2H assay was tested on a set of 59 pairs that were obtained by cross-testing a sub-selection of BD-Bait and AD-Prey fusions (from the ATS and from the RRS of Ref. 41). These fusions were selected based on the following two criteria: 1) avoiding fusions with an auto-activating phenotype, and 2) avoiding fusions with low expression level like BD-HRAS and AD-BLIP. With such weakly expressed fusions, we would risk that there are no cells available for the required analysis (as we have experienced in certain experiments, see for example AD-BLIP in Table 2). For some proteins, both criteria are fulfilled when used as BD-Bait and as AD-Prey fusion. In this case, we took the fusion that leads to the higher reporter level when tested in the Affinity Set. For example, Barnase was used as Prey because the couple BD-Barstar / AD-Barnase yields the higher reporter level than BD-AD-Barnase / AD-Barstar. This was done to minimize steric effect issues (see above).
The STS includes the pairs ARMC1 /Emerin and GMPPA / MNAT1 from the RRS of Ref. 41. These pairs were previously tested with 2 plasmids in GAL4 Y2H systems (41, 42). The orientation BD-Emerin / AD-ARMC1 yielded a positive signal in three assays out of nine. In the reverse orientation however, the result was negative in all assays (42). The couple BD-MNAT1 / AD-GMPPA produced different results depending on the experimental approach (41, 42). We wanted to monitor the behavior of these ambiguous couples in our qY2H system. We tested them in both orientations. In the Specificity Test Set (STS), we included the orientation with the higher reporter level in our qY2H system.
Creation of plasmids
In order to generate the pSB_1Bait plasmid, the pLexA (38) vector was linearized using
EcoRI and SalI (Thermo Scientific) to remove all DNA between the LexA cDNA and the ADH
terminator. The Barstar WT coding sequence was ordered for synthesis to Eurofin Genomics as part of a new expression cassette. At the 5’ end we added the sequences of the HA-Tag and our MCS-spacer (EcoRI, AscI, and XhoI). At the 3’ end, after the stop codon of Barstar, we inserted one XhoI site, created 3 stop codons (1 per ORF) and regenerated the SalI site. The upstream (LexA) and downstream (Terminator) 30bp required for homologous recombination in yeasts (43, 44) were also added. This new optimized expression cassette was amplified by PCR (Phusion DNA polymerase, Thermo Scientific), using the primers primSB_0001 and 2 (see Suppl. Table S1), and inserted in the previously linearized pLexA vector. As a result, we obtained the pSB_1Bait_Barstar. The coding sequence for Tag-RFP was subsequently introduced in the EcoRI site through PCR from pTag_RFP-Actin (Evrogen), using the primers primSB_0003 and 0004, combined with homologous recombination in yeasts to obtain the pSB_1Bait_RFP-Barstar plasmid. The
pSB_1Bait_RFP-Empty and pSB_1Bait-Empty vectors were generated by digesting the pSB_1Bait_RFP-Barstar and pSB_1Bait_Barstar, respectively, with XhoI (Thermo Scientific), followed by self-ligation.
To create the pSB_1Prey vector, the pB42AD plasmid (38) was linearized using EcoRI and
XhoI. The sequence coding for the non-toxic Barnase mutant H102A was ordered from Operon
MWG. At the 5’ end we inserted the same MCS-spacer sequence as in the pSB_1Bait vector to allow easy transfer from one plasmid to the other. At the 3’ end, we inserted one XhoI site, created 3 stop codons and one NcoI restriction site. The upstream (HA-Tag) and downstream (Terminator) 30bp required for homologous recombination in yeasts were also introduced. This new expression cassette was then amplified by PCR (primSB_0010 and 0011) and inserted in the pB42AD by homologous recombination in yeast to obtain the pSB_1Prey_Barnase-H102A vector. The coding sequence of the yEGFP was amplified from the pGY-LexA-GFP_KanMX (kindly provided by Dr Gaël Yvert) using the primers primSB_0012 and 0013, and then introduced in the EcoRI sit of our MCS as previously to generate the pSB_1Prey_yEGFP-Barnase-H102A vector. The pSB_1Prey-Empty and pB_1Prey_yEGFP-pSB_1Prey-Empty were created by removing the coding sequence of Barnase H102A with XhoI and performing a self-ligation.
The coding sequences of the mutants of Barstar, Ras G12V C186A, TEM, Nef LAI, and CDK2 were ordered to Eurofin Genomics, with extensions for the pSB_1Bait_RFP vector, when those of CRaf RBD WT, CRaf RBD A85K, BLIP1, SRC SH3, and CksHs1 were ordered with extensions for the pSB_1Prey_yEGFP plasmid. The sequences for ARMC1 and Emerin were obtained from a Jurkat cells cDNA library (kindly provided by Dr Emiliano Ricci). All coding sequences were then introduced in the XhoI linearized pSB_1Bait_RFP and pSB_1Prey_yEGFP plasmids using the primers presented in Suppl. Table S1. The sequences for Pex3p Q34-K373, Pex3p Q34-K373 W104A, Pex19p (C8A, C128A, C226A, C229A, C296A), MAT1, GMPPA,
Grb2 SH3 and Vav1 SH3 were synthetized and cloned into the pSB_1Bait_RFP and pSB_1Prey_yEGFP by Eurofin Genomics. All our constructions were validated by sequencing (GATC Biotech).
To create the reporter plasmid, the pSH18-34 (38) was digested using the unique SalI (In the modified Gal1 promoter) and RsrII (downstream to the -Galactosidase coding sequence) restriction sites. We subsequently reconstructed the expression cassette using four PCR products: 1) The Gal1 promoter delta Gal4 with 8 operator LexA and the Kozack sequence with a new downstream MCS (AscI, NheI) (primSB_0076 and 0077).
2) The Gal1 Nterm sequence (I10-C20), originally expressed by the pSH18-34, is used as spacer (primSB-0078 and 0079) between the two copies of the Tag-BFP.
3) The coding sequence of the Tag-BFP (from pTag_BFP-Actin, Evrogen) bordered with 2 XhoI sites, (primSB_0084 and 0085).
4) The terminator sequence (primSB_0080 and 0081).
These 4 amplicons were then used to perform directly a gap repair in yeasts. Thus, we obtained the pSB_3RO plasmid. A second copy of the Tag-BFP (primSB_0120 and 121) was inserted in our new NheI site (Thermo Scientific), by homologous recombination to generate the pBFP2 plasmid. This final vector allows the expression of a dimer of Tag-BFP as reporter of the yeast two hybrid reaction. Final quality control was performed by sequencing (GATC Biotech).
Western blot
Total protein extracts were obtained from 6 OD590nm exponentially growing diploids yeasts
as previously described (45) into 60 µl of sample buffer. Ten microliters were used for SDS-Page analysis on Bolt™ 4-12% Bis-Tris Plus Gels (Thermo Scientific). Electrophoresis separation was
performed in NuPAGE™ MOPS SDS Running Buffer (Thermo Scientific). Proteins were then transferred on a Nitrocellulose Membrane 0.45 µm (Biorad), using a Trans-Blot® Turbo™ Transfer System (Biorad) for 14 minutes, at 1 A and 25 V. The membrane was subsequently blocked 1 hour at room temperature in PBS + tween 0.2 % (v/v) supplemented with 5 % (w/v) low-fat milk powder. HA tagged proteins were labeled overnight at 4°C with the mouse HA.11 Clone 16B12 Monoclonal Antibody (Eurogentec) diluted 1/2000 in PBS + tween 0.2 % (v/v) + 10 mg/ml BSA (Albumin bovine fraction V, Euromedex). The membrane was then washed four times seven minutes in blocking buffer at room temperature. The membrane was then incubated for one hour at room temperature in presence of a sheep anti-mouse whole IgG HRP (GE Healthcare) secondary antibody diluted 1/5000 in blocking buffer. The excess of antibody was removed with two washing steps of five minutes in PBSt at room temperature. Labelled proteins were then revealed with Super Signal West Pico chemiluminescent substrate (Thermo Scientific) using a Biorad Chemidoc apparatus, following instructions provided by the suppliers.
qY2H in liquid phase
Chemo-competent EGY42 (MATa; trp1, his3, ura3, leu2) and TB50 (MATα; trp1, his3, ura3, leu2, rme1) yeasts were generated as previously described (46).
Competent EGY42a yeasts were transformed with 1µg of pBFP2 and grown on selective SD-U medium. Chemo-competent EGY42a pBFP2 yeasts were then generated and transformed with 1 µg of Bait vectors. Haploid Bait yeast strains were then selected on SD-UH medium. Competent TB50α yeasts were transformed with 1 µg of Prey vector. Haploid Prey yeast strains were selected on SD-W medium. Matrix mating assay were performed for one night with 50 µl of Bait and Prey strains (each) resuspended in YPAD medium at 0.1 OD at 30°C. The next morning YPAD medium was removed and the yeast diploids were harvested and amplified in 1ml of
SD-UHW for 3 days at 30°C.
The qY2H assay was performed in pre-heated (30°C) and oxygenated SGR-UHW supplemented with Galactose 0.25 % (Euromedex) and Raffinose 1% (Sigma-Aldrich) to induce the expression of the Prey proteins. To ensure we obtained an excessive number of cells (about 107) for the analysis, a culture of 100 ml was inseminated with 600 µl of saturated diploids per couple of interest. It turned out that for a typical analysis a number of 106 cells is adequate, so that
actually 10 times smaller cultures and insemination volumes can be used. The yeasts were incubated for 2 h at 30°C without shaking.
The qY2H reaction was stopped by fixating the yeasts with PFA. Cultures were centrifuged for 10 min at 1000 g, and the yeast were resuspended in 1ml PBS (Dominique Dutscher) and transferred into 1.5 ml tubes. After a centrifugation step of 1 min at 13000 rpm, cells were washed again with 1 ml of PBS. The yeasts were resuspended in 500 µl of PBS 4 % PFA (Sigma-Aldrich, Catalog n°P6148) and incubated for 10 min at 4°C. The fixation reaction was blocked by 2 washing steps with 1 ml PBS, and one incubation of 15 min at 4°C in 500 µl of PBS 0.1 M Glycine (Euromedex). Finally, the yeasts were washed twice in PBS, and stored in 1ml of PBS at 4°C for not longer than 24 hours.
Flow cytometry
The expression levels of BD-Bait, AD-Prey and reporter were acquired in linear scale using a MacsQuant VYB flow cytometer (the settings are presented in Suppl. Table S2), when the lasers reached stable temperature. Calibration beads (Mylteni Biotech, Catalog n°130-093-607) were used prior to all experiments. To ensure homogeneous sampling of the yeasts cells in suspension, we used the strong mixing mode. With the apparatus at our disposal, this mode generates at very early acquisition times a small population of particles with abnormal characteristics for yeast cells
(a high red fluorescence intensity, even for non-fluorescent samples). We suspect these are micro-bubbles. To rigorously eliminate this population, we skipped the first 20 000 events of all samples files in the subsequent analysis.
Data analyses
The flow-cytometry files were analyzed using the FlowCytometryTools package for python (http://eyurtsev.github.io/FlowCytometryTools). For visualization purposes, the hlog-transformation (47) was applied to the signals of the channels TagRFP-H, EGFP-H, TagBFP-H with the following settings: b = 1000, r = 10000, and d = 5.4. The transformed values were then visualized as 2-dimensional scatter plots using the built-in function of FlowCytometryTools (Fig. 2) or as 1-dimensional probability distribution functions (PDFs) using the package matplotlib (Fig. 4). The PDFs correspond to histograms generated with the package NumPy (using 50 bins), normalized so the integral over the range -1000 to 10000 is 1.
To quantify the reporter level, we calculated the mean value of the Tag-BFP-H channel, <Tag-BFP-H>, either for the entire population of cells or for double-gated subpopulations. Values of double-gated subpopulations are indicated by double square brackets, [[…]]. If not specified differently, the two gates are: 700 < Tag RFP-H < 900; 5000 < EGFP-H < 6000. The choice of the gates is explained in the section “Recommendations”.
To ensure that <H> is not dominated by the highest, sparsely sampled Tag-BFP-H values, we checked that the cumulative mean formed a plateau (Fig. 4 & 5). For this purpose, a histogram of Tag-BFP-H values within the range 0-50000 (on a linear scale) was generated using 25 bins. The histogram value of bin i (i.e., number of events in bin i) and its lower edge are given by Ni andli, respectively. The bins are ordered so that li < li+1. With the aid of this histogram, the
cumulative mean of the reporter level was plotted with the package matplotlib for increasing values of 𝑙𝑖:
Eq. 1 where Ntot is the total number of events within the data range 0-50000 for the given sample. For
li→infinity, the cumulative mean approaches the population mean but it remains slightly smaller
due to binning issues. We provide a Python based program with a graphical user interface that automates the calculation of the cumulative mean for large datasets (see section data availability). With this program, the analysis can also be performed with double-gated subpopulations.
Statistical analyses
We consider an auto-activation level of a sample as significant when the relative reporter level with respect to the BD-Empty / AD-Empty control (CTRL sample) is larger than two times the relative standard deviation of the control sample,
Eq. 2 The relative sample standard deviation is given by
Eq. 3 where s is the sample standard deviation and is the mean value <Tag-BFP-H> averaged over all
available experiments; in the case of the CTRL sample we have 12 independent experiments. The sample standard deviation is given by
Cumulative mean 𝑙𝑖 = 1 𝑁tot 𝑙𝑗 𝑁𝑗 𝑖 𝑗 =1 TagBFP − H sample TagBFP − H CTRL − TagBFP − H CTRL TagBFP − H CTRL > 2𝑠rel TagBFP − H sample TagBFP − H CTRL > 1 + 2𝑠rel 𝑠rel = 𝑠 𝜇
Eq. 4 where <Tag-BFP-H>i is the Tag-BFP-H population mean of the i-th experiment; n is the total
number of experiments.
All interactions of Table 1 were classified into four different categories according to their reporter level relative to the CTRL sample. The first category contains interactions with a relative reporter level within a margin of 1 srel of the CTRL sample; the last category embeds the
interactions with a margin larger than 3 srel.
The magnitude of the reporter level varied between different repetitions of the experiment. This is probably due to differences in the transformation efficiency between different batches of competent yeast cells (see Suppl. Fig. S6A). Differences in transformation efficiency may lead to different copy number of the reporter plasmid. By applying the following two-point normalization, these variations could be attenuated (Suppl. Fig. S6B):
Eq. 5 By definition, the normalized mean of the CTRL sample (=background of the system) is set to 0% when the normalized mean of the couple with the highest affinity, i.e., BD-Barstar Y29F / AD-Barnase H102A, is set to 100%. This normalization procedure can be performed with our Python-based program (see Data availability section).
To test the null hypothesis that the normalized mean of a given couple is larger than the normalized mean of another couple (with lower affinity, Fig. 5B), we used a t-test with unequal variances (Welch test):
𝑠 = TagBFPH 𝑖− 𝜇
2 𝑛
𝑖=1
𝑛 − 1
Normalized mean (sample) = TagBFP − H sample − TagBFP − H CTRL TagBFP − H highest affinity − TagBFP − H CTRL
Eq. 6 where 1/2 and s1/2 are the sample means and sample standard deviations of the two couples,
respectively; the sample standard deviations are calculated with Eq. 4 (using n and of the corresponding couple). The number of experiments, n1/2, are given in Fig. 5B. The degrees of
freedom were calculated with:
q. 7
and P-values were determined for one-tailed distributions. Significant differences in mean values were annotated in Fig. 5B with one star (P < 0.1), two stars (P < 0.05) or three stars (P < 0.005).
To judge the strength of the relationship between affinity and normalized reporter level, a Spearman rank test (48) was performed by taking the difference between the order of Kd and the
order of relative reporter level. The Spearman correlation coefficient was calculated as follows:
Eq. 8 where di is the difference in order of the i-th interaction, and n is the total number of interactions.
Finally, the adjusted R2 was calculated for the fitted functions to describe the relationship between the normalized reporter level and the affinity using the following formula:
Eq. 9 where fi is the normalized reporter level of the i-th interaction when estimated with Eq. S2 (see
caption of Suppl. Fig. S10). NMi is the actual normalized reporter level and <NM> is the mean
𝑡 = 𝜇1− 𝜇2 𝑠1 𝑛1+ 𝑠2 𝑛2 𝜈 = 𝑠1 𝑛1+ 𝑠2 𝑛2 2 𝑠14 𝑛12 𝑛1− 1 + 𝑠24 𝑛22 𝑛2− 1 𝑟S= 1 − 6 𝑛𝑖=1𝑑𝑖2 𝑛(𝑛2− 1) 𝑅2= 1 − 𝑓𝑖− NM𝑖 2 𝑛 𝑖=1 NM𝑖− NM 2 𝑛 𝑖=1 𝑛 − 1 𝑛 − 𝑘 − 1
value of the actual reporter levels. The total number of tested interactions (n) and the number of parameters in Eq. S2 (k) are used to correct for the bias in the estimation of R2.
Results
Auto-activation impedes the investigation of interactions between proteins of the Peroxin family
Auto-activating BD-Bait fusion proteins are a major concern for all yeast-two hybrid approaches (49). Indeed, we detected seven BD-Bait fusion proteins with an elevated auto-activation level (Table 2); none of the AD-Prey fusions showed a significant auto-auto-activation level.
The auto-activating BD-Bait fusions were not further considered in our qY2H assay. Fortunately, the probability that both proteins of a PPI cause auto-activation as BD-Bait is rather low. Therefore, most interactions can be studied at least in one orientation. An exception is the interaction between Pex19p and Pex3p. BD-Pex9p, BD-Pex3p and BD-Pex3p W104A featured all elevated auto-activation levels. Thus, two PPIs out of 14 could not be further studied.
In our LexA-based qY2H assay with 2 plasmids the fusion BD-MNAT1 yielded an auto-activation phenotype (Table 2). Previous studies did not encounter this auto-auto-activation problem (41, 42). Thus, the addition of the Tag-RFP may increase the auto-activation potential of certain BD-Baits fusions in LexA-based systems.
qY2H enables the monitoring of the expression level of the reaction partners after 2h
Initial qY2H reactions were performed with a reduced set of PPIs (BD-Barstar / AD-Barnase H102A as well as BD-HRas G12V / AD-CRaf-RBD, and mutations thereof). Two hours after induction of the Y2H reaction, the expression of all BD-Bait and AD-Prey fusions can be easily detected. Fig. 2A displays their fluorescence intensities for a subset of couples. The
fluorescence intensity typically spans several orders of magnitude higher than the non-fluorescent controls. However, expression problems can be seen with BD-HRas (Fig. 2C), for example. Independent quantification by Western Blotting (Fig. 3) shows that the expression level of BD-HRas is indeed impaired. In fact, BD-BD-HRas cannot be detected in the Western blot. Flow cytometry, on the other hand, indicates a slight shift in the probability distribution for BD-HRas expressing cells (with respect to the negative control, see also Suppl. Fig. S3).
Thus, flow cytometry gives an immediate indication on eventual expression problems of the Bait and Prey fusions during acquisition. This contrasts with standard Y2H experiments where the expression level of the BD-Bait and AD-Prey fusions is usually unknown at the time of reporter detection. More laborious Western Blots are usually required to gain this information.
Reporter level is correlated with the expression level of the reaction partners
Even for the weakest Bait-Prey interaction, the reporter can already be detected two hours after induction. For interactions with Kd-values in the nano- to picomolar range, the gain with
respect to the CTRL sample can be clearly detected by eye (Fig. 2). For interactions with micromolar affinity, these gains are much smaller and require a numerical analysis (see below).
From the visualization of the expression levels, we observe that the reporter level (i.e., blue fluorescence intensity) is correlated with the green and red fluorescence intensity: more reaction partners (i.e., higher amount of interacting BD-Bait and AD-Prey fusions) yielded more product (reporter). This obvious correlation has consequences for the extraction of quantitative information on the strength of PPIs as we demonstrate later on. In the case of the Bait/Prey-couple BD-B112 / AD-Barnase H102A (Fig. 2F) this correlation is basically only observed for the red fluorescence (BD-Bait). The B112 acid blob acts as an activation domain (50, 51) so that this specific BD-Bait fusion is a functional transcription factor by itself that does not depend on the AD-Prey fusion.
Standardization of BD-Bait and AD-Prey levels is required to gain information on binding strength
In all repetitions of the experiment, the reporter level of the global cell population roughly reflects the magnitude of the (in-vitro) affinity. As shown in Fig. 4A for a single experiment and a small subset of PPIs, the Bait-Prey couples with high affinity (Kd ~ pM) could be easily
distinguished from medium-affinity couples (Kd ~ nM) based on their mean reporter level. It
confirms results of previous studies that the global Y2H read-out correlates with in-vitro affinity (15, 16, 13, 17, 18). In addition, our approach discloses the influence of the expression levels of the reaction partners, i.e., the BD-Bait and AD-Prey fusions. Their levels may vary significantly between the studied couples (Fig. 2 & 3) and to a smaller extent between different experiments. These variations complicate the discrimination of Bait-Prey couples based on their affinities. Fig. 4A presents a particularly illustrative experiment: The couple BD-HRas / AD-CRaf displays a 20 times lower in-vitro Kd-value than the couple BD-Barstar D39A / AD-Barnase H102A. Yet the
mean reporter level (Fig. 4A, right column) is lower for the former couple than for the latter couple; the opposite would have been expected according to the in-vitro affinities. We note, however, that the former couple exhibits a significant lower expression level of the BD-Bait fusion (Fig. 4A, left column) than the latter. Thus, can quantitative information on the strength of the interaction (i.e., relative affinities) be reliably extracted from such an experiment?
To address this question, we tried to correct for differences in the expression level by sub-selecting (gating) only cells that display a red and green fluorescence intensity within a certain narrow interval (see Fig. 4B & C). And indeed, when standardizing the red fluorescence intensity (i.e., gating for cells with similar BD-Bait expression level), the mean reporter level reflects the
in-vitro affinities for the two couples BD-HRas / AD-CRaf and BD-Barstar D39A / AD-Barnase
AD-Prey expression level and displays a weaker reporter level than expected. Standardization of the AD-Prey level corrects the reporter levels of the studied couples according to their reported
in-vitro affinities (Fig. 4C). Changing the location of the gating intervals leads to the same conclusions
(see Suppl. Fig. S4) but the number of analyzed cells can be affected. The gates used in Fig. 4 provided us with the sensitivity to easily detect the weakest PPI of the subset. Also, these gates yielded the necessary resolution to clearly separate all PPIs.
A reproducible affinity ladder can be generated for PPIs with a Kd between 100 pM and 20 M
To setup our qY2H system, we used a reduced set of PPIs (Fig. 2 & 4). For these setup experiments, exhaustive samples sizes of ten million cells were cultured, induced and analyzed. To improve the throughput, we determined the minimal number of cells required to achieve a robust estimate of the reporter level. It turned out that a subsample of at least one million cells is required (see Suppl. Fig. S5) to match the result of the entire sample.
Finally, we challenged the previously defined settings (two hours of reaction, one million cells and the standardization gates of Fig. 4) with the eleven PPIs of the Affinity Test Set . As a result, we obtained the affinity ladder of Fig. 5A where the couples are ordered accordingly to their measured in-vitro affinity. An exception is the couple BD-TEM / AD-BLIP1 that is ranked too low. The results for the couple BD-CksHs1 / AD-CDK2 are missing in Fig. 5A. This couple was added during the revision of this article; the results are presented Fig. 5B.
The ordering of the couples does not change when different repetitions of the experiment are compared (Suppl. Fig. S7A). An exception is again the couple BD- TEM / AD-BLIP that displays a high variability. Also, couples with very similar affinities (i.e., BD-Barstar WT / AD-Barnase H102A with 320 pM and BD-Barstar Y29A / AD-AD-Barnase H102 with 420 pM) can be
ordered incorrectly in certain experiments. However, when the normalized reporter level (see “Experimental procedures”) is averaged over five repetitions of the qY2H experiment, these two couples are ordered correctly (see Suppl. Fig. S7C). Moreover, we observed significant differences between all neighbors of our affinity ladder but one. It is the interaction with the weakest affinity (Kd = 17 M, BD-Grb2 / AD-Vav1). By increasing the number of repetitions, significant
differences can be obtained also for this couple (Suppl. Fig. S7C).
In conclusion, eleven out of twelve pairs of the ATS are ordered correctly (Fig. 5B); this corresponds to a Spearman rank correlation coefficient of 0.96. It validates the qY2H system’s capability of ranking the PPIs of Table 1 based on their affinities. However, the qY2H seems to be limited to interactions with a Kd < 20 M.
Affinity ladder permits rapid classification of PPIs based on their strength
Often the goal is to rank PPIs based on their affinity or to obtain an upper and lower bound for the dissociation constant. The above affinity ladder can be used for a rapid visual classification of PPIs with thus far unknown affinities within a given range (here from micro- to picomolar). This is demonstrated at the example of the mutation D35A of Barstar. Thus far, no in-vitro affinity data is available for the interaction of this mutant with Barnase H102A. With the affinity ladder of Fig. 5B we can rank the affinity between those of BD-CksHs1 / AD-CDK2 (77 nM) and BD-HRas / BD-CRaf A85K (11 nM).
Our qY2H experiment indicates that the Barstar mutant D35A exhibits a significantly higher affinity for Barnase H102A than the Barstar mutant D39A (420 nM). To validate this observation, we performed independent alchemical free-energy calculations (see Suppl. Material). Through the use of a thermodynamic cycle (Suppl. Fig. S8A) we calculated the difference in
binding free energy between the mutants Barstar D35A and Barstar D39A. We obtained a value of -1.9 ± 0.3 kcal/mol which indicates that the dissociation constant of the mutant D35A is about 20 times lower than that of the mutant D39A. Thus, we can estimate a dissociation constant of about 20 nM for the mutant D35A in agreement with the qY2H experiment.
The Specificity Test Set generates seven positives out of 59
When the qY2H system was challenged with 59 potential negative controls, we found 52 pairs within the error margin of the CTRL sample BD-Empty / AD-Empty (Suppl. Fig. S9). The nine pairs with the highest relative reporter level (including seven positive pairs) have the BD-ARMC1 fusion in common. Despite this fusion did not display any auto-activation phenotype (Fig. 2), it seems to cause non-specific positives (with proteins from eight different families).
The strongest signal of the STS was obtained when BD-ARMC1 was paired up with AD-Emerin. Interestingly, this orientation produced a negative phenotype in five different GAL4-based Y2H assays (42). The reverse orientation yielded in our qY2H system a reporter level within the error margin of the CTRL sample (Suppl. Fig. S2) like in six out of nine GAL4-based Y2H assays (41, 42). Taking together these results, we conclude that ARMC1 is error prone when used as BD-Bait in our LexA-based Y2H system and therefore seems not to be a suited candidate for testing the specificity of qY2H assays in the future.
Concerning the protein MNAT1, we were forced to use it as Prey due to an auto-activation phenotype of BD-MNAT1 (Fig. 2). Except with BD-ARMC1 (see above), AD-MNAT1 does not generate any positive signal with the tested BD-Bait fusions, including BD-GMPPA. The negative result with the latter coupler is in agreement with Ref. 42.
In conclusion, the fusions of the STS (except BD-ARMC1) are well suited candidates to evaluate the specificity of future qY2H experiments.
Discussion
Quantitative features of the tri-fluorescent yeast two-hybrid system
The tri-fluorescent qY2H system offers the novelty of identifying expression correlations for the genes involved in the actual Y2H reaction. For true positive interactions the reporter level is correlated with both reaction partners. For false positive interactions where the Bait acts as activation domain (e.g., BD-B112), the reporter level is basically only correlated with one reaction partner. This characteristic correlation pattern can serve as additional criteria to discriminate such false positive interactions from true positives. It complements the auto-activation test with proper controls (i.e., empty Bait and Prey plasmids) routinely applied in Y2H assays. The visual recognition of this pattern requires, however, a relatively strong reporter level (i.e. about three times higher than the CTRL sample).
Our qY2H system, like all yeast two hybrid assays is faced to the problem of auto-activating proteins (49). However, most of the auto-activating phenotypes that we have detected can be attributed most likely to the intrinsic properties of the tested proteins. They can interact/modulate the transcription machinery. For example, it has been reported that SRC interacts and modulates Hepatocyte Nuclear Factor-1 (52) and TFII-I (53), when MNAT1 can recognize Octamer Transcription Factors via their POU domain (54). Moreover, proteins of the Pex family from
Saccharomyces cerevisiae have been demonstrated to interact with the TATA Binding Protein 1
(55). For CRaf RBD there is no reasonable explanation for its elevated auto-activation level. Fortunately, the probability that both proteins of a PPI cause an elevated auto-activation level as BD-Bait is rather low.
In the past, significant effort has been spent to render the Y2H read-out quantitative and thereby gain quantitative information on the strength of interactions (see cited literature in the
Introduction). Our study clearly demonstrates that the quantification of the reaction partners is important, too. We have shown that variations in the expression levels of BD-Bait and AD-Prey can lead to reporter levels that are not ordered according to the underlying PPI affinities. Through a simple gating process, it is, however, possible to standardize the expression levels of BD-Bait and AD-Prey and thereby overcome this difficulty.
From our studies it seems that the qY2H system reaches saturation for interactions with a
Kd below 100 pM. However, only mutations of the same couple (Barstar/Barnase H102A) were
tested in this region. To better define this limit, other types of PPIs should be tested in the future. The lower limit seems to be at 20M with the current experimental conditions. Within the range 100 pM to 20 M, we see a high correlation between the normalized reporter level and the affinity (see Suppl. Fig. S10). The relationship follows a classical dose-response curve that can be well fitted with standard sigmoid-like functions. Such fitted functions may improve in the future the estimation of the Kd for interactions with unknown affinities. For example, for the couple Barstar
D35A / Barnase H102A we estimated a value between 18 and 49 nM which is a slightly more narrow range than the one imposed by the ladder approach (between 11 nM and 77 nM). Nevertheless, depending on the data set, different parameters can be obtained for the fitted functions (explaining the range of predictions, see also caption of Suppl. Fig. S10). More data will be necessary to consolidate this fitting strategy. For the moment we consider the ladder approach the more cautious strategy.
In-cellula is not in-vitro
The observed agreement between in-cellula reporter levels and in-vitro affinities (Fig. 5B and Suppl. Fig. S10) cannot be presumed a priori. The in-vitro experiment measures the affinity
between the interactors alone (or with tags) whereas the qY2H system relies on fusion proteins (Fig. 1). If the fused domains influence the interaction between the Bait and Prey, e.g., by blocking the binding interface, the resulting in-cellula reporter level would be impaired and most likely not correlate with the in-vitro affinity.
We have designed our fusion proteins so that Bait and the Prey are located at the C-terminus. Consequently, there is only a single hinge joint between the Bait and the remaining LexA-RFP fusion or between the Prey and the B42-GFP fusion. This should minimize the number of possible intra-molecular interactors that can block the binding site. Nevertheless, steric hindrance effects may still influence the accessibility of the binding interface. This could explain why two out of twelve interactions (Barstar / Barnase and CDK2 / CksHs1) displayed significantly different reporter levels when tested in the two possible orientations (Suppl. Fig. S2). The majority of interactions yielded, however, only slightly different reporter levels in the two orientations.
Beside steric hindrance effects, the distance between BD and AD (and their relative orientation) can vary depending on the studied BD-Bait / AD-Prey complex. As a result, the efficiency of the transcription cannot be assumed a priori to be equal for different types of proteins. Similar effects can apply to in-vitro approaches with immobilized bio-molecules, like SPR. Thus, orientation/accessibility problems can generate discrepancies between the various methods to measure affinities in-vitro and in-cellula.
In-vitro experiments measure the affinity under well-defined buffer-controlled equilibrium
conditions. In contrast, our in-cellula experiments take place in non-equilibrium microvessels (56) where the interaction partners can interact with the endogenous complex solution of biomolecules. This may lead to effectively smaller concentrations of the reaction partners. Also, post-translational modification(s) could impact the interactions.
according to their in-vitro affinity (Suppl. Fig. S7C). An exception is the interaction between TEM and BLIP1. Interestingly, this PPI displayed a remarkable variability of interaction strengths in the
in-vitro experiments. The Kd varied from 400 to 15000 pM depending on the buffer (at a constant
pH of 7.5) (33). Moreover, a high dependence on the pH has been reported: by increasing the pH from 7.5 to 8.5 the dissociation constant is multiplied by a factor 100 (33). The other couples of Table 1 do not display such strong variations to the best of our knowledge. The pH-dependence of PPIs can of course impact the result of the qY2H experiment. The nucleus is more basic than the cytoplasm. Values up to pH 8 have been reported (57). Also, the reported conditions for in-vitro assays with yeast RNA polymerases recommend a pH-value of 8 (58). In such an environment, the observed affinity between TEM and BLIP1 is much weaker than the value given in Table 1 (for pH 7.5 in Hepes buffer as for the majority of the couples). Indeed, this was observed in our qY2H experiment. The difference between the nuclear environment and standard buffer conditions for
in-vitro experiments could explain why some interactions can only be observed with yeast two-hybrid.
This might be especially relevant for proteins with optimized functioning in the nucleus.
With prior knowledge about the Bait or Prey the amino-acid sequence can be optimized to take into account their intrinsic properties, like specific sub-cellular localization. An illustrative example is the protein HRas, which is usually found to be associated to the cytoplasmic membrane through its C-terminal anchor. Mutation of C186A abolishes the anchor function (59) and the protein can be used for the in-cellula measurements.
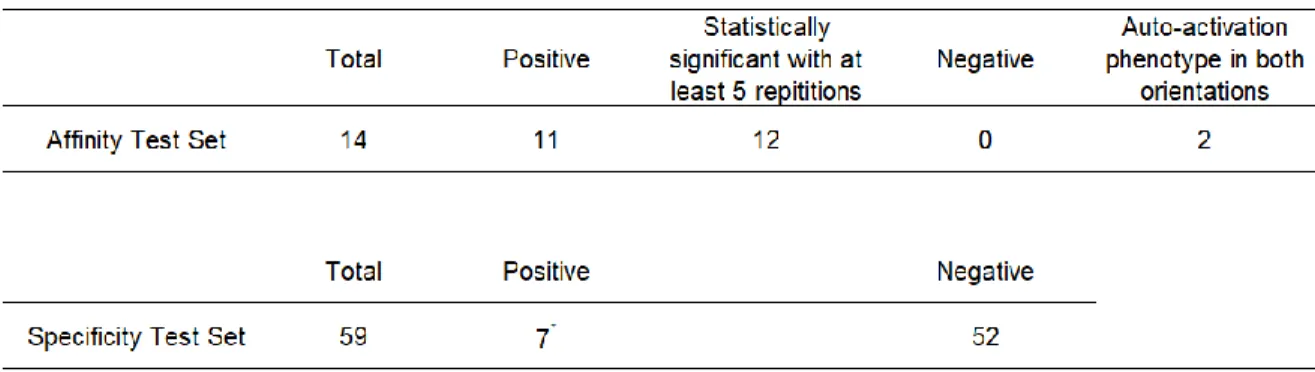
Table 3 presents the sensitivity and specificity benchmarks of the qY2H system in the light of its caveats as an in-cellula assay. With a single repetition of the experiment, the qY2H system was able to detect eleven interactions with known affinity out of 14. An additional couple (with the weakest affinity) generates a reporter level distinguishable from the system’s background when studied at least five times. The two remaining couples cannot be studied due to an auto-activation
phenotype in both orientations. Thus, our system is able to detect 86 % of the tested interactions with known affinity when including auto-activating couples as failures, and 100 % otherwise. The STS generated seven positive signals (12 %), all with the BD-ARMC1 fusion in common.
Workload and scalability
The qY2H approach has been designed to standardize expression levels of the reaction partners and thereby estimate the in-cellula affinity of PPIs. Its throughput cannot be compared to binary Y2H assays that aim to give a YES/NO answer such as the CrY2H-seq approach (60). With respect to current in-vitro or in-cellula methods for the measurement of the affinity of PPIs, our qY2H assay can, however, be considered as a high-throughput approach. When studying specific PPI couples, as we did in this work, the limiting step in terms of time and financial resources is the construction of the plasmids (some with optimized coding sequence, see for example HRas). Once amplified plasmids were available, up to eight complete qY2H experiments with 24 samples could be performed within one month and a workload of 0.5 man-month. This throughput is based on our experience during the setup phase of the qY2H approach when we tested different experimental conditions. Thus, about 40 couples can in principle be characterized (including the auto-activation and orientation filters and five repetitions of the experiments) within one month by a single manipulator. The throughput of all steps of the protocol (except data acquisition by flow cytometry) can be scaled linearly with increasing manpower. As these steps have been optimized for liquid phase, a scale-up with robots could even be envisaged (61). The acquisition by flow cytometry might be also a limiting step for the scalability. With the MACSQuant VYB flow cytometer used in this work, a maximum of 100 samples can be measured per day (with a flow speed of 16000 events/s). With more advanced equipment such as the MACSQuant X, about 8000 - 10000 samples can be measured per day.
Recommendations
Beside potential sequence optimizations (as proposed above), we recommend the following precautions to be taken for the measurement with the qY2H system:
1) As in any Y2H screen, BD-Bait and AD-Prey constructs should be tested against controls,
i.e., AD-Empty and BD-Empty, respectively, to identify auto-activating BD-Bait or AD-Prey
fusion proteins. For comparison reasons, the CTRL sample has to be measured, too. It is also required to remove the background of the system when calculating normalized means. 2) The PPIs should be tested in both orientations, i.e., with the proteins switched between the
Bait and Prey vectors, to identify the orientation with the higher reporter level (for standardized levels of reaction partners).
3) We recommend to pre-transform BD-Bait-expressing haploids with the reporter plasmid. It increases the reporter level. Two subsequent transfections are more efficient than a single double transfection. Use only freshly transformed yeast cells for the qY2H experiment. Storing diploids yeast cells for a week in the refrigerator decreases the level of AD-Prey and reporter level by a factor two to five.
4) For the construction of the affinity ladder, the gating interval for the red fluorescence intensity (BD-Bait) was positioned at the lowest possible location to avoid saturation effects,
i.e., it was set just above the 95-% threshold of the non-fluorescent cells. Also, a low
expression level of the BD-Bait limits auto-activation effects. The gating intervals of the green fluorescence intensity was set to a medium range value to reach the desired sensitivity but to avoid saturation and protein burden effects (62). The width of each interval gate should not be larger than 20-30% of the value of its lower border. It narrows the variations in concentration of BD-Bait and AD-Prey among the studied cells.
5) If the gating intervals are not directly applied at acquisition time on the flow cytometer, at least 106 cells should be acquired for analysis. This number is sufficient to reach a converged ladder after gating (see Suppl. Fig. S5). For this number of cells cultures of 10 ml are sufficient.
6) In all repetitions of the qY2H experiment, the two couples with the lowest affinity (BD-Nef LAI / AD-SRC and BD-Grb2 / AD-Vav1) displayed a higher reporter level than the CTRL sample. This difference was, however, smaller than twice the relative sample standard deviation of the CTRL sample. Thus, with a single experiment, the qY2H system reaches its detection limit for PPIs with a Kd of about 20 M (and higher). To obtain statistically
significant results for such weak interactions, we recommend to repeat the experiment (with associated controls).
Conclusion
The newly constructed vectors provide for the first time access to a quantitative Y2H system with fluorescent tags for the reaction partners (BD-Bait, AD-Prey) and the reporter. The established protocol is rapid, sensitive and highly reproducible (when using normalized reporter levels). It permits easy detection of expression problems of the reaction partners. Using flow cytometry, the expression levels of the reaction partners can be monitored cell by cell simultaneously with the level of the reporter. The single-cell data can be exploited to identify correlation patterns as indicators of physical interactions.
The qY2H method presented in this work offers also an approach to quantitative data on the strength of protein-protein interactions in living cells. In this context, we have demonstrated the importance of quantifying the product and the reaction partners of the Y2H reaction:
standardization is critical to correct for differences in expression levels between couples. Using a straightforward gating analysis, an affinity ladder can be easily generated that permits rapid classification of PPIs according to their affinity. We would like to emphasize, however, that these
in-cellula affinities are effective quantities that depend on the cell’s complex microenvironment;
and this environment may change as a function of the yeast strain and the experimental conditions (temperature, medium, etc).
Our qY2H approach is an ideally suited tool to complement cross-mating approaches (61, 63) with libraries of yeast clones. Once PPI candidates have been identified with standard high-throughput Y2H screens, the interaction strength of key players of the PPI network can be estimated with our approach. Thus, quantitative PPI networks can be created by attributing weights to the PPI edges according to their in-cellula affinity. The topology of force-directed networks may help identifying key pathways within the network, and how these paths change as a function of environmental conditions (stress, metabolism, etc). Thus, we anticipate that qY2H data would boost the modelling of interactomes and thereby advance significantly systems biology.
Acknowledgements
This project was supported by a grant from the Fond Recherche of the ENS de Lyon. We are grateful to the Pôle Scientifique de Modélisation Numérique (Lyon, France) for computer time, and the SFR Biosciences Gerland-Lyon Sud (UMS344/US8) for the access to the MacsQuantVYB flow cytometer. We thank Dr Francesca Palladino and Matthieu Caron for technical support on the Western blots and Dr Gaël Yvert for helpful comments on the manuscript.
Our Python-based program for the automated generation of the qY2H affinity ladder (with a graphical user interface) can be downloaded here: http://github.com/LBMC/qY2H-Affinity-Ladder. The minimal requirements and installation instructions are given in the user guide (see Suppl. Material).
The flow cytometry files of the experiment shown in Fig. 4 and Fig. 5A can be downloaded from http://flowrepository.org under accession number FR-FCM-ZYUL and FR-FCM-Z25G. Access links for reviewers:
https://flowrepository.org/id/RvFrO0jCGA0pYODU9QMfnh1NfIktWPLCUjhAQoTTrn M8IpypLwYkSY0lBJ8HT39h
https://flowrepository.org/id/RvFrN8vk22YkHXo2ApiVgNgWV47RREYocQ64LQg0bH u88yVTv4lVVbfMN5gxM4Zr
References
1. B. Vogelstein, D. Lane, A. J. Levine, Surfing the p53 network. Nature 408, 307–310 (2000).
2. Y. Feng, C. A. Walsh, Protein–Protein interactions, cytoskeletal regulation and neuronal migration. Nat. Rev. Neurosci. 2, 408–416 (2001).
3. T. Takenawa, S. Suetsugu, The WASP–WAVE protein network: connecting the membrane to the cytoskeleton. Nat. Rev. Mol. Cell Biol. 8, 37–48 (2007).
4. J. D. Scott, T. Pawson, Cell Signaling in Space and Time: Where Proteins Come Together and When They’re Apart. Science 326, 1220–1224 (2009).
5. A.-L. Barabási, Z. N. Oltvai, Network biology: understanding the cell’s functional organization. Nat. Rev. Genet. 5, 101–113 (2004).
6. S. Fields, O. Song, A novel genetic system to detect protein–protein interactions. Nature 340, 245 (1989).
7. J. Gyuris, E. Golemis, H. Chertkov, R. Brent, Cdi1, a human G1 and S phase protein phosphatase that associates with Cdk2. Cell 75, 791–803 (1993).
8. B. Stynen, H. Tournu, J. Tavernier, P. Van Dijck, Diversity in Genetic In Vivo Methods for Protein-Protein Interaction Studies: from the Yeast Two-Hybrid System to the Mammalian Split-Luciferase System. Microbiol. Mol. Biol. Rev. 76, 331–382 (2012).
9. J. Chen, et al., A yEGFP-based reporter system for high-throughput yeast two-hybrid assay by flow cytometry. Cytometry A 73A, 312–320 (2008).
10. N. Yachie, et al., Pooled-matrix protein interaction screens using Barcode Fusion Genetics.
Mol. Syst. Biol. 12, 863–863 (2016).
11. J. R. Parrish, K. D. Gulyas, R. L. Finley, Yeast two-hybrid contributions to interactome mapping. Curr. Opin. Biotechnol. 17, 387–393 (2006).
12. M. Vidal, S. Fields, The yeast two-hybrid assay: still finding connections after 25 years. Nat.
Methods 11, 1203–1206 (2014).
13. J. Estojak, R. Brent, E. A. Golemis, Correlation of two-hybrid affinity data with in vitro measurements. Mol. Cell. Biol. 15, 5820–5829 (1995).
14. S. Fields, The Two-Hybrid System to Detect Protein-Protein Interactions. Methods 5, 116– 124 (1993).
15. N. Möckli, D. Auerbach, Quantitative β-galactosidase assay suitable for high-throughput applications in the yeast two- hybrid system. BioTechniques 36, 5 (2004).
16. J. Wagemans, R. Lavigne, “Identification of Protein-Protein Interactions by Standard Gal4p-Based Yeast Two-Hybrid Screening” in Protein-Protein Interactions, C. L. Meyerkord, H. Fu, Eds. (Springer New York, 2015), pp. 409–431.
17. P. Colas, B. Cohen, P. K. Ferrigno, P. A. Silver, R. Brent, Targeted modification and transportation of cellular proteins. Proc. Natl. Acad. Sci. 97, 13720–13725 (2000).
18. X. Hu, S. Kang, X. Chen, C. B. Shoemaker, M. M. Jin, Yeast Surface Two-hybrid for Quantitative in Vivo Detection of Protein-Protein Interactions via the Secretory Pathway. J.
19. D. Younger, S. Berger, D. Baker, E. Klavins, High-throughput characterization of protein– protein interactions by reprogramming yeast mating. Proc. Natl. Acad. Sci. 114, 12166–12171 (2017).
20. K. Zolghadr, et al., A fluorescent two-hybrid assay for direct visualization of protein interactions in living cells. Mol. Cell. Proteomics MCP 7, 2279–2287 (2008).
21. L. Yurlova, et al., The Fluorescent Two-Hybrid Assay to Screen for Protein–Protein Interaction Inhibitors in Live Cells: Targeting the Interaction of p53 with Mdm2 and Mdm4.
J. Biomol. Screen. 19, 516–525 (2014).
22. K. J. Jeong, M. J. Seo, B. L. Iverson, G. Georgiou, APEx 2-hybrid, a quantitative protein-protein interaction assay for antibody discovery and engineering. Proc. Natl. Acad. Sci. 104, 8247–8252 (2007).
23. S. Dutta, A. Koide, S. Koide, High-throughput Analysis of the Protein Sequence–Stability Landscape using a Quantitative Yeast Surface Two-hybrid System and Fragment Reconstitution. J. Mol. Biol. 382, 721–733 (2008).
24. H. Endoh, A. J. M. Walhout, M. Vidal, “[6] A green fluorescent protein-based reverse two-hybrid system: Application to the characterization of large numbers of potential protein-protein interactions” in Applications of Chimeric Genes and Hybrid Proteins - Part C:
Protein-Protein Interactions and Genomics, Methods in Enzymology., J. Thorner, S. D. Emr,
J. N. Abelson, Eds. (Academic Press, 2000), pp. 74-IN1.
25. A. L. Starling, et al., Evaluation of alternative reporter genes for the yeast two-hybrid system.
26. G. Schreiber, A. R. Fersht, Energetics of protein-protein interactions: Analysis ofthe Barnase-Barstar interface by single mutations and double mutant cycles. J. Mol. Biol. 248, 478–486 (1995).
27. C. Frisch, G. Schreiber, C. M. Johnson, A. R. Fersht, Thermodynamics of the interaction of barnase and barstar: changes in free energy versus changes in enthalpy on mutation 1 1Edited by J. Karn. J. Mol. Biol. 267, 696–706 (1997).
28. C. Herrmann, G. Horn, M. Spaargaren, A. Wittinghofer, Differential Interaction of the Ras Family GTP-binding Proteins H-Ras, Rap1A, and R-Ras with the Putative Effector Molecules Raf Kinase and Ral-Guanine Nucleotide Exchange Factor. J. Biol. Chem. 271, 6794–6800 (1996).
29. C. Block, R. Janknecht, C. Herrmann, N. Nassar, A. Wittinghofer, Quantitative structure-activity analysis correlating Ras/Raf interaction in vitro to Raf activation in vivo. Nat. Struct.
Mol. Biol. 3, 244–251 (1996).
30. A. Fischer, et al., B- and C-RAF display essential differences in their binding to Ras: the isotype-specific N terminus of B-RAF facilitates Ras binding. J. Biol. Chem. 282, 26503– 26516 (2007).
31. C. Kiel, “Untersuchung von Ras/Effektor-Komplexen mit gezielt veränderten elektrostatischen Eigenschaftens,” Dissertation, Ruhr-Universität Bochum, Fachbereich Biochemie. (2003).
32. C. Kiel, et al., Improved Binding of Raf to Ras·GDP Is Correlated with Biological Activity.
33. S. Albeck, G. Schreiber, Biophysical Characterization of the Interaction of the β-Lactamase TEM-1 with Its Protein Inhibitor BLIP †. Biochemistry 38, 11–21 (1999).
34. S. Arold, et al., RT Loop Flexibility Enhances the Specificity of Src Family SH3 Domains for HIV-1 Nef †,‡. Biochemistry 37, 14683–14691 (1998).
35. Y. Sato, et al., Characterization of the Interaction between Recombinant Human Peroxin Pex3p and Pex19p: IDENTIFICATION OF TRP-104 IN Pex3p AS A CRITICAL RESIDUE
FOR THE INTERACTION. J. Biol. Chem. 283, 6136–6144 (2008).
36. M. Nishida, Novel recognition mode between Vav and Grb2 SH3 domains. EMBO J. 20, 2995–3007 (2001).
37. Y. Bourne, et al., Crystal Structure and Mutational Analysis of the Human CDK2 Kinase Complex with Cell Cycle–Regulatory Protein CksHs1. Cell 84, 863–874 (1996).
38. E. A. Golemis, et al., Interaction Trap/Two-Hybrid System to Identify Interacting Proteins.
Curr. Protoc. Cell Biol. 8, 17.3.1-17.3.42 (2000).
39. G. Genové, B. S. Glick, A. L. Barth, Brighter reporter genes from multimerized fluorescent proteins. BioTechniques 39, 814–822 (2005).
40. H. K. Shearin, I. S. Macdonald, L. P. Spector, R. S. Stowers, Hexameric GFP and mCherry Reporters for the Drosophila GAL4, Q, and LexA Transcription Systems. Genetics 196, 951– 960 (2014).
41. P. Braun, et al., An experimentally derived confidence score for binary protein-protein interactions. Nat. Methods 6, 91–97 (2009).
42. S. V. Rajagopala, P. Uetz, “Analysis of Protein–Protein Interactions Using High-Throughput Yeast Two-Hybrid Screens” in Network Biology, G. Cagney, A. Emili, Eds. (Humana Press, 2011), pp. 1–29.
43. H. Ma, S. Kunes, P. J. Schatz, D. Botstein, Plasmid construction by homologous recombination in yeast. Gene 58, 201–216 (1987).
44. O. Kevin R, K. T. Vo, S. Michaelis, C. Paddon, Recombination-mediated PCR-directed plasmid construction in vivo in yeast. Nucleic Acids Res. 25, 451–452 (1997).
45. M. Foiani, F. Marini, D. Gamba, G. Lucchini, P. Plevani, The B subunit of the DNA polymerase alpha-primase complex in Saccharomyces cerevisiae executes an essential function at the initial stage of DNA replication. Mol. Cell. Biol. 14, 923 (1994).
46. R. D. Gietz, R. H. Schiestl, Frozen competent yeast cells that can be transformed with high efficiency using the LiAc/SS carrier DNA/PEG method. Nat. Protoc. 2, 1 (2007).
47. C. B. Bagwell, Hyperlog-A flexible log-like transform for negative, zero, and positive valued data. Cytometry A 64A, 34–42 (2005).
48. D. E. Bailey, Probability and statistics, models for research, Daniel E. Bailey (1971).
49. J. Mehla, J. H. Caufield, N. Sakhawalkar, P. Uetz, “A Comparison of Two-Hybrid Approaches for Detecting Protein–Protein Interactions” in Methods in Enzymology, (Elsevier, 2017), pp. 333–358.
50. E. A. Golemis, R. Brent, Fused protein domains inhibit DNA binding by LexA. Mol. Cell.
51. M. B. T. Bickle, E. Dusserre, O. Moncorgé, H. Bottin, P. Colas, Selection and characterization of large collections of peptide aptamers through optimized yeast two-hybrid procedures. Nat.
Protoc. 1, 1066–1091 (2006).
52. E. Soutoglou, G. Papafotiou, N. Katrakili, I. Talianidis, Transcriptional Activation by Hepatocyte Nuclear Factor-1 Requires Synergism between Multiple Coactivator Proteins. J.
Biol. Chem. 275, 12515–12520 (2000).
53. V. Cheriyath, Z. P. Desgranges, A. L. Roy, c-Src-dependent Transcriptional Activation of TFII-I. J. Biol. Chem. 277, 22798–22805 (2002).
54. S. Inamoto, N. Segil, Z.-Q. Pan, M. Kimura, R. G. Roeder, The Cyclin-dependent Kinase-activating Kinase (CAK) Assembly Factor, MAT1, Targets and Enhances CAK Activity on the POU Domains of Octamer Transcription Factors. J. Biol. Chem. 272, 29852–29858 (1997).
55. M. Babu, et al., Interaction landscape of membrane-protein complexes in Saccharomyces cerevisiae. Nature 489, 585–589 (2012).
56. C. Bustamante, J. Liphardt, F. Ritort, The Nonequilibrium Thermodynamics of Small Systems. Phys. Today 58, 43–48 (2005).
57. O. Seksek, J. Bolard, Nuclear pH gradient in mammalian cells revealed by laser microspectrofluorimetry. 6.
58. Th. M. Brogt, R. J. Planta, Characteristics of DNA-dependent RNA polymerase activity from isolated yeast nuclei. FEBS Lett. 20, 47–52 (1972).