HAL Id: hal-01725185
https://hal.archives-ouvertes.fr/hal-01725185
Submitted on 7 Mar 2018
HAL is a multi-disciplinary open access
archive for the deposit and dissemination of
sci-entific research documents, whether they are
pub-lished or not. The documents may come from
teaching and research institutions in France or
abroad, or from public or private research centers.
L’archive ouverte pluridisciplinaire HAL, est
destinée au dépôt et à la diffusion de documents
scientifiques de niveau recherche, publiés ou non,
émanant des établissements d’enseignement et de
recherche français ou étrangers, des laboratoires
publics ou privés.
The flow-induced vibration of an elliptical cross-section
at varying angles of attack
Justin S. Leontini, Martin Griffith, David Lo Jacono, John Sheridan
To cite this version:
Justin S. Leontini, Martin Griffith, David Lo Jacono, John Sheridan. The flow-induced vibration of
an elliptical cross-section at varying angles of attack. Journal of Fluids and Structures, Elsevier, 2018,
vol. 78, pp. 356-373. �10.1016/j.jfluidstructs.2017.12.013�. �hal-01725185�
O
pen
A
rchive
T
OULOUSE
A
rchive
O
uverte (
OATAO
)
OATAO is an open access repository that collects the work of Toulouse researchers and
makes it freely available over the web where possible.
This is an author-deposited version published in :
http://oatao.univ-toulouse.fr/
Eprints ID : 19646
To link to this article :
DOI: 10.1016/j.jfluidstructs.2017.12.013
URL :
http://dx.doi.org/10.1016/j.jfluidstructs.2017.12.013
To cite this version :
Leontini, Justin S. and Griffith, Martin and Lo Jacono,
David
and Sheridan, John The flow-induced vibration of an elliptical
cross-section at varying angles of attack. (2018) Journal of Fluids and
Structures, vol. 78. pp. 356-373. ISSN 0889-9746
Any correspondence concerning this service should be sent to the repository
administrator:
staff-oatao@listes-diff.inp-toulouse.fr
The flow-induced vibration of an elliptical cross-section at
varying angles of attack
J.S. Leontini
a,*
, M.D. Griffith
b,a, D. Lo Jacono
c, J. Sheridan
baSwinburne University of Technology, Hawthorn, Victoria, 3122, Australia
bFluids Laboratory for Aeronautical and Industrial Research (FLAIR), Department of Mechanical and Aerospace Engineering, Monash University, Melbourne, Victoria 3800, Australia
cInstitut de Mécanique des Fluides de Toulouse (IMFT), Université de Toulouse, CNRS, INPT, UPS, Toulouse, France
a b s t r a c t
This paper presents a study of the flow-induced vibration of an elliptical cross section at various angles of attack immersed in a free stream. The body is elastically-mounted and constrained to move only in the cross-stream direction. Two-dimensional direct numerical simulations are used to study the system response as a function of the spring stiffness and the angle of attack.
The elliptical cross section used has an aspect ratioΓ =1.5. This aspect ratio is large enough so that the deformation from a circular cylinder is obvious, but not so large that the geometry is not related to the cylinder. Because of this, the impact of the symmetry of the system on the flow-induced vibration is studied without also introducing other complexities such as sharp corners or fixed separation points. The body is light with a mass ratio (body mass to displaced fluid mass) of one.
The results show a surprisingly wide range of different flow regimes. For small angles (where the body is slightly streamlined) the flow behaviour is similar to that of a cylinder. However, for large angles, where the body is far from symmetric with respect to the wake centreline, the flow can be markedly different with distinct asymmetric modes, including one which is period-doubled. For angles where the body regains its symmetry (aligned across the flow and slightly bluff), an asymmetric mode continues to exist, apparently the result of a spontaneous symmetry breaking that is dependent on Reynolds number. Large-amplitude oscillations persist for very low stiffness or high reduced velocity, and this is explained in terms of the dependence of a critical mass on the angle of attack.
1. Introduction
The vortex-induced vibration of an elastically-mounted circular cylinder constrained to oscillate transverse to a free stream is one of the canonical problems of fluid–structure interaction. Due to the prevalence of cylindrical, or approximately cylindrical, cross-sectional members in engineering and natural structures, this problem is of both theoretical and practical importance. A very extensive literature on this problem is covered in the reviews ofBearman(1984), Williamson and Govardhan(2004),Sarpkaya(2004) andGabbai and Benaroya(2005). Essentially, the periodic vortex shedding from the bluff cylinder induces a period force on the cylinder. If this forcing occurs at a frequency that is near the natural structural
*
Corresponding author.frequency, nonlinear synchronisation or ‘‘lock-in’’ occurs, where the body motion and the vortex shedding occur at the same frequency, and large amplitude oscillations occur.
However, this behaviour is not universal for all bluff cross sections. Perhaps the most striking example of this is the square cross section. While this cross section results in periodic vortex shedding, the structure does not respond to this shedding with large amplitude oscillations (Bearman et al., 1987;Nemes et al., 2012;Zhao et al., 2014b). This cross section is, however, strongly susceptible to another flow-induced vibration phenomenon known as transverse galloping (Parkinson and Smith, 1964), where the structure responds to the quasi-steady mean transverse force induced by the fact that the square cross section (unlike the cylinder) has an angle of attack. For transverse galloping to occur, the mean transverse force must occur in the same direction as any perturbation of the body from its mean position, i.e, a positive displacement must result in a positive transverse force. Effectively, this means that a ‘‘nose-up’’ rotation of the body must result in a downward mean force — the opposite to what is expected from deliberately designed lifting surfaces such as aerofoils. This occurs for the square cross section due to the separated shear layer formed at the sharp leading corners not reattaching to the body. If these layers do reattach (as occurs when the body is extended in the streamwise direction to become rectangular) the galloping response is suppressed (Robertson et al., 2003).
This raises a question: how ubiquitous is the flow-induced vibration behaviour of a purely circular cylinder?Navrose et al.(2014) studied the vortex-induced vibration of an elliptical cross section using two-dimensional direct numerical simulations for ellipses of varying aspect ratio. They found that the response regimes present, characterised by amplitude of oscillation, forces, and vortex shedding modes, were a strong function of the aspect ratio. To understand the response of circular cylinders yawed with respect to the incoming flow,Franzini et al.(2009) conducted an experimental study on the vortex-induced vibration of an elliptical cylinder with an aspect ratio of 1.41, the same aspect ratio as the cross section of a cylinder yawed at an angle of
π /
4. With the long axis aligned with the flow, this study showed that the response of the body was reduced compared to the circular cross section. It was hypothesised that this reduction is due to the increased added mass of the flatter transversely oscillating body. Both of these studies investigated situations where the ellipse was mounted symmetrically with respect to the incoming flow, i.e, with the major or minor axis aligned with the flow.Breaking this symmetry can have a marked impact on the flow. The underlying phenomenon that drives vortex-induced vibration is periodic vortex shedding. For a rigidly mounted circular cylinder this flow has a spatio-temporal symmetry: evolution in time by half a period combined with reflection about the wake centreline results in the original flow. Typically, high amplitude vortex-induced vibration occurs during synchronisation or lock-in (although it should be noted that the highest amplitudes in the ‘‘upper branch’’ (Khalak and Williamson, 1996) appear to be chaotic (Hover et al., 1998;Morse and Williamson, 2009;Zhao et al., 2014a)). While the configuration of vortices may vary (for instance, between the ‘‘2S’’ and ‘‘2P’’ modes), the flows during synchronisation maintain this same spatio-temporal symmetry. This underlying symmetry restricts the types of symmetry-breaking bifurcations that can occur, effectively reducing the ‘‘space’’ of solutions available. Breaking this symmetry can allow flow states to occur that are not possible in the symmetric case.
In the related problem of the flow-induced vibration of a square cross section,Nemes et al.(2012) andZhao et al.
(2014b) clearly showed this effect by varying the angle of attack of the square section. For angles of attack
π /
16 or 11.
25◦, they discovered a subharmonic mode of vibration dubbed the ‘‘higher branch’’ due to the fact it resulted in amplitudes of oscillation larger than the upper branch. The fact this mode is subharmonic is a direct consequence of breaking the symmetry — only odd harmonics and subharmonics will respect the spatio-temporal symmetry. This high-amplitude mode is therefore not available to the circular cylinder, as the cylinder cannot break symmetry as it does not have an angle of attack.An elliptical cross section with a mild aspect ratio (i.e, not too far from 1) is perhaps the geometry closest to a circular cylinder that can have an angle of attack. Like the cylinder, it has no sharp or discontinuous corners, allowing any separation points that form on the surface to move.D’Alessio and Kocabiyik(2001) performed simulations of an inclined ellipse with an aspect ratio of 2 (major to minor axis length) performing externally controlled oscillations across the stream. The results show complicated and asymmetric vortex formation and shedding in the wake that were functions of the angle of attack, the amplitude, and the frequency of the oscillation.
These results taken together indicate that the behaviour that is so well documented for the vortex-induced vibration of a circular cylinder may have only limited application once the geometry varies, particularly as the symmetry of the flow changes. This could have implications in application, as structural members that are nominally circular accrue some asymmetry through either large manufacturing tolerances, applied loading, wear and erosion, or even the growth and attachment of biological elements, particularly in marine applications.
This paper presents a systematic study of the flow-induced vibration of an elliptical cross section with aspect ratio of 1.5. The Reynolds number is kept low at Re
=
200 so that two-dimensional simulations are valid, and the body is light with a mass ratio of 1. The flow-induced vibration response is investigated as a function of the system stiffness, angle of attack of the ellipse, and the mechanical damping.It is found that for small angles, i.e, with the ellipse almost aligned with the flow, the behaviour of the ellipse is quite similar to that of the circular cylinder. However for larger angles, including the case where the body regains symmetry, i.e, with the ellipse aligned across the flow, the behaviour is markedly different. In particular, the frequency of oscillation remains almost constant, instead of locking to the natural structural frequency. It is also found that large-amplitude oscillations persist for effectively all values of the reduced velocity, implying the mass employed is below the critical mass (Govardhan and Williamson, 2002). Also, an asymmetric oscillation mode is discovered, even though the body is symmetric, and shown to be a function of the Reynolds number. For intermediate angles, a period-doubling mode, where the frequency locks to a frequency around half the natural structural frequency is present, with the system repeating over two oscillation cycles.
Fig. 1. A schematic of the basic problem setup. The dashed line marks a circle of the same cross sectional area as the ellipse to give an indication of the amount of deformation.
2. Method and validation
2.1. Problem formulation
Two-dimensional direct numerical simulations were conducted solving the incompressible Navier–Stokes equations and the linear oscillator equation of motion of the body in an accelerating reference frame attached to the moving body, defined as
∂
u∂τ
= − (
u· ∇)
u− ∇
P+
1 Re∇
2u− ¨
y∇ ·
u=
0¨
y+
c∗y˙
+
k∗y=
2π
m∗CL.
(1)Here, u is the nondimensional velocity field (normalised by U),
τ
=
tU/
D is the nondimensional time, P=
p/
(ρ
U2) is thenondimensional pressure, Re
=
UD/ν
is the Reynolds number, y is the nondimensional body displacement (normalised by D), c∗=
cD/
(mU) is the nondimensional damping coefficient, k∗=
kD2/
(mU2) is the nondimensional spring stiffness,m∗
=
4m/
(ρπ
D2L) is the mass ratio (mass of the body divided by the mass of displaced fluid), and CL
=
2Fl/ρ
U2DL is the liftcoefficient. The dimensional parameters are the free stream velocity U, time t, the body width in the transverse direction D, the pressure field p, the fluid density
ρ
, the fluid kinematic viscosityν
, the linear damping coefficient c, the body mass m, the linear spring stiffness k, the length of the body in the spanwise direction L (here taken as unity as all quantities are per unit length during two-dimensional simulations), and the lift force FL.The spring stiffness is accounted for using the reduced velocity U∗
=
U/
(fND)=
2π /
√
k∗, where fN=
√
k/
m/
(2π
) is the natural structural frequency in vacuo.The geometry investigated is an elliptic cross section of aspect ratioΓ
=
1.
5. The mass ratio m∗is fixed at m∗=
1. The angle of attackθ
varies over the range 0≤ θ ≤ π/
2, whereθ
is the angle between the flow direction and the major axis of the ellipse. A schematic of the basic setup is shown inFig. 1.2.2. Numerical method
The simulations were conducted using a well-validated spectral-element code. The code has previously been used for flow-induced vibration studies (Leontini et al., 2006), and studies of flows past ellipses (Leontini et al., 2015;Rao et al., 2017). The spatial discretisation uses quadrilateral spectral elements employing 6th-order tensor-product Lagrange polynomials associated with Gauss–Lobatto–Legendre quadrature points. Like all finite-element classes of methods, the spectral element method solves the equations of motion in the variational or weak form. The quadrilateral elements were free to have straight or constant-radius-curve sides. To represent the ellipse, the curvature of the elements at the body surface was such that the global error between the constant-radius elements and the true elliptical surface was minimised. The error was typically imperceptible (the root-mean-square (RMS) error of the y-position was smaller than 10−4D. Previous studies using the same
method (Leontini et al., 2015) have validated this technique as providing an accurate representation of the geometry. Time integration was executed using a three-way time-splitting scheme (Karniadakis et al., 1991;Thompson et al., 2006). For the advection and body motion, a semi-implicit predictor–corrector scheme was employed, with internal iterations to converge the strongly coupled fluid and body motion. A Poisson equation for the pressure was formed by enforcing continuity
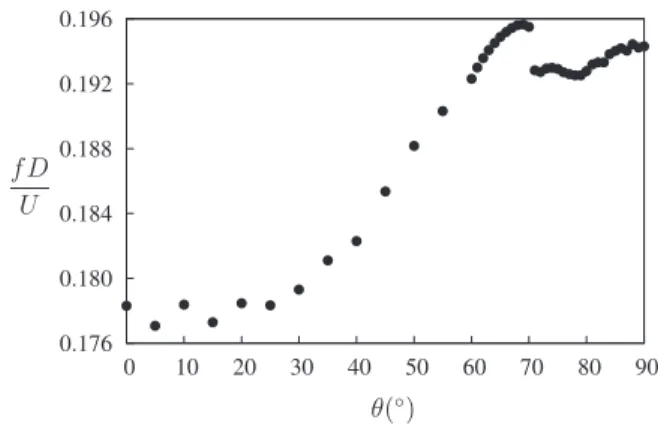
Fig. 2. Primary frequency of vortex shedding as a function of the angle of attackθ.
at the end of the pressure substep, and the pressure substep was solved using a centred Crank–Nicolson scheme. The diffusion substep was solved using an implicit Crank–Nicolson scheme. An in-depth treatment of the scheme, and the spectral element method in general can be found inKarniadakis and Sherwin(2005).
A domain extending 20D upstream, 46D downstream, and 30D to either side of the centre of the body was employed resulting in a blockage ratio of less than 2%. This domain was discretised into 796 elements, mostly concentrated in the near-body and wake regions. Note that as the angle of attack
θ
was varied, the overall size of the body scaled so that the width of the body in the cross-stream direction was always the same.For the velocity field, the boundary conditions imposed were a free stream Dirichlet condition at the upstream and transverse boundaries, and a zero-gradient Neumann condition (a standard outflow condition) at the downstream boundary, and a no-slip Dirichlet condition at the body surface. For the pressure, a Neumann condition (with the value of the normal pressure gradient derived from the Navier–Stokes equations, seeGresho and Sani, 1987) was employed at the upstream, transverse, and body surface boundaries, while a Dirichlet condition stating P
=
0 was imposed at the downstream boundary.3. Results
3.1. Rigidly-mounted flows
While the focus of this study is the flow-induced vibration phenomena, here a brief study of the rigidly mounted ellipse is presented to provide a reference for the more complicated dynamic phenomena presented later.
Since vortex-induced vibration relies on a synchronisation between the body motion and vortex shedding frequencies,
Fig. 2presents the nondimensionalised vortex shedding frequency from the ellipse as a function of the angle of attack
θ
. Here, the vortex shedding frequency was ascertained from a Fourier transform of the lift force history, ignoring any initial transient.For small increases from
θ
=
0, the frequency varies only slightly. With larger increases, the frequency also increases, as might be expected; with increasingθ
, the body becomes less streamlined, resulting in thinner shear layers at the point of separation from the body, which results in a higher frequency of shedding (Monkewitz and Nguyen, 1987).However, the behaviour of the frequency becomes more complicated for angles
θ >
70◦. There is a very sudden decrease atθ
=
70◦, followed by a small plateau and then a slow increase in frequency asθ
is increased toθ
=
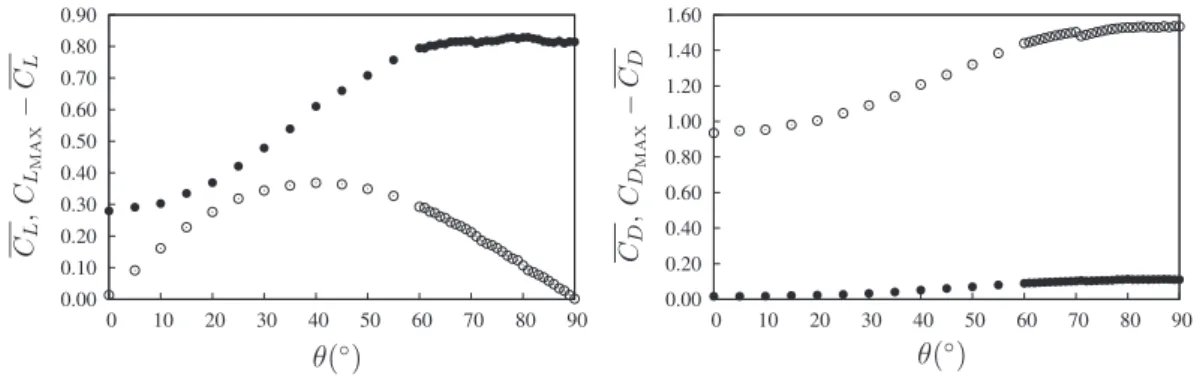
90◦. This change in the shedding frequency does not seem to be associated with a significant change in wake mode, and the flow remains periodic and organised in the classic Kármán vortex street (albeit slightly biased to one side due to the asymmetry).Fig. 3plots the maximum deviation and mean value of the lift and drag coefficients for the rigid ellipse as a function of
θ
. There is little indication of any change in flow regime. The mean lift force is seen to peak at aroundθ
=
40◦, close to the point when the body is the furthest from symmetric. The maximum deviation of the lift varies similarly to cos(θ
), possibly due to the wake becoming wider and the shed vortices becoming stronger as the body becomes bluffer. Support for this idea comes from the variation of the mean drag coefficient, which also varies like−
cos(θ
). The maximum deviation of the drag coefficient also varies this way, but the variation is less pronounced.3.2. Elastically-mounted flows
A series of simulations were conducted over the range 2.U∗.14 in increments of 0.5, and 0.
θ
.90◦, in increments of 5◦.Fig. 4presents contours of the maximum displacement of the body as a function of U∗andθ
, and graphs of the same data for increments ofθ
=
10◦. Here, the maximum displacement has been taken as the maximum deviation from the meanFig. 3. Maximum deviation (•) and mean (◦) lift coefficient and drag coefficient as a function ofθfor the rigidly mounted ellipse.
Fig. 4. Contours of the maximum deviation from the mean displacement|ymax−y|as a function of the reduced velocity U∗and angle of attackθ, and
the same data at selected values ofθpresented as a graph. The plots show that the maximum displacement increases withθin the lock-in regime, with a large-amplitude mode of vibration also occurring for higher U∗forθ> 40. The approximate boundaries of the regions where the amplitude is appreciable are marked with solid black lines.
displacement to account for the fact that the body with an angle of attack will generate a non-zero mean lift, and therefore will oscillate around a position that is not the equilibrium position at the beginning of the simulation. The contours where this maximum displacement becomes appreciable are marked on the figure.
Fig. 4shows that the amplitude of the response for the ellipse at
θ
=
0◦is similar to that for a circular cylinder at a similarRe. There is a small ‘‘initial’’ branch of response consisting of amplitude-modulated oscillations around U∗
=
2.
5, followed by a ‘‘lower’’ branch of high-amplitude, synchronised response over 3.U∗.4, followed by an apparently desynchronised regime for higher U∗with no appreciable amplitude response.This basic set of behaviours continues initially as
θ
is increased up toθ
=
30◦. The only apparent change in the peak amplitude response is a slight increase in amplitude, and a slight increase in the upper bound of the range of U∗over which the synchronised response occurs.Further increases in
θ
see the same trends for the synchronised response. The peak amplitudes over the whole range ofU∗increase, and the upper bound of the range of U∗increases. However, for values of U∗beyond those of the lower branch, new response regimes appear. At
θ
=
40◦, the peak amplitude starts to climb again from U∗=
7.
5, attaining a value of|
ymax−
y| ≃
0.
6 at U∗=
11 (similar to the largest amplitude oscillation in the lower branch). This decrease, then increasein amplitude with increasing U∗occurs roughly over the range 35◦ .
θ
. 55◦, and forms the ‘‘island’’ of high-amplitude response centred on U∗=
11.
5,θ
=
45◦in the contours ofFig. 4.Even further increases to
θ
≥
60◦see the picture change again. Here, the lower branch appears to continue with very high amplitude response to at least U∗=
11 forθ
=
60◦, and beyond the range of U∗tested for even higher angles. For the case where the body regains its symmetry with respect to reflection about the flow direction (θ
=
90◦), there is a slight drop in the amplitude after U∗=
11, but the amplitude remains high, around|
ymax−
y| ≃
0.
45.These behaviours and apparent changes in regime are mirrored in other scalar measurements.Fig. 5shows contours and graphs of the mean displacement of the body from the initial equilibrium position. There is an underlying trend in this data of the mean displacement being highest at an intermediate value of
θ
, where the body is the furthest from symmetric.Fig. 5. Contours of the mean displacement y as a function of the reduced velocity U∗and angle of attackθ, and the same data at selected valued ofθpresented
as a graph. The maximum mean displacement whenθ≃50◦. Note there is a region of non-zero y in the range 5<U∗<11 forθ=90◦even though the
body is symmetric with respect to the flow due to a spontaneous symmetry breaking. The region where y returns to zero is marked with the solid black line.
Fig. 6. Contours of the maximum deviation from the mean lift coefficient|CLmax−CL|as a function of the reduced velocity U∗and angle of attackθ, and the
same data at selected values ofθpresented as a graph. The plots show that the maximum lift peaks around the beginning of the lock-in regime regardless ofθ, with a large-amplitude fluctuations also occurring for higher U∗forθ> 40. The white lines mark the boundaries of a high lift region.
However, the exact value of
θ
for the largest mean displacement is shown to be a function of U∗, and tracks close to the value of U∗that marks the end of the lower branch.An important observation to make is that for the symmetric case at
θ
=
90◦, the mean position does not return to zero over the range 5<
U∗<
11. This is due to a spontaneous symmetry breaking, a point that will be expanded on in Section3.4.1. The region where the symmetric case results in a zero net position is delineated with a solid black line.Figs. 6and 7present the maximum deviation of the lift coefficient (again from the mean value) and the mean lift coefficient. The maximum deviation of the lift coefficient shows little correlation with the displacement, with a consistent value around U∗
=
3, corresponding to the initial branch of response. This high lift initial branch regime is delineated on the figure by solid white lines. The mean lift however shows many more features. Forθ
.30, the mean lift increases almost independently of U∗, except in the lower branch range where the mean lift is amplified. Similarly to the mean displacement, the mean lift is largest at the values of U∗close to the upper bound of the range for synchronised response. A dashed white line marks these local maxima on the figure. Again similar to the mean displacement, the mean lift reduces asθ
→
90◦, however, it is non-zero over 5<
U∗<
11. Also, there is an ‘‘island’’ of reduced mean lift centred around U∗=
11,θ
=
45◦, corresponding to the large peak displacement. A related point is the fact that the mean lift is zero for a non-symmetric angle, aroundθ
=
83◦for U∗=
10. Further explanation of this in terms of a balance between two mechanisms of lift is provided in Section3.3.3.Fig. 8presents the primary frequency of the response, obtained by taking the peak of the Fourier transform of the displacement history. For
θ <
60◦, there is some evidence of the system ‘‘locking’’ to a frequency that is similar to the natural structural frequency in the range 3<
U∗<
4, near the lower bound of the synchronised regime. However, afterFig. 7. Contours of the mean lift coefficient CLas a function of the reduced velocity U∗and angle of attackθ, and the same data at selected values of θpresented as a graph. The maximum mean lift occurs whenθ ≃30◦and U∗ =4. Outside of the lock-in regime, the mean lift is almost independent
of U∗forθ <45, and a weak inverse function of U∗forθ >45. Note however, there is a region of non-zero CLin the range 5<U∗<11 forθ =90◦
even though the body is symmetric with respect to the flow due to a spontaneous symmetry breaking. The approximate locations of the local maxima are marked with the dashed white line. The black line marks the boundary of significant response previously defined inFig. 4.
Fig. 8. Contours of the primary frequency of response fprimas a function of the reduced velocity U∗and angle of attackθ, and the same data at selected
values ofθpresented as a graph. The dashed line represents the natural frequency in vacuo. For the small angles, the frequency is proportional to, but lower than, fNwhen synchronised. For higher angles, the frequency for lower values of U∗is proportional to fN, but transits to a frequency closer to the vortex
shedding frequency from the fixed body at higher U∗. At intermediate angles, the flow synchronises again to something close to fNwhen it is close to half
the fixed body vortex shedding frequency, evidence of a period-doubled mode. The approximate boundaries of the region of this period-doubled mode are shown with the black line.
this, there is little dependence of the frequency of response on the natural frequency of the structure. Generally, it appears that the synchronised response is synchronised to a frequency near the vortex shedding frequency of the fixed body, rather than the natural frequency.
One striking feature ofFig. 8is the sudden halving of the primary frequency in the ‘‘island’’ centred on U∗
=
11,θ
=
45◦. This indicates that this region represents a separate period-doubled regime. The boundaries of this period-doubled mode are indicated by the solid black line on the figure.3.3. Regimes of response
All of these measurements, and the various regimes that have been defined from each of them, can be correlated with the mode of vortex shedding to define a series of response regimes. All of the regime boundaries defined onFigs. 4 to 8are shown inFig. 9. Example images of the flow, time histories of the body motion and lift coefficient, and the frequency spectra of the motion and lift, are shown in Fig. 10.
Overall, the large-amplitude, synchronised response of the body can be divided into three main modes: one where the wake is formed via alternate shedding of a single vortex from each side of the body each half-cycle of oscillation in a 2S
Fig. 9. A map of regimes. Details of each of the regimes are provided in Section3.3. The red filled circles ( ) are the points used as examples of each regime inFig. 10. The dashed line indicates that this boundary is not sharply defined.
configuration; one where the vortex from one side of the body splits in the near wake, forming a pair of vortices on one side of the wake and a single vortex on the other, in a P
+
S configuration; and a period-doubled state, where two vortices areshed per cycle of oscillation, but the flow takes two cycles of oscillation to repeat. Further, the 2S and P
+
S modes can besub-divided into cases where the body is symmetric or not with respect to reflection about the direction of the flow. Descriptions of these regimes, as well as the non-synchronised initial branch and desynchronised regimes, are presented below.
3.3.1. Initial branch
The initial branch is similar to the same-named branch from the vortex-induced vibration response of a circular cylinder (Khalak and Williamson, 1996). The response is non-negligible, but modulated, with contributions from the natural structural frequency and the vortex shedding frequency. As shown above inFig. 6, the instantaneous lift force can be large, due to the constantly shifting phase between the body motion and the vortex shedding.
3.3.2. The 2S mode
In this mode, the vortex shedding is synchronised with the body motion, with a single vortex shed from each side of the body each oscillation cycle. For small incidence angles, this regime occupies the entire range of U∗over which synchronised body motion and vortex shedding occurs, and the vortex shedding pattern is very reminiscent of that seen from a circular cylinder. For larger angles, it occurs only near the upper bound of the range of U∗for which synchronised motion occurs. The example image shown inFig. 10shows that for larger angles, the opposite-signed vortices shed from each side of the body each cycle pair up and convect away from the wake centreline, contributing to the net lift on the body. The fact that both vortices of the cycle end up ‘‘below’’ the body (with the flow from left to right, and a positive
θ
taken as ‘‘nose-up’’, as shown inFig. 10) means that there is a contribution to the lift at twice the vortex shedding and oscillation frequency.For the symmetric case at
θ
=
0◦, the frequency in this regime is governed by the natural structural frequency. However, for the asymmetric cases, where this regime occurs near the upper bound of U∗for synchronised motion (corresponding to the point where the maximum mean lift is achieved), the frequency remains close to the vortex shedding frequency of the fixed body as plotted inFig. 2. This is probably not surprising, as a high U∗corresponds to a low fN, and the natural structural frequency needs to be close to the ‘‘natural’’ vortex shedding frequency for the body to respond at fN.3.3.3. The P
+
S modeHere the vortex shedding is again synchronised to the body motion. However, the wake mode is substantially different, with a P
+
S configuration. The P+
S mode is formed by the stronger vortex from the top side (in the configuration shown inFig. 10) splitting into a large and small vortex in the near wake. The large vortex remains on the side of the wake it was shed from; the smaller vortex pairs with the vortex of opposite sign that was shed from the other side of the body in the previous half cycle.
For lower values of U∗, the frequency of response sits close to the natural frequency, however with increasing U∗the frequency saturates to a value close to, but below, the vortex shedding frequency from the corresponding fixed body. The body motion, despite the asymmetry in the wake structure, remains reasonably close to sinusoidal. However, the lift force deviates considerably from a pure sinusoid and has a large component at the first harmonic of the primary frequency.
Fig. 10. Example cases for each of the regimes demarcated inFig. 9. Left column: instantaneous vorticity contours between levels ofωD/U= ±1, red/blue is for positive/negative, at an instant with the cylinder at maximum positive displacement. Middle column: time history of vertical displacement y (black line) and lift coefficient CL(grey line). Right column: frequency spectra, with power normalised to maximum value of 1, for y (black line) and CL(grey line).
Parameters used for the examples: 2S from a symmetric body, U∗=3.5,θ=0; 2S from an asymmetric body, U∗=12.0,θ=60◦; the period-doubled mode, U∗=11.0,θ=40◦; P+S from an asymmetric body, U∗=5.0,θ=70◦; P+S from a symmetric body, U∗=9.0,θ=90◦. (For interpretation of the references to colour in this figure legend, the reader is referred to the web version of this article.)
Note that for the symmetric case at
θ
=
90◦, the P+
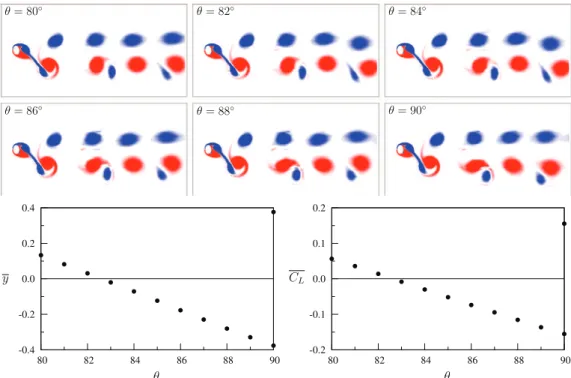
S mode is due to a spontaneous symmetry breaking. In this case, the vortex which eventually splits into two can be from either side of the wake, resulting in a positive or negative lift force. The direction chosen is a function of the initial conditions of the flow.A point that is clear fromFig. 5is that as the angle of attack is increased in this regime, the mean displacement decreases, before increasing again from
θ
≃
85◦.Fig. 11shows the variation of the mean displacement for U∗=
10, over the range 80◦.θ
.90◦, and snapshots of the wake vorticity over this same range. Here, the true value, rather than the absolute value, of the mean displacement is shown. The positive direction is taken as upwards in the configuration shown in the figure. It is clear that around 83◦, the direction of the mean displacement changes, despite there being no perceptible change in the configuration of the wake. In all cases, the asymmetry of the body causes the negative vortex from the top side of the body to split.Fig. 11. Variation of the flow with increasingθfor U∗=10. Images at the top show instantaneous vorticity contours for flows in the range 80◦≤ θ ≤90◦,
at an instant with the cylinder at maximum positive displacement. The graph shows the mean displacement over the same range. Together they show that while the flow configuration remains the same, the direction of mean lift reverses at around 83◦. Note too the two values recorded forθ =90◦, as the
symmetry with respect to the centreline allows the flow to bias to either side. (For interpretation of the references to colour in this figure legend, the reader is referred to the web version of this article.)
Why this change in the direction of the mean lift and displacement should occur is not exactly clear. It is hypothesised that this change is due to the rebalancing of two mechanisms that cause the mean lift. The first lift mechanism is caused by a steady component of the flow being deflected downwards, resulting in a positive lift, similar to an aerofoil. The second mechanism is due to the asymmetric configuration of the time-dependent wake, with the force from the pair of vortices not being completely balanced by the single vortex on the other side of the wake. This results in a net negative lift (The negative direction being set by the fact that the asymmetry of the body dictates the side of the wake on which the pair forms). The total lift is therefore a balance between the positive force from the mean deflection, and the negative force from the mean flow correction due to the asymmetric fluctuating wake. As
θ
→
90◦, the mean deflection approaches zero, and so the net mean lift becomes dominated by the force due to the asymmetry in the wake, and therefore becomes negative.This change in sign of the lift is not pre-empted by the static body results.Fig. 3shows that as
θ
→
90◦for the fixed body, the mean lift force smoothly reduces to zero. The development of a negative lift is a direct consequence of the symmetry breaking to a P+
S mode, which is apparently only possible when the body can oscillate.3.3.4. Synchronised: period doubled
In this regime, the primary frequency of oscillation sits close to half of the natural structural frequency, with the wake configuration and the body motion repeating over two cycles of oscillation. There are effectively two cycles of vortex shedding from the body during a single cycle of the oscillation. This is somewhat similar in nature to the ‘‘higher branch’’ identified in the wake of an elastically-mounted square cylinder with an angle of attack (Nemes et al., 2012;Zhao et al., 2014b).
Fig. 12shows the time history over one period of the body displacement and lift coefficient, and 12 equispaced samples of vorticity contours for this period doubled mode. Comparison of this figure, with Fig. 19 ofZhao et al.(2014b), shows that this period doubled mode does indeed share many features with the higher branch. In particular, the oscillation is not sinusoidal, and the motion and the corresponding vortex shedding occur over two distinct portions of the cycle. In both cases, there is a rapid rise of the body from its minimum to maximum displacement (occurring over around a third of the cycle) and a slower fall over the remaining two thirds of the cycle. The first vortex shedding cycle, with vortices shed from alternate sides of the body, occurs over the rapidly rising portion of the cycle, the second over the slowly falling portion of the cycle. The position of the wake vortices over the cycle is also similar between the square cylinder and elliptical cases. One distinct difference between the vortex shedding here and that from a square cylinder reported inZhao et al.(2014b) is that the direction of the mean lift and mean displacement is reversed. This appears to be a function of the geometry. In the case of the ellipse
Fig. 12. Top: time history of the body displacement (—) and the lift coefficient (- - -) over one period of the period doubled mode for theθ=40◦, U∗=11 case. Lower: samples of the period-doubled mode, equispaced over one period of oscillation, starting from the point of the lowest displacement. Red/blue contours are positive/negative vorticity, at levels−1≤ ωD/U≤1. Crosses mark the unperturbed position of the centre of the body. (For interpretation of the references to colour in this figure legend, the reader is referred to the web version of this article.)
presented here, vortices immediately at the rear of the body act on the upper surface of the body, and their low pressure produces a positive lift. However in the case of the square the vortices act on the rear face and their low pressure produces a negative lift. However, the similarity in the relationship between the vortex shedding and the motion around the mean, and the fact that both geometries result in a period doubled mode at the point where the body is the furthest from symmetric (
θ
=
45◦for the ellipse, andθ
=
22.
5◦for the square), suggests this period doubled mode and the higher branch are caused by similar mechanisms.While the primary frequency is consistently around half of fN, the total frequency content can be more complicated,
with the flow possibly becoming quasiperiodic around the middle of the region in parameter space occupied by the period doubled mode.
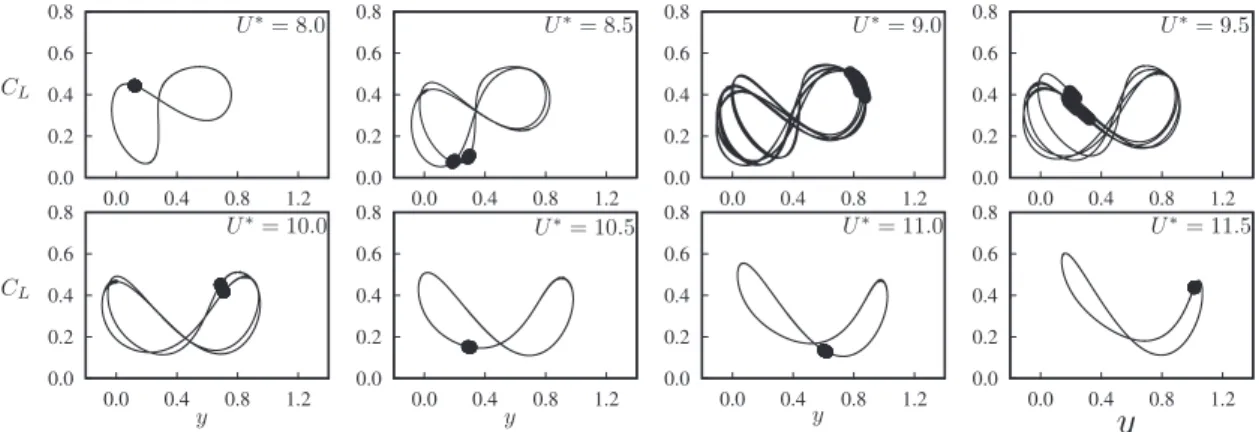
Fig. 13shows Lissajou plots, and associated Poincaré sections, for a series of U∗spanning the period-doubled region for
θ
=
40◦. The figure shows that at U∗=
8, the flow is strictly periodic, with a single closed curve drawn on the figure. Sampling this curve periodically, at time intervals equal to the primary period of the flow (the inverse of the primary frequency), sees the same value each period. These values are marked with points in the figure, and so the U∗=
8 case shows a single point.Increasing to U∗
=
8.
5 sees two distinct loops form, and two corresponding points appear when sampled. This indicates that the flow is strictly periodic over two primary periods; the flow has undergone a second period-doubling bifurcation.Increasing further to U∗
=
9, a number of loops are formed on the plot, and the sample points begin to draw out a closed curve. This is indicative of quasiperiodicity, as the flow almost repeats each period, but a small modulation means the flow does not quite return to its original state. A similar picture is seen for U∗=
9.
5.With further increases in U∗, this process is essentially reversed and the temporal complexity of the flow reduces until the flow is again strictly periodic with the primary period.
The strictly periodic case illustrated inFig. 12shows that the period doubled mode is driven by the interaction between two pairs of vortices and the body. As such, for the flow to remain periodic, a feedback between all of these vortices
Fig. 13. Lissajou plots and Poincaré sections of the lift coefficient versus body displacement for increasing U∗,θ=40◦in the period-doubled regime. The
last 300τof data is used for each plot. Poincaré sections are formed by sampling the displacement and lift once per primary period, so a pure period-doubled state shows a single point as two vortex shedding and oscillation cycles occur before the flow repeats. The plots show the increasing complexity near the middle of the range of U∗, with U∗=9.5 appearing quasiperiodic.
and the body is required. It is likely that any such feedback is reasonably weak; the vortices involved are spread over a distance of around 12D. Therefore, this loss of strict periodicity is not surprising. However, why the periodicity should be maintained at both low and high values of U∗, but not intermediate values, is not clear and requires more in-depth analysis.
3.4. Features of note for the
θ
=
90◦case3.4.1.
θ
=
90◦: spontaneous symmetry breakingThe most striking feature of the cases at
θ
=
90◦is the fact that over a range 4<
U∗<
11, large-amplitude P+
S mode oscillations occur. This is despite the symmetry of the body with respect to reflection.The appearance of P
+
S modes in large-amplitude oscillation cases has been previously observed. For example,Williamson and Roshko(1988) andMorse and Williamson(2009) report this mode for experimental studies of the controlled oscillation of circular cylinders, andLeontini et al.(2006) clearly showed this mode for the same problem numerically. Similar spatio-temporal symmetry breaking modes have been found in other oscillating body wake flows, such as flapping foils (Jallas et al., 2017). However, perhaps the most relevant is the work fromSingh and Mittal(2005), who found evidence of this mode in the wake of an elastically mounted circular cylinder. In that study, two degree-of-freedom simulations where conducted on a circular cylinder free to oscillate in both the transverse and cross-stream directions. At a Reynolds number Re
=
325, they observed the intermittent appearance of a P+
S mode when U∗=
4.
92. The P+
S mode was not observed for lower Reynolds numbers, or when the cylinder was restricted to single degree-of-freedom, purely transverse motion.The formation of the P
+
S mode involves the vortex forming on one side of the body to split in the near wake. Thefact that this typically happens for high amplitudes and/or frequencies in controlled motion experiments and simulations suggests that the growth of the instability leading to this splitting is a function of the high strain induced in the near wake. This suggestion is also consistent with the observations ofSingh and Mittal(2005), that the appearance of the P
+
S modeis a function of the motion path available to the body and the Reynolds number. An important observation here is that the amplitudes of oscillation for the ellipse at 90◦are larger than those observed for the circular cylinder, hence increasing this strain, and potentially lowering the Reynolds number at which the P
+
S mode can be supported.This leads to the question: how low can the Reynolds number be for the appearance of the P
+
S mode?Fig. 14shows contours of the mean displacement as a function of U∗and Re. The figure clearly shows that as Re is decreased, the range ofU∗over which the non-zero mean displacement occurs (which is associated with the formation of the P
+
S mode) decreases. Below Re≃
130, the P+
S mode is not observed. The lower bound on the range of U∗for the onset of the P+
S mode is only weakly dependent on Re, but the upper bound shows a much stronger dependence.The figure shows that the ‘‘critical’’ pairing of Re, U∗(i.e, the lowest values of both parameters where the P
+
S mode occurs) is around Re=
130, U∗=
6. Note that the recent study of the flow-induced vibration of an ellipse fromNavrose etal.(2014) studied ellipses with an aspect ratio up to 1.41 (only slightly less than that used here), and employed a scheme where Re and U∗were varied together. The U∗
=
6 case in that study corresponds to Re≃
106, just below the critical point found here, and so the P+
S mode was not observed.The appearance of the P
+
S mode here is particularly interesting, as the resulting flow is very stable and strictly periodic,and as the structural motion is fully coupled to the flow (as opposed to being externally controlled) it presents a clear example that this asymmetric mode can support vortex-induced vibration. This is a novel finding of this study.
Whether this mode can be observed experimentally or not is yet to be determined. Previous controlled motion studies of cylinders have shown that once the flow becomes three-dimensional, the P
+
S mode is no longer observed, oftenFig. 14. Contours of the mean displacement for theθ=90◦case as a function of U∗and Re. The non-zero values are indicative of the presence of the P+S
mode leading to asymmetry. The range of U∗that supports the P+S mode decreases with decreasing Re, until below Re≃130, the P+S mode ceases to
exist.
giving way to the 2P mode. Floquet stability analysis of oscillating circular cylinder wakes has also shown that the two-dimensional P
+
S modes are unstable to at least two three-dimensional subharmonic instabilities, effectively over theirentire range of existence (Leontini et al., 2007). However, in the controlled-motion-cylinder case, the amplitude and/or
Re need to be reasonably high to observe the P
+
S mode; for example, at Re=
200, the amplitude of oscillation needs to be 0.
67D. It may be that in the fully-coupled ellipse problem studied here the lower value of Re, and the fact that the body trajectory is free to evolve with the flow, is sufficient for this two-dimensional flow to be stable and therefore observable. Further experiments, three-dimensional simulations and/or stability analyses of the fully-coupled problem are required to be certain.3.4.2.
θ
=
90◦: infinite range of synchronised responseAnother interesting result is the fact that the ellipse with
θ
=
90◦appears to have an infinite range of U∗over which there is a large-amplitude, synchronised response.Fig. 15shows the variation of the peak amplitude, peak lift coefficient, primary frequency of response and the phase between the force and body displacement for this case as a function of U∗, extending the range of U∗as compared toFigs. 4and8.It is clear that even at very large values of U∗, corresponding to small values of spring stiffness and therefore natural structural frequency fN, there is a large amplitude response. However, it is also clear that this oscillation does not occur at,
or near, the natural frequency, but instead occurs at a frequency slightly below the vortex shedding frequency from a static body.
For the case of a circular cylinder,Govardhan and Williamson (2002) introduced the idea of a regime of ‘‘infinite resonance’’, where the cylinder would oscillate essentially sinusoidally for U∗
→ ∞
, and it is conjectured that the large-amplitude response for high values of U∗found here is an example of this mode of oscillation. It should be recalled thatU∗ represents a ratio of time scales; the advective time scale of the flow, U
/
D, and the natural structural frequency,fN
=
√
(k/
m)/
(2π
). So, U∗→ ∞
can be achieved by either increasing U→ ∞
, or by setting fN=
k=
0, or essentiallyremoving the springs or restoring force from the body.
Govardhan and Williamson(2002) achieved U∗
→
0 by performing water channel experiments on cylinders with no springs, and found there was a critical mass ratio, below which this large-amplitude ‘‘resonant’’ mode occurred. For their experiments at Reynolds numbers in the range 5000<
Re<
20,000, they found a critical mass ratio m∗crit
=
0.
54. In thesame paper, the authors re-analysed the data ofShiels et al.(2001), from two-dimensional simulations at Re
=
100. They found evidence of a critical mass, but at a value of m∗crit
=
0.
25. A later paper from the same group (Morse and Williamson,2010) found, for experiments where Re
=
4000, a value of m∗crit
=
0.
36.The explanation for the occurrence of this mode was also presented byGovardhan and Williamson(2002) and refined by
Morse and Williamson(2010). However, the mathematical treatment of the equations involved was conducted using non-dimensional parameters derived when considering VIV as a resonance-type phenomenon (where the natural frequency is a relevant time scale). While the results are undoubtedly correct, this choice of scaling can obscure the interpretation of what is occurring as U∗
→ ∞
, as at this limit there is no natural frequency. The basic argument is therefore restated here, but initially in dimensional parameters, which will also aid in interpreting the results across different geometries such as the ellipse.It is assumed that the body obeys the equation of motion for an undamped linear oscillator,
Fig. 15. Scalars for theθ=90◦case. (a) Maximum displacement relative to mean. (b) Maximum lift relative to mean. (c) Primary frequency of oscillation, nondimensionalised by U/D. The horizontal line marks the vortex shedding frequency from a static body (fSt=0.206), the dashed line marks the natural
structural frequency in vacuo fN. (d) The phase between the lift force and body displacement.
It is further assumed that the vortex shedding provides a sinusoidal lift force, and the body response is also sinusoidal, such that
FL
=
Fosin(ω
t+ φ
) (3)y
=
Yosin(ω
t).
(4)If there is no structural damping, then the net power extracted from the flow by the body must be exactly zero. This net power can be calculated by integrating the instantaneous power over one period
Pnet
=
1 TZ
T 0 Fosin(ω
t+ φ
)Yosin(ω
t)dt=
FoYoπ
sin(φ
)=
0.
(5)This places a constraint on the value of
φ
; for Pnet=
0,φ
must be equal to 0 orπ
(or, strictly, an integer multiple).Substituting the definitions of Eq.(3)into Eq.(2), and noting that
φ
can be equal only to 0 orπ
results inFo
=
mω
2Yo−
kYo,
whenφ
= π
(6)Fo
=
kYo−
mω
2Yo,
whenφ
=
0,
(7)Fig. 16. Time history of body displacement (black line) and lift coefficient (grey line), and snapshot of vorticity contours for a case atθ=90◦, U∗=22.
The harmonic, large-amplitude nature of the oscillation is clear.
The focus here is on the case where U∗
→ ∞
, or k=
0. For this condition, the first definition shown in Eq.(6)is the only one that can provide a positive value of Fo, so any harmonic response must have a value ofφ
= π
. Extending this, it canbe seen that, in general,
φ
= π
whenever the inertial term (mω
2Yo) is larger than the spring or restoring force term (kYo).
Fig. 16shows the time history of the lift coefficient and the body motion for a case at
θ
=
90◦, U∗=
22, which clearly shows the two are out of phase byπ
. The oscillation is purely periodic and very close to sinusoidal, and the wake structure also shown in the figure shows the periodic arrangement of vortices generated.Since
φ
= π
, the provided lift force FLis exactly out of phase with the motion, or in phase with the acceleration; therefore,it effectively offsets the inertia, and can be thought of as an effective added mass force, which reduces the apparent mass of the oscillating body. The effective added mass can be calculated by dividing the force in phase with the acceleration (which, when
φ
= π
is the total lift force) by the acceleration so thatmEA
=
Fo
ω
2Yo
.
(8)A question arises: how large is this effective added mass? This can be answered directly from Eq.(6). When U∗
→ ∞
, ork
=
0, the effective added mass must be equal and opposite to the true mass of the body for the force balance to work, i.e, the lift force must aid the acceleration and apparent mass of the body will be reduced by the effective added mass.An important point to highlight here that comes out of the above analysis is that the effective added mass force, when the oscillation is harmonic and there is no mechanical damping, is simply the total lift force provided by the flow, and this lift force is governed by the fluid dynamics. Hence, the value of the critical mass will be set by the magnitude of the lift force that can be generated for a large-amplitude oscillation — the larger the lift force, the larger the effective added mass, and the larger mass that can be offset by the fluid forces resulting in large amplitude oscillations. Taking this into consideration allows the behaviour of the system to at least be qualitatively predicted as a function of the system parameters.
Shiels et al.(2001) considered numerically an absolute limiting case, where the body mass, damping and spring stiffness were all set to zero. In this case, equation(6)shows that the lift force must be exactly zero at all times. To understand how this can occur with large amplitude oscillations, it is useful to consider the mechanisms in the flow that generate force on the body.
If the flow is modelled as inviscid, then the force on the body is related to the vorticity field via the Reynolds transport theorem and the Biot–Savart law (Wu et al., 2006). Since the force is a direct outcome of the distribution of vorticity in the flow, any change in the position of a vortex with respect to the body will induce a change in the force. Since, for this limiting case, the force must remain exactly zero, the body must move such that the vorticity generated by this motion leads to a force that balances the force induced by moving the original vortex. The wake behind a bluff body is naturally unstable and will lead to vortex shedding, hence the movement of vortices in the wake, and so for this limiting case will necessarily lead to motion of the body.
Moving to a case with a finite, but small mass (but still no spring), it is clear that the same mechanisms hold. However, in this case the forces induced by the wake vortices and the vorticity induced by the body motion do not sum to zero, as Eq.(6)
shows the total lift force must balance the inertial force. So as the mass is slightly increased, the lift force must also increase. As this point, it is informative to consider some detail of how the lift force is generated.
The aforementioned Biot–Savart law relates vorticity to an ‘‘induced’’ velocity field. For a two-dimensional flow, this reduces to uω
=
1 2π
Z
Aω
×
r r2 dA.
(9)For a single, isolated point vortex of total circulationΓ, this reduces to uω
=
Γ
2
π
|
r|
(10)where
|
r|
is the distance from the vortex to the point at which the velocity is to be calculated. The direction of uω is perpendicular to the vector from the vortex to the point at which the velocity is to be calculated.Fig. 17. A schematic of the setup considered for calculating the impulse generated by the presence of a single vortex. R is the vector to the point on the contour of radius|R|,ξis the angle of R with respect to the horizontal, r is the vector from the vortex to the point on the contour,φis the angle between r and the free stream direction,ηis the position vector of the vortex,Γis the vortex strength, uωis the velocity vector induced by the vortex.
If this vortex is immersed in an inviscid background free stream flow of speed U, the total velocity field can be found by simply adding these two components together. This total velocity field can then be used to integrate the momentum flux through any given control volume boundary, to give an indication of the impulse generated by the presence of the vortex. If a contour is drawn around the body at a radius R, then the lift force due to this impulse will be
Fy
=
ρ
|
R|
Γ2
π
|
r|
Z
θ
U cos
θ
cosφ
+
Γcosφ
2
π
|
r|
(
sinφ
cosθ
+
cosφ
sinθ )
dθ
(11)where Fyis the lift due to the momentum flux. The basic system being considered, along with definitions of the vectors and
angles involved, is shown schematically inFig. 17.
Eq.(11)shows that the lift generated increases as the circulation of the shed vortex increases, with the second term in Eq.(11)effectively scaling withΓ2.
The above analysis indicates that a geometry that can generate wake vortices with stronger circulation will have the potential to generate a larger magnitude lift force. As the critical mass is the mass which results in an inertial force that can be balanced by the lift force, this indicates that the critical mass should increase for such a body. The bluffer geometry (compared to a cylinder) of an ellipse with its long axis across the flow (the 90◦case here) is expected to generate vortices with greater circulation due to the increased vorticity production in the boundary layers, and so it should have a higher critical mass than the circular cylinder. Conversely an ellipse with its long axis aligned with the flow (the 0◦case here) will produce vortices with less circulation, and therefore have a lower critical mass.
It should also be noted that typically the critical mass is reported in terms of the mass ratio, m∗
=
m/
(ρ
V ), where V is the volume of the body. In this study, the length scale has been taken as the length of the body across the flow. Hence, the ellipse at 90◦has less volume, and therefore less mass, for the same mass ratio. Therefore, even without the enhanced lift force due to increased circulation, the ellipse at 90◦should be expected to have a higher critical mass ratio than the equivalent cylinder. Conversely, the ellipse at 0◦, with a larger volume, should have a lower critical mass ratio.This is consistent with previous results.Ryan et al.(2005) showed that for a cylinder at Re
=
200 a critical mass ratio ofm∗
crit
=
0.
1. The current study has used a mass ratio m∗=
1. The 90◦case at this mass ratio appears to be below the criticalmass ratio, as would be expected for the higher circulation and smaller volume. The 0◦case however is above the critical mass ratio.
While the above analysis has been conducted for the simplified problem of purely sinusoidal motion, the same concepts will apply for cases where the oscillation is not sinusoidal. For all of the cases here where the body is not symmetric (i.e, where
θ
6=
0 orθ
6=
90) the oscillation is not expected to be sinusoidal.Fig. 4shows that large-amplitude oscillations occur for high values of U∗forθ >
70◦. This configuration is both bluff, increasing the circulation of the shed wake vortices and therefore the potential maximum lift, and small in volume, increasing the mass ratio for a given body mass. It is therefore reasonable to assume that the critical mass ratio increases withθ
, and that at some point it is greater than the value ofm∗
=
1 used here.3.5. Validity of two-dimensional analysis
The simulations conducted for this study are all two-dimensional, and so here the validity of this approach is discussed. The first question to address is whether the flows for the parameters studied are likely to be two-dimensional. The Reynolds number used, Re
=
200, is slightly over the threshold for transition to three-dimensional flow for a fixed cylinder (Barkley and Henderson, 1996). However, recent studies on the stability of the flow past fixed elliptical bodies (Leontini et al., 2015;Rao et al., 2017) have shown that when the body is slightly streamlined, this Reynolds number threshold is increased. Also, studies of controlled transverse oscillation of cylinders has shown that the oscillation typically increases Re at the threshold