READ THESE TERMS AND CONDITIONS CAREFULLY BEFORE USING THIS WEBSITE. https://nrc-publications.canada.ca/eng/copyright
Vous avez des questions? Nous pouvons vous aider. Pour communiquer directement avec un auteur, consultez la
première page de la revue dans laquelle son article a été publié afin de trouver ses coordonnées. Si vous n’arrivez pas à les repérer, communiquez avec nous à PublicationsArchive-ArchivesPublications@nrc-cnrc.gc.ca.
Questions? Contact the NRC Publications Archive team at
PublicationsArchive-ArchivesPublications@nrc-cnrc.gc.ca. If you wish to email the authors directly, please see the first page of the publication for their contact information.
NRC Publications Archive
Archives des publications du CNRC
This publication could be one of several versions: author’s original, accepted manuscript or the publisher’s version. / La version de cette publication peut être l’une des suivantes : la version prépublication de l’auteur, la version acceptée du manuscrit ou la version de l’éditeur.
Access and use of this website and the material on it are subject to the Terms and Conditions set forth at
Comparison of laboratory and field measurements of the sound insulation of a wood frame house
Bradley, J. S.
https://publications-cnrc.canada.ca/fra/droits
L’accès à ce site Web et l’utilisation de son contenu sont assujettis aux conditions présentées dans le site
LISEZ CES CONDITIONS ATTENTIVEMENT AVANT D’UTILISER CE SITE WEB.
NRC Publications Record / Notice d'Archives des publications de CNRC:
https://nrc-publications.canada.ca/eng/view/object/?id=76b3590a-59fe-472c-b4ca-62d9bdf5fa8b https://publications-cnrc.canada.ca/fra/voir/objet/?id=76b3590a-59fe-472c-b4ca-62d9bdf5fa8b
Comparison of laboratory and field measurements of the sound insulation of a wood frame house
Bradley, J.S.
NRCC-45382
A version of this document is published in / Une version de ce document se trouve dans : Inter-Noise 2002, Dearborn, Michigan, August 19-21, 2002, pp. 1-8
The 2002 International Congress and Exposition on Noise Control Engineering Dearborn, MI, USA. August 19-21, 2002
Comparison of Laboratory and Field Measurements of the
Sound Insulation of a Wood Frame House
J.S. Bradley
National Research Council, Montreal Rd., Ottawa, Canada, K1A 0R6 john.bradley@nrc.ca
Abstract
A simple wood frame test house was constructed at Ottawa Airport and aircraft noises were recorded at locations in each of two test rooms and outdoors. The construction of the test house was systematically varied by changing interior surfaces and by adding windows. For some tests interior masking walls were added to limit propagation to predominantly through
one of the exterior walls of each room. The measured ⅓ octave band noise reductions were
compared to predicted values from laboratory tests of exactly the same constructions. Ground reflections and internal flanking paths were found to influence results. When these were taken into account the mean prediction error was 3.1 dBA for walls without windows and only 0.5 dBA for walls with windows. The remaining errors were mostly due to differences in low frequency resonances between the laboratory and the field situations.
1. Introduction
Laboratory measurements of sound transmission loss (TL) are made under diffuse field conditions. However, for buildings exposed to aircraft noise, the incident sound arrives from a limited range of angles of incidence and the moving aircraft creates an incident noise spectrum that changes with time. The purpose of this work was to better understand the differences between laboratory measurements of TL and the effective sound insulation of the same constructions included as part of a complete building exposed to actual aircraft flybys. This work was part of a project that has included both extensive laboratory measurements of the sound transmission loss of building envelope components[1] and the field measurements included in this paper[2]. The project also combined the laboratory and field experiments into a software design tool[3].
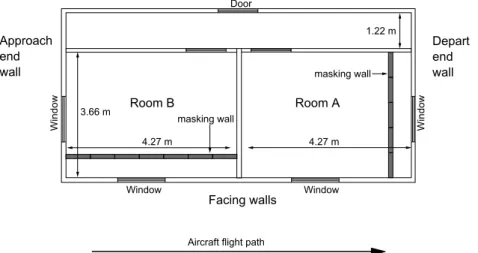
The field measurements described in this paper were obtained from systematic modifications to a single-story wood-frame test house built at Ottawa Airport (see Figure 1). Each of the two test rooms had one exterior wall facing the passing aircraft and another perpendicular to the flight track. For specific tests, additional internal masking walls were added to limit the predominant propagation paths to transmission through one of the two exterior walls of each
room. Details of the constructions were changed between each test. These included changes to internal surfaces as well as the subsequent addition of windows and various roof vents.
3.66 m 4.27 m Door Window Window Window Window 1.22 m masking wall masking wall
Aircraft flight path
Room A Room B 4.27 m Approach end wall Depart end wall Facing walls
Figure 1. Plan of the test house showing a configuration including windows.
Measurements were obtained from multi-track recordings of aircraft flybys. There were 3 microphones located in each test room and one outdoors on an 8.5 m high mast to measure
the incident sound energy. Noise reductions were calculated in each ⅓ octave from levels
integrated over each aircraft flyby.
2. Tests of Walls without Windows
The initial tests were for configurations where the predominant sound path was constrained to be through only one of the exterior walls of each room. There were no windows and the interior wall surface was a single layer of directly attached gypsum board. Figure 2 compares average measured and predicted noise reductions (NR) for the case of only the wall facing the passing aircraft exposed as in the room A drawing in Figure 1. Predicted NR values were based on the area, receiving room reverberation time (RT) and laboratory TL values. Figure 2 indicates excellent agreement at mid-frequencies between measured and calculated NR values. The overall A-weighted noise reductions (NR(A)) are included in the legend of each graph. 63 125 250 500 1k 2k 4k 10 20 30 40 50 60 NR(A) A measured, 31.2 dBA B measured, 31.7 dBA Predicted, 26.0 dBA NR , d B Frequency, Hz
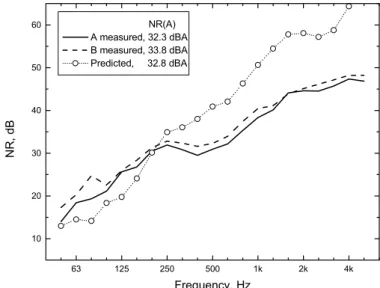
The cause of some of the larger differences between measurement and prediction were determined by examining the results of a more complex case in which the interior surfaces were changed to a double layer of gypsum board mounted on resilient channels. This change was expected to a produce substantial increase in the measured NR values [4]. However, the results in Figure 3 show that measured NR values were substantially less than predicted at higher frequencies but greater than expected at lower frequencies.
63 125 250 500 1k 2k 4k 10 20 30 40 50 60 NR(A) A measured, 32.3 dBA B measured, 33.8 dBA Predicted, 32.8 dBA NR , d B Frequency, Hz
Figure 3. Measured (room A and B) and predicted NR for internal surfaces consisting of two layers of gypsum board on resilient channels and both walls exposed.
These results first clearly demonstrate the danger of using overall A-weighted results. The A-weighted NR values included in the legend of Figure 3 indicate excellent agreement. Of
course the ⅓ octave spectra suggest substantial problems.
The differences at higher frequencies can be explained as due to a parallel structural flanking path that was not reduced by the addition of two layers of gypsum board on resilient channels and illustrated in Figure 4. It is similar in character to the flanking path from one row of studs to the other via the head and sole plates in staggered stud walls [1]. The results in Figure 3 were used to determine the effective TL of this structural flanking path which would have been present (but less obvious) for all measurement cases. This flanking path TL was then included in subsequent predictions of each measurement case and, for example, was found to account for the larger differences near 1.6 kHz in the Figure 2 results.
Direct h
Structural flanking h
The low frequency differences in Figure 3 are due to the destructive interference of direct and ground reflected aircraft noise. This causes the incident sound energy to be less than measured at the free field microphone and leads to an apparent increase in the low frequency NR values. This phenomenon would also occur for all measurement cases but for the other cases is combined with differences in the principal low frequency resonance that is found in wood stud walls without resilient channels[5]. The low frequency differences from Figure 3 were used as a further correction in the predictions of all measurement cases.
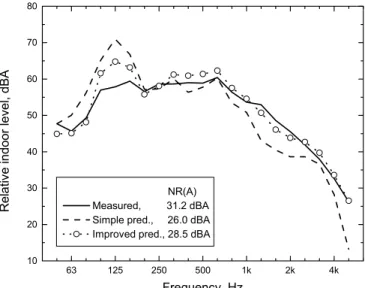
Using an aircraft noise source spectrum, subsequent results are presented as expected A-weighted indoor sound level spectra to better illustrate the importance of the low frequency phenomena. ‘Simple’ predictions are based on the areas, receiving room reverberation time and laboratory TL measurements of each component. The ‘improved’ predictions also include the effective structural flanking path TL and the effect of the low frequency reduction in incident energy due to the destructive interference of direct and ground reflected sound.
63 125 250 500 1k 2k 4k 10 20 30 40 50 60 70 80 NR(A) Measured, 31.2 dBA Simple pred., 26.0 dBA Improved pred., 28.5 dBA
Re la ti v e i ndo or l e vel , dB A Frequency, Hz
Figure 5. Measured and predicted indoor levels, room A, facing-wall exposed and constructed with single layer of directly attached gypsum board.
63 125 250 500 1k 2k 4k 10 20 30 40 50 60 70 80 NR(A) Measured, 29.4 dBA Simple pred., 25.7 dBA Improved pred., 28.3 dBA
Re la ti v e i ndo or l e vel , dB A Frequency, Hz
Figure 6. Measured and predicted indoor levels, room A, depart end-wall exposed and constructed with single layer of directly attached gypsum board.
Figure 5 compares indoor sound spectra from field measurements and the predictions from laboratory tests for the same initial case as in Figure 2. The ‘improved’ predictions agree well with measurements at most frequencies. There remains a significant difference around 125 Hz where the resonance dip in TL is not as dominant in the field measurements as in the lab results. Corresponding results for room B were very similar to those in Figure 5.
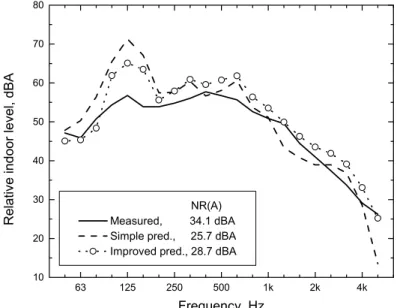
Figures 6 and 7 compare measured and predicted indoor A-weighted spectra for the cases of only the depart end-wall and only the approach end-wall exposed respectively. The Figure 6 results for the depart end-wall exposed show similar or better agreement than the face-wall results in Figure 5. However, for the approach-wall exposed case in Figure 7, measured indoor levels tend to be a little lower than predicted because the actual incident energy is less than expected from the free field microphone measurement. This is due to the directionality of typical commercial jet aircraft that tend to radiate less sound energy forward (as when approaching), leading to less incident energy on the approach-end of the building.
63 125 250 500 1k 2k 4k 10 20 30 40 50 60 70 80 NR(A) Measured, 34.1 dBA Simple pred., 25.7 dBA Improved pred., 28.7 dBA
Relativ e indoor le vel, dBA Frequency, Hz
Figure 7. Measured and predicted indoor levels, room B, approach end-wall exposed and constructed with single layer of directly attached gypsum board.
Both2-B Both2-A Both-B Both-A End-B End-A Face-B Face-A 20 25 30 35 40 Ex p o se d w a ll an d r o om
A-weighted level reduction, dBA
improved pred. simple pred. measured
Figure 8 summarises the results for other configurations without windows. These show only the face or end wall exposed in either room A or B as well as two cases of both walls
exposed. ‘Both’ corresponds to a construction with a single layer of directly attached gypsum board and ‘Both2’ to a double layer mounted on resilient channels (as in Figure 3 results). For the ‘simple’ predictions the mean error was -6.4 dBA, varying from –8.7 to –4.3 dBA differences. The ‘improved’ predictions gave values with a mean error of –3.1 dBA, varying from –5.4 to –1.1 dBA. Measured reductions were almost always greater than predicted and the ‘improved’ predictions were about a 3 dBA improvement over the predictions of the ‘simple’ predictions. The results indicate that the over-prediction of the indoor levels around 125 Hz is a major cause of the remaining error.
3. Tests of Walls with Windows
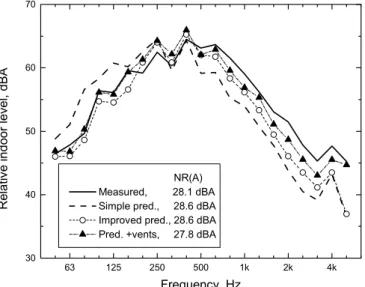
A similar sequence of constructions was tested with one or both exterior walls of each room exposed and including windows in the construction. The windows were manufactured double glazed units with two layers of 3 mm glass separated by a 13 mm air space. Figure 9 shows calculated A-weighted indoor sound levels from measured and predicted noise reductions to an aircraft noise source spectrum. These results are for the face-wall exposed and include a window in room A. The predictions include the ‘simple’ and ‘improved’ schemes previously described as well as a further addition to the ‘improved’ corrections of the experimentally determined effect of roof vents which were present for all tests with windows. The
predictions are more accurate for walls with windows because the flanking path and ground reflection effects have least effect in the 250 to 500 Hz region where these indoor sound levels are most significant.
63 125 250 500 1k 2k 4k 30 40 50 60 70 NR(A) Measured, 28.1 dBA Simple pred., 28.6 dBA Improved pred., 28.6 dBA Pred. +vents, 27.8 dBA
Re la ti v e i ndo or l e vel , dB A Frequency, Hz
Figure 9. Measured and predicted indoor levels, room A, face-wall exposed and constructed with double layer of gypsum board on resilient channels and including a window,
with the overall A-weighted NR included in the legend.
Figure 10 illustrates the results of another case with windows in which the end-wall in room B (approach) was exposed. For this case there is an important difference between measured and predicted values at 250 Hz, approximately the frequency of the mass-air-mass resonance of the window. This is thought to be because the effect of this resonance is dependent on the angle of incidence of the aircraft noise. Tests with a loudspeaker source supported this explanation. Thus measured indoor sound levels can be less than expected from laboratory
tests when this resonance is not so effectively excited because of the orientation of the building façade relative to the aircraft flight path.
63 125 250 500 1k 2k 4k 30 40 50 60 70 NR(A) Measured, 30.2 dBA Simple pred., 28.5 dBA Improved pred., 29.0 dBA Pred. +vents, 28.6 dBA
Re la ti v e i ndo or l e vel , dB A Frequency, Hz
Figure 10. Measured and predicted indoor levels, room B, end-wall exposed and constructed with double layer of gypsum board on resilient channels and including a window,
with the overall A-weighted NR included in the legend.
The measured and predicted overall A-weighted level reductions for cases including windows are summarised in Figure 11. The overall A-weighted level reductions were 3 to 7 dBA less than for the same wall construction without windows. The measured values were predicted with a mean error of 0.5 dBA varying from –2.4 to +1.6 dBA differences using the ‘simple’ predictions with only very small further differences for the ‘improved’ predictions. Although the improved corrections including the added effects of vents were seen to produce improved agreement at higher frequencies (e.g. in Figure 9 and 10) these additional corrections only had very small effects on the overall weighted indoor sound levels. The overall A-weighted levels are most influenced by small changes in the 200 to 630 Hz region such as
Face-A Face-B End-A End-B Both-A Both-B 20 25 30 35 40 Ex po sed w a ll a nd room
A-weighted level reduction, dBA Measured Simple pred. Improved pred. Pred.+ vents
those related to the mass-air-mass resonance of the windows. Accordingly, the lower frequency effects of ground reflections are less important for these walls with windows as are the higher frequency effects of structural flanking paths.
5. Conclusion
For the light-weight wood-frame construction of the test house and for walls without windows, ‘simple’ predictions based on the area and laboratory TL values of each component under-predicted measured noise reductions by 6.4 dBA on average. When the experimentally determined effects of structural flanking paths and ground reflections were included the mean prediction error was reduced to 3.1 dBA. The improvement was largely due to the inclusion of estimates of the ground reflection effects.
For walls including windows, the ‘simple’ calculations predicted measured noise reductions with a mean error of 0.5 dBA. Improved predictions resulted in only very small and inconsistent improvements. These results suggest that for typical residential construction including windows, the overall sound insulation can be quite accurately predicted from laboratory TL measurements. In some cases the orientation of the façade relative to the flight path may lead to higher than expected noise reductions in the field due to less effective excitation of the mass-air-mass resonance of the window.
Problems are to be expected when striving to achieve superior sound insulation for walls with minimal window areas. Standard procedures such as mounting gypsum board on resilient channels may not be effective. There can also be significant differences in the critical low frequency TL of walls between the lab and the field. In these tests, the critical principal low- frequency resonance of the wood stud walls was much less significant in the field measurements and ground reflection effects reduced the effective incident low frequency sound energy. These two effects both contribute to increased low frequency noise reductions in the field relative to predictions from laboratory measurements. Of course the benefit of ground reflections would only occur for a ground floor room.
Acknowledgements
The project was jointly funded by the National Research Council, Transport Canada, and the Department of National Defence with further support from Vancouver International Airport.
References
1. J.S. Bradley and J.A. Birta, “Laboratory Measurements of the Sound Insulation of Building Façade Elements”, IRC Internal Report, IR-818, October 2000.
2. 2. J.S. Bradley, K. Lay, and S.G. Norcross, “Measurements of the Sound Insulation of a Wood Frame House Exposed to Aircraft Noise”, IRC Internal Report, IR-831, October 2001.
3. J.S. Bradley and J.A. Birta, “IBANA-Calc: New Software to Calculate The Effect Of Sound Insulation Against Aircraft Noise”, Canadian Acoustics, 28, (3) 54-55, (2000).. 4. J.S. Bradley and J.A. Birta, “A Simple Model of the Sound Insulation of Gypsum Board
on Resilient Supports”, Noise Control Eng. J., 49, (5) 216-223, (2001).
5. J.S. Bradley, and J.A. Birta, “On the Sound Insulation of Wood Stud Exterior Walls”, J.