READ THESE TERMS AND CONDITIONS CAREFULLY BEFORE USING THIS WEBSITE.
https://nrc-publications.canada.ca/eng/copyright
Vous avez des questions? Nous pouvons vous aider. Pour communiquer directement avec un auteur, consultez la première page de la revue dans laquelle son article a été publié afin de trouver ses coordonnées. Si vous n’arrivez pas à les repérer, communiquez avec nous à [email protected].
Questions? Contact the NRC Publications Archive team at
[email protected]. If you wish to email the authors directly, please see the first page of the publication for their contact information.
NRC Publications Archive
Archives des publications du CNRC
This publication could be one of several versions: author’s original, accepted manuscript or the publisher’s version. / La version de cette publication peut être l’une des suivantes : la version prépublication de l’auteur, la version acceptée du manuscrit ou la version de l’éditeur.
Access and use of this website and the material on it are subject to the Terms and Conditions set forth at
Production of carbon monoxide during fire suppression using halon replacements
Su, J. Z.; Kim, A. K.
https://publications-cnrc.canada.ca/fra/droits
L’accès à ce site Web et l’utilisation de son contenu sont assujettis aux conditions présentées dans le site LISEZ CES CONDITIONS ATTENTIVEMENT AVANT D’UTILISER CE SITE WEB.
NRC Publications Record / Notice d'Archives des publications de CNRC:
https://nrc-publications.canada.ca/eng/view/object/?id=97614720-1ea3-409a-8f76-0a1708b9cc9a https://publications-cnrc.canada.ca/fra/voir/objet/?id=97614720-1ea3-409a-8f76-0a1708b9cc9a
Production of carbon monoxide during fire
suppression using halon replacements
Su, J. Z.; Kim, A. K.
A version of this paper is published in / Une version de ce document se trouve dans :
Sixth International Symposium on Fire Safety Science, 1999, pp. 327-336
www.nrc.ca/irc/ircpubs
PRODUCTION OF CARBON MONOXIDE DURING FIRE SUPPRESSION USING HALON REPLACEMENTS
Joseph Z. Su* and Andrew K. Kim
Fire Risk Management Program, Institute for Research in Construction, National Research Council of Canada, Ottawa, Canada K1A 0R6
ABSTRACT
During full-scale fire suppression tests, halon replacement agents (HFC-227ea and HCFC Blend A) were observed to produce an increased quantity of carbon monoxide (CO), in addition to the production of halogenated compounds. Agent-flame interaction resulted in the increased CO production in the fire tests. CO inhalation has been considered as an important cause of incapacitation in many fire incidents. Therefore, future risk assessment of potential exposure to toxic gases generated during fire suppression using halon replacements should include not only the toxic effect of halogenated compounds but also the toxic effect of CO and their combination.
KEYWORDS: halon replacement, fire suppression, carbon monoxide, and toxic hazard
1 INTRODUCTION
Carbon monoxide (CO) has been known as an important cause of incapacitation and death in many fire incidents [1]. However, its production during fire suppression using halon replacements and its safety implications are yet to be addressed. Up to now, the safety concerns for fire gas products from halon replacements have been limited to halogenated compounds, such as hydrogen halides and carbonyl halides, produced during fire suppression.
During full-scale fire-suppression tests conducted by the National Research Council of Canada [2-4], HFC-227ea (1,1,1,2,3,3,3-heptafluoropropane C3HF7) and HCFC Blend A
were found to produce not only the halogenated compounds but also an increased quantity of CO. (HCFC Blend A is a mixture of 82% chlorodifluoromethane CHClF2,
*
9.5% 2-chloro-1,1,1,2-tetrafluoroethane C2HClF4, 4.75% 2,2-dichloro-1,1,1-trifluoroethane
C2HCl2F3 and 3.75% D-limonene C10H16 by weight.) This paper analyzes the results of CO
measurement during the fire suppression tests and examines the contribution of the interaction between the halon replacements and fires to the increased production of CO.
2 EXPERIMENT
2.1 Fire Scenarios
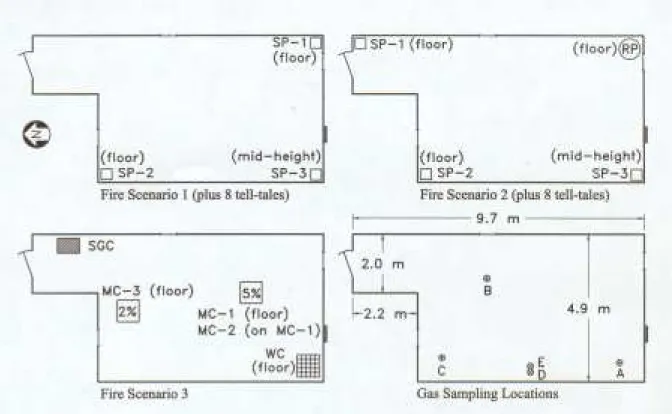
Fire suppression tests were conducted in a 121 m3 test compartment. Simulated electronic-cabinet fires, wood-crib (WC) fires and heptane-pool fires were used as test fires.
The heptane-pool fires included a round-pan (RP, 0.7 m diameter) fire, three
square-pan (SP, 0.3 m × 0.3 m) fires and eight tell-tale (TT, 75 mm diameter can) fires. The TT fires, placed strategically throughout the room, had an estimated total heat output of 50 kW. The heat release rates were estimated to be 400 kW for the RP fire and 50 kW for each SP fire.
The wood crib (0.6 m × 0.6 m × 0.24 m) was made of pine sticks (40 mm × 40 mm × 600 mm) arranged in 6 layers.
Three mock-up electronic cabinets (MC-1, MC-2 and MC-3) were used. Each mock-up cabinet was 0.81 m in length, 0.81 m in width and 1 m in height. MC-1 and MC-2 had a 5% opening area in the sides and MC-3 had a 2% opening area. A tell-tale fire was placed inside each mock-up cabinet. An electronic switching-gear cabinet (SGC, 0.75 m × 0.61 m × 2.13 m) with 10% grill openings was used in some tests. A cable bundle fire (with diesel-soaked hemp rope as an ignitor) and a tell-tale fire were placed inside SGC at the upper and lower levels, respectively.
These test fires were used to form three fire scenarios as shown in Figure 1. A pre-burn of 30 s was allowed for the heptane pool fires and a pre-burn of 2 min was allowed for the wood crib fire. The compartment door was kept open during the pre-burn to prevent oxygen depletion and was then closed. Fuel was sufficient for at least 3 min of burning. The suppression agent was discharged into the compartment and the door was closed at the same time.
Fire tests without suppression were also conducted in order to compare gas product generation. The tests without suppression are hereafter referred to as the free burn tests. In the free burn tests, the door was also closed after the same pre-burn but the test fires were left to burn until heptane was exhausted or the WC fire was self-extinguished. The quantity of heptane fuel was varied to control the free burning time. Since Fire Scenario 2 had the largest heat release rate, the free burn test used a smaller quantity of heptane fuel so that the free burning time would not exceed 1 min in order to prevent thermal damage to the test compartment. The free burning times for the three scenarios are shown in Table 1.
FIGURE 1. Plan view of test room, fire scenarios and locations, and gas sampling locations (⊕: A, B, C for FTIR; ⊗: D, E for nondispersive infrared analyzers).
2.2 Fire Suppression Agents
The fire suppression tests were conducted in the total-flooding mode using two halon replacement agents (HFC-227ea and HCFC Blend A) and Halon 1301. The design
concentrations were 7.6% for HFC-227ea, 12% for HCFC Blend A and 5% for Halon 1301. The discharge times were approximately 10 s. Fire extinguishment times using HFC-227ea, HCFC Blend A and Halon 1301 are summarized in Table 1.
TABLE 1. Time for Fire Extinguishment or Free Burn (by seconds)
Fire Scenario Major Fires HCFC Blend A HFC-227ea Halon 1301 Free Burn a 1 (heptane fuel) SP-1 SP-2 SP-3 11 10 4 8 8 14 3 3 3 195 b 190 b 230 b 2 (heptane fuel) SP-1 SP-2 SP-3 RP 4 5 2 6 4 4 6 3 5 5 4 4 40-50 b (all four pans)
3 (wood crib) WC 30 15 11 180 c
a
A pre-burn period is included in the free burn time. b
The fire burned until heptane was exhausted. c
2.3 Gas Measurement
The Fourier transform infrared (FTIR) spectroscopic method and nondispersive infrared CO/CO2 gas analyzers were used to measure the CO and CO2 concentrations during
the fire tests. The FTIR measurements of HFC-227ea, HCFC Blend A and halogenated compounds produced during the fire tests have been discussed in a separate paper [2].
FTIR Measurement and Analysis. Gas samples were drawn by pumps from
Locations A, B and C in the compartment (as shown in Figure 1) through three gas sampling lines to an FTIR measurement system during the tests. Quartz sampling ports were mounted at 1.5 m (Location A), 0.6 m (Location B) and 2.8 m (Location C) above the floor,
respectively. The sampling lines were made of stainless steel tubing of 7.75 mm inside diameter and 9 m length. A solenoid valve-switching device was used to connect one gas sampling line to the FTIR spectrometer and the other two sampling lines to exhaust concurrently. The gas samples from the three locations were alternately forwarded to the FTIR spectrometer for measurement. The gas samples flowed through a cylindrical gas cell (10 cm pathlength, 32 mm aperture, 110 mL volume) at a flow rate of 8 L/min. The
spectrometer scanned the gas samples in the frequency range of 400 to 4500 cm-1 at 1 cm-1 resolution. Each spectrum from every single scan was recorded every 2 s. (The FTIR gas cell and the three gas sampling lines were heated to 160oC to prevent the condensation of sample gases.)
The FTIR spectrometer was calibrated using the Matheson certified standard mixtures (binary nitrogen mixtures). The gas standards had purity of better than 99.9% and certified concentrations with a 2% relative uncertainty. The calibration for each certified mixture was conducted at the same flow rate through the FTIR gas cell as that in the fire tests.
The FTIR spectrometer was calibrated for CO2 at 2.23, 3.75, 3.91 and 5.08%.
Figure 2 shows an infrared spectrum for the calibration of 2.23% CO2. The characteristic
absorption band in the frequency region of 2225 to 2400 cm-1 was integrated to give a reference peak area for each known CO2 concentration. A linear relationship between the
CO2 concentration and the absorption area was derived. The infrared spectra from the fire
tests were integrated in the same frequency range and the concentrations of CO2 produced in
the test compartment were determined using the linear relationship.
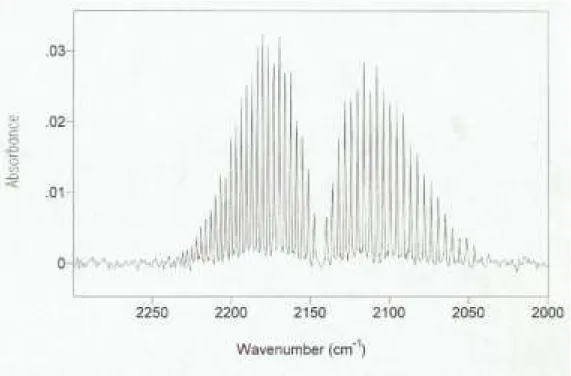
For the CO calibration, the concentrations used were 102 and 1091 ppm. Figure 3 shows the unique absorption band of CO in the frequency region of 2030 to 2250 cm-1 obtained during the CO calibration at a concentration of 1091 ppm. The absorption band has a high-frequency side (known as the R-branch) and a low-frequency side (known as the P-branch). The eight strongest peaks were selected from each branch as the references for determining the CO concentration. The CO concentration in each fire test was quantified by comparing the absorption peak heights from the fire tests with the reference peak heights obtained from the calibration.
FIGURE 2. FTIR spectrum for the calibration of 2.23% carbon dioxide.
Measurement Using Nondispersive Infrared Analyzer. Nondispersive infrared analyzers were also used to measure the concentrations of CO and CO2 during the fire tests.
The analyzers were connected to two sampling ports located at Locations D and E (shown in Figure 1). The sampling ports were mounted at 1.5 m (Location D) and 2.8 m (Location E) above the floor, respectively. The concentration of oxygen was also measured at Location D or E using an O2 analyzer. These gas analyzers gave direct readings of the concentrations of
CO, CO2 and O2 in the test compartment.
3 RESULTS AND DISCUSSION
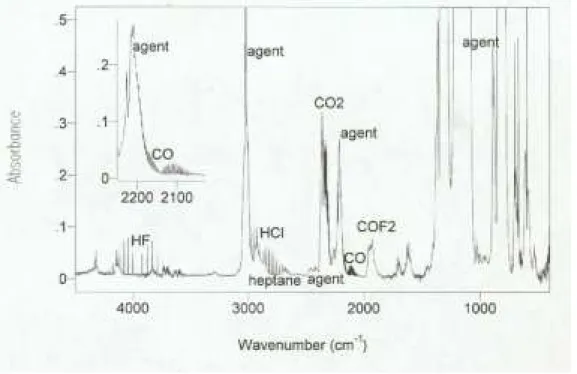
Figures 4 and 5 show a single frame of the time-resolved FTIR spectra in the HCFC Blend A and HFC-227ea fire tests, capturing the "finger-prints" of several chemical species produced during the fire suppression tests. The major fire gas products were halogenated compounds, CO and CO2. The results from the measurements of halogenated compounds
(hydrogen fluoride, carbonyl fluoride and hydrogen chloride) produced during the fire tests have been discussed in a separate paper [2].
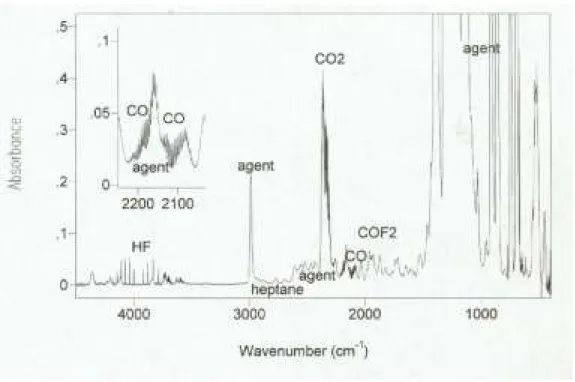
Nondispersive infrared CO/CO2 gas analyzers were designed to work in the
frequencies of 2000 to 2400 cm-1 where CO and CO2 have strong absorption to the infrared
light. The two replacement agents, as shown in Figures 4 and 5, also absorb infrared light in these frequencies. The nondispersive infrared analyzers, therefore, count everything that absorbs infrared light in these frequencies as CO and CO2 and give higher readings of the
concentrations of CO and CO2 in the HFC-227ea and HCFC Blend A tests. When such gas
analyzers are used for the concentration measurement of CO and CO2, the interference from
the halon replacement agents should be corrected.
FIGURE 5. FTIR spectrum in an HFC-227ea test.
The gas analyzers are fast and reliable instruments for CO and CO2 measurements
when no other chemicals interfere in their working frequencies. In such cases, the gas analyzer readings for the CO and CO2 concentrations are in good agreement with those
determined using the FTIR spectrometer.
The FTIR method has advantages in monitoring CO and CO2 production during fire
tests and in determining their concentrations. When interference from other chemical compounds exist in the characteristic frequencies for CO and CO2, proper FTIR
spectroscopic analysis can eliminate or reduce the effect of the interference on the end results.
3.1 CO Production
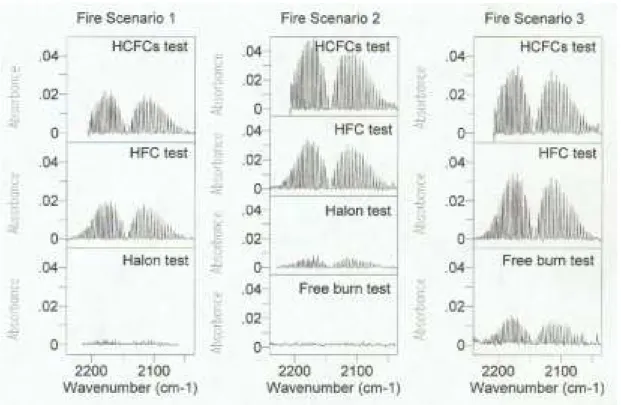
In the FTIR analysis, a baseline correction is made to each spectrum to eliminate the interference from the agents in the CO and CO2 frequencies. Figure 6 shows
baseline-corrected FTIR spectra of CO in the HCFC Blend A and HFC-22ea tests. For a convenient presentation, these spectra have been averaged over the three sampling locations for 3 min starting 1 min after agent discharge. The average FTIR spectra for CO from the fire suppression tests using Halon 1301 and from the free burn tests are also plotted on the same figure for comparison. (The spectra for the free burn tests are the average over the three sampling locations for 3 min starting 1 min after closing the door. The free burning time after closing the door in the free burn tests was longer than the fire extinguishment time in the fire suppression tests.) The spectra indicate that the concentrations of CO produced during the HCFC Bend A and HFC-227ea tests are higher than those during the Halon 1301 and the free burn tests.
FIGURE 6. Average FTIR spectra of CO with baseline correction in fire tests.
CO concentration-time profiles are averaged over the three FTIR sampling locations for 3 min starting 1 min after agent discharge. The time-averaged concentrations of CO from the FTIR analysis are shown in Table 2. Combustion of the fuel can only account for part of the CO production in the HCFC Bend A and HFC-227ea tests. Extra CO production in the HCFC Bend A and HFC-227ea tests suggests that agent-flame interaction results in an increased CO production. The results indicate that variables such as fire size and extinguishment time have a large effect on the resulting concentration of CO in the test compartment. A large fire size and a slow fire extinguishment increase the CO concentration in the compartment, similar to the concentration of halogenated compounds. More work is needed to understand the chemical kinetics and explain the increased CO production in the HCFC Bend A and HFC-227ea tests.
TABLE 2. Time-Averaged CO Concentration from FTIR analysis (parts per million)
Test → Fire Scenario ↓
HCFC Blend A HFC-227ea Halon 1301 Free Burn
1 (heptane fuel) 800 700 100 50
2 (heptane fuel) 1700 1200 200 30
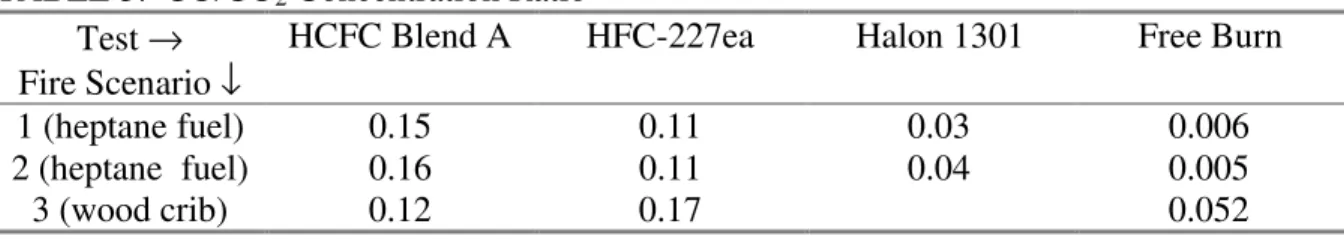
3.2 CO/CO2 Concentration Ratio
The ratio of the CO concentration to the CO2 concentration in the fire tests provides a
convenient way to assess the CO generation. The concentrations of CO2 produced during the
HCFC Bend A and HFC-227ea tests were less than 2% and consistent with those produced during the free burn tests. Table 3 shows the CO/CO2 concentration ratios in the fire tests.
For the heptane pool fires, the CO/CO2 ratio in the HCFC Blend A and HFC-22ea tests is
20-30 times higher than those in the free burn tests and 3-5 times higher than those in the Halon 1301 tests. For the wood crib fire, the CO/CO2 ratio in the HCFC Blend A and
HFC-22ea tests is 2-3 times higher than those in the free burn test, even though the wood crib burned longer in the free burn test.
Recently, fire suppression tests were also conducted for water mist and argon, respectively, using the same fire scenarios in the same test compartment. The CO/CO2 ratio
is less than 0.02 in the argon tests and less than 0.03 in the water mist tests.
The high CO/CO2 ratios in the HCFC Bend A and HFC-227ea tests also indicate that
agent-flame interaction results in an increased CO production in these fire tests.
TABLE 3. CO/CO2 Concentration Ratio
Test → Fire Scenario ↓
HCFC Blend A HFC-227ea Halon 1301 Free Burn
1 (heptane fuel) 0.15 0.11 0.03 0.006
2 (heptane fuel) 0.16 0.11 0.04 0.005
3 (wood crib) 0.12 0.17 0.052
3.3 Safety Implications
CO can combine with hemoglobin in human blood to form carboxyhemoglobin and reduce the carriage of oxygen in the blood [5-7]. It alone can cause incapacitation and even death if the product of its concentration and exposure time exceeds a safe dose. The upper permissible exposure limit for CO is 200 ppm, which has been established by the US Occupational Safety and Health Administration [7]. In the HCFC Blend A and HFC-227ea tests, the CO concentration already exceeds the allowed exposure limit. Although the primary safety concern is the toxic effect of HF, COF2 and/or HCl produced in the HCFC
Blend A and HFC-227ea tests, an increased CO production in these tests further compounds the issue of toxicity. The combined toxic effect of CO and the irritating halogenated
compounds on humans is not well understood but safety measures should be taken to prevent human exposure to the fire gases.
4 CONCLUSIONS
Gas measurement showed that an increased quantity of carbon monoxide was produced during fire suppression tests with HCFC Blend A and HFC-227ea, in addition to the toxic and corrosive halogenated compounds, such as HF, COF2 and HCl. As with the
increased with increasing fire sizes and extinguishment times. Combustion only contributed to part of the CO production. Agent-flame interaction caused the increase in CO production in the fire tests, as indicated by higher CO concentrations and CO/CO2 ratios in the HCFC Blend
A and HFC-227ea fire tests. The combined toxic effect of CO with the halogenated compounds would be greater than that of any single gas product in the fire gases. Safety measures should be taken to prevent possible exposure to the toxic gases. Risk assessment of potential exposure to toxic gases generated during fire suppression using halon replacements should include not only the toxic effect of halogenated compounds but also the toxic effect of CO and their combination. Further investigation of the chemical kinetics involved in the CO production is needed.
ACKNOWLEDGEMENTS
The National Research Council of Canada wishes to acknowledge the Department of National Defence Canada's funding of this research project. The authors wish to thank Mr. George Crampton and Dr. Malgosia Kanabus-Kaminska of the National Research Council of Canada's Fire Risk Management Program for their contributions in constructing the test facility and participating in the fire tests.
REFERENCES
1. Nelson, G.L., "Carbon Monoxide and Fire Toxicity: A Review and Analysis of Recent Work", Fire Technology, 34:1, 39-58, 1998.
2. Su, J.Z., Kim, A.K. and Kanabus-Kaminska, M., "FTIR Spectroscopic Measurement of Halogenated Compounds Produced during Fire Suppression Tests of Two Halon Replacements", Fire Safety Journal, 31:1, 1-17, 1998.
3. Kim, A.K., Su, J.Z., Mawhinney, J.R. and Kanabus-Kaminska, M., "Full-Scale Fire Testing of HFC-227ea and HCFC Blend A", in Proceedings of Halon Options Technical Working Conference, pp. 413-422, Albuquerque, New Mexico, 1996.
4. Su, J.Z. and Kim, A.K., "Full-Scale Evaluation of Gaseous Fire Suppressants", in
Proceedings of International Conference on Ozone Protection Technologies, pp. 565-573, Washington, D.C., 1996.
5. Sax, N.I. and Lewis, R.J., Dangerous Properties of Industrial Materials, 7th ed., Van Nostrand Reinhold, New York, 1989.
6. Purser, D.A., "Toxicity Assessment of Combustion Products", in SFPE Handbook of Fire Protection Engineering, ed. P.J. DiNenno, C.L. Beyler, R.L.P. Custer, W.D. Walton, J.M. Watts, Jr., D. Drysdale, and J.R. Hall, Jr., 2nd ed., Section 2, Chapter 8, National Fire Protection Association, Quincy, Massachusetts, 1995.
7. Occupational Safety and Health Administration, OSHA Regulated Hazardous Substances, Noyes Data Corp., Park Ridge, 1990.