HAL Id: hal-00991359
https://hal-enac.archives-ouvertes.fr/hal-00991359
Submitted on 4 Sep 2015HAL is a multi-disciplinary open access archive for the deposit and dissemination of sci-entific research documents, whether they are pub-lished or not. The documents may come from teaching and research institutions in France or abroad, or from public or private research centers.
L’archive ouverte pluridisciplinaire HAL, est destinée au dépôt et à la diffusion de documents scientifiques de niveau recherche, publiés ou non, émanant des établissements d’enseignement et de recherche français ou étrangers, des laboratoires publics ou privés.
Tasks : A Behavioral and P300 Analysis
Louise Giraudet, Marie Berenger, Jean-Paul Imbert, Sebastien Tremblay,
Mickael Causse
To cite this version:
Louise Giraudet, Marie Berenger, Jean-Paul Imbert, Sebastien Tremblay, Mickael Causse. Inatten-tional Deafness in Simulated Air Traffic Control Tasks : A Behavioral and P300 Analysis. AHFE 2014, 5th International Conference on Applied Human Factors and Ergonomics, Jul 2014, Kraków, Poland. �hal-00991359�
Inattentional Deafness in Simulated Air
Traffic Control Tasks:
A Behavioral and P300 Analysis
Louise Giraudet a, Marie Bérenger a, Jean-Paul Imbert b, Sébastien Tremblay c and Mickaël Causse a a
Institut Supérieur de l’Aéronautique et de l’Espace Université de Toulouse Toulouse, 31054, FRANCE b
Laboratoire d'Informatique Interactive Ecole Nationale de l'Aviation Civile
Université de Toulouse Toulouse, 31055, FRANCE
c
School of Psychology Université Laval Québec, QC G1V 0A6, CANADA
ABSTRACT
The acoustic environment is critical in Air Traffic Control (ATC), as operators exchange information with planes and must also be aware of the occurrence of auditory alarms. In such situations, observing inattentional deafness is likely. In this study, we aimed to identify the physiological indicators of inattentional deafness through the analysis of the P300 evoked potential, known to be an indicator of attention allocation, an important step to a stimulus reaching consciousness. Based on the assumption that the high mental load generated by an ATC task may reduce the alarm detection rate, we wished to test whether this effect would be reflected in the alarm-evoked P300 amplitude. Participants had to perform simulated ATC tasks within the LABY microworld while electroencephalographic (EEG) activity was recorded. Simultaneously to the LABY tasks, participants were asked to respond to target tones (the “alarm”) and to ignore standard tones. Behavioral results showed that 4.6% of alarms were not reported. For these alarm detection failures, the EEG analysis showed a diminution of the P300 amplitude in comparison to a control condition in which participants only focused on the tones. These results suggest that the P300 amplitude seems to be a valid physiological indicator of vulnerability to inattentional deafness in complex environments. Relevant applications include the prevention of alarm omission and the assessment of warning designs.
INTRODUCTION
According to several authors (Dehais et al., 2013; Bliss, 2003), the problem of missed alarms occurs frequently across a range of flight environments and extends to air traffic control (ATC) since the development of auditory notifications and warnings is increasingly integrated within ATC workstations (Cabrera, Ferguson, & Laing, 2006). In addition to their well-documented limitations (e.g. stress, cry-wolf effect, c.f. Edworthy, Loxley, & Dennis, 1991), auditory alarms sometimes fail to be perceived, especially in critical situations. This propensity to remain unaware of fully audible stimuli is often referred to as inattentional deafness (Koreimann, Strauß, & Vitouch, 2009). According to the perceptual load theory (Lavie, Hirst, de Fockert, & Viding, 2004), tasks involving high perceptual load consume most of attentional capacity, leaving little remaining for processing information that is not related directly to the focal task, such as unexpected alarms (Hughes, Hurlstone, Marsh, Vachon, & Jones, 2012; Moore, Fuchs, Rees, Palmer, & Plack, 2010; Spence & Read, 2003; Wood & Cowan, 1995). The inattentional deafness phenomenon is especially critical when this cognitive limitation affects operators who must deal with dynamic and complex tasks and are confronted with temporal pressure, stress and high-risk decisions, in safety-critical environments (nuclear power station supervisors, airline pilots or ATC controllers). In the case of ATC controllers, their work environment is very cognitively demanding and they are under great time pressure. They must remain focused on managing planes and interacting with pilots and other controllers, yet they must be vigilant and responsive to the occurrence of critical auditory alarms such as collision avoidance alerts or danger area infringement warnings.
Interestingly, Macdonald and Lavie (2011) showed that participants involved in a visual discrimination task were prone to inattentional deafness. Occurrences of inattentional deafness were even greater when the visual task involved a high level of perceptual load compared to low perceptual load. Under the assumption that attentional resources are shared between vision and hearing (Brand-D’Abrescia & Lavie, 2008; Santangelo, Olivetti Belardinelli, & Spence, 2007; Sinnett, Costa, & Soto-Faraco, 2006), it seems likely that engaging a task under high visual load may lead to a decline in the probability of detecting an auditory stimulus. Following the perceptual load theory and its extension to cross-modal effects of visual perceptual load (Macdonald and Lavie, 2011), one could argue that the high perceptual load typical of ATC operations may reduce the attentional capacity left for processing additional unexpected auditory alerts, thus increasing the likelihood of inattentional deafness. In order to establish whether inattentional deafness is modulated by visual and cognitive load, we manipulated perceptual (number of objects in the visual scene) as well as cognitive load (tempo, i.e. the number of events, changes, per unit of time) within a simulation of ATC-like tasks.
Physiological indicators of inattentional deafness
The brain activity involved in processing auditory information has been particularly studied using Electroencephalography (EEG) techniques to measure Event-Related Potentials (ERPs). P300, one of the most commonly studied ERPs and usually measured between 300 and 500 ms post-stimulus (see Hansenne, 2000 for a detailed review), is known to be induced by oddball paradigms in which participants are instructed to detect targets among non-targets, or oddballs – series of to-be-ignored standard stimuli (see Polich, 2007). The oddball paradigm is assumed to require cognitive and attentional processing for stimulus recognition and attention allocation (Polich & Kok, 1995). When attentional focus deviates from the target stimulus, the P300 amplitude significantly decreases (Singhal, Doerfling, & Fowler, 2002). Therefore, P300 seems an excellent candidate to determine whether an auditory stimulus has broken through the attentional barrier. The investigation of the relation between inattentional deafness in ATC context and the operators’ P300 amplitude potentially leads to real-time detection of inattentional deafness or evaluation of available attentional resources of the controllers.
Objective and hypotheses
Our objectives are twofold. Firstly, contrary to previous studies (Macdonald & Lavie, 2011) in which only one occurrence of the inattentional deafness phenomenon was successfully observed, we aimed at designing an experimental protocol able to provoke the phenomenon several times within each participant. Given the poor signal-to-noise ratio associated with EEG, this repetition is required to examine the possible concomitance between inattentional deafness and P300 modulations. Secondly, we intended to measure the inattentional deafness rate and P300 amplitude across several visual and processing load conditions. Participants handled simulated air traffic through the LABY microworld software across two visual load and two cognitive load conditions while their EEG activity was recorded. In parallel to the LABY task, they were asked to respond to target tones (the “alarm”) and to
ignore standard tones, or in other words, to conduct the oddball paradigm task. Participants also went through a control condition, in which they only performed the oddball task.
Our first hypothesis was that the ecological ATC task would be more likely to induce the appearance of inattentional deafness in comparison to the control condition. Our second hypothesis was that the decrease in the alarm detection rate (deviant sounds) during the ATC task would be concomitant with reduction of the P300 amplitude, suggesting that visual/processing load directly affects the cerebral response to an auditory stimulus, providing physiological explanation regarding the inability of operators to perceive critical auditory warnings. Finally, we hypothesized that higher visual/processing load during the ATC task should increase inattentional deafness rate and diminished P300 amplitudes.
METHOD
Participants
Forty-two volunteers, all students of Université Laval between 19 and 46 years old, were recruited for this study (mean age M = 24.4 years, standard deviation SD = 6 y.). None of them had a history of neurological disease, psychiatric disturbance, substance abuse, or taking psychoactive medications. They all received full information on the experiment protocol, signed an informed consent and received compensation for their participation in the study. Six participants were removed from the analysis due to problems in their EEG recordings. Participants were divided into two groups of 18 students. The first group was associated with the classic ATC type of visual notifications called Color-Blink, and the second group with an evolved type of notifications called Box-Animation. The effects of the type of notifications were not examined in this paper.
The LABY microworld and the auditory oddball task
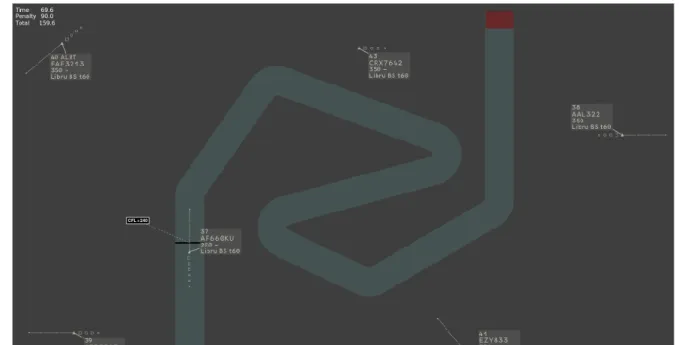
ATC task. The LABY microworld is an ATC simulation software. It is built around the main task of guiding an
aircraft around a route shown on the display screen (Figure 1). Participants had to monitor the path and altitude of this aircraft. For this purpose, they were given instructions, with a pop-up window close to the aircraft, to enter control commands using drop-down menus. Participants were penalized in their overall score in one of two ways. A deviation in the assigned route resulted in the aircraft crossing the border of the assigned route, a visual alert in the center of the screen, and eventually, an inability to control the aircraft. An error in the altitude instructions resulted in the aircraft maintaining its trajectory, no alert, and continued control. The simulation ended as soon as the aircraft reached the arrival area at the end of the corridor.
In addition to this central aircraft, participants had to manage a set of static aircraft located in the peripheral vision around the main aircraft corridor, simulating the display of a radar image (Figure 1). The number of peripheral aircraft depended on the visual load level of the scenario. Visual notifications could be displayed for these peripheral aircrafts (Figure 2), either the Color-Blink type for the first group, or the Box-Animation type for the second group, which participants had to acknowledge by clicking on the aircraft associated with the notification. Only one notification related to the peripheral aircraft was issued at a time. The aircraft with the notification was randomly selected among the static aircrafts. The notification disappeared as soon as the participant clicked on the associated aircraft. If the participant did not react within a given time (depending on the speed condition, see Table 1), the notification disappeared and the score was decreased. Thirty-four visual notifications were displayed in each scenario.
Figure 1. Screenshot of the LABY microworld simulation. The main aircraft is in the corridor. An altitude instruction is displayed on its left. Five static peripheral aircraft are positioned around the corridor. The arrival area is colored in red, at the e nd of the
corridor.
Figure 2. The two types of visual notifications. On the left, the Color-Blink notification, on the right the Box-Animation notification.
We created four LABY scenarios (Table 1) with two levels of visual load, (5 or 20 peripheral aircraft) and two levels of speed (speed of the central aircraft = 0.6 or 0.99 notional velocity units). The number of path and altitude instructions, visual notifications, and auditory alarms were the same in each scenario. Only the number of peripheral aircraft among which to search for a notification and the speed of the simulation were changed.
Table 1: Characteristics of the four scenarios.
Scenario Speed condition Visual load condition
A
Slow:
main aircraft speed: 0.6 units mean time window between two tones: 4.2 sec mean time window between two notifications: 17 sec
Low:
5 peripheral static aircrafts
B
Slow:
main aircraft speed: 0.6 units mean time window between two tones: 4.2 sec mean time window between two notifications: 17 sec
High:
20 peripheral static aircrafts
C
Fast:
main aircraft speed: 0.99 units mean time window between two tones: 2.6 sec mean time window between two notifications: 12 sec
Low:
5 peripheral static aircrafts
D
Fast:
main aircraft speed: 0.99 units mean time window between two tones: 2.6 sec mean time window between two notifications: 12 sec
High:
Auditory oddball task. In parallel to the ATC task, participants also had to perform an auditory alarm detection task.
Standard tones (1000 Hz, 52.5 dB, 500 ms long, probability = 0.8) and deviant tones (2000 Hz, 52.5 dB, 500 ms long, probability = 0.2) were randomly played. The mean time window between successive tones depended on the speed of the scenario. Participants were told to consider the deviant tones as auditory warnings and to report them as fast as possible by pressing a specific button. A 42 dB white noise was played continuously during the experiment. Participants performed two alarm detection tasks in isolation, in both the slow and fast speed conditions, to determine a control detection rate and P300 amplitude. These tasks were completed after the four ATC scenarios (two visual loads * two speeds). During those two control tasks, the same oddball paradigm task as in the other scenarios was used, but only a white cross was displayed at the center of the screen. The order of those two control tasks was counterbalanced between participants.
Procedure
The whole procedure lasted about 2.5 hours. First, participants had to fill out behavioral questionnaires: the Pichot Fatigue questionnaire (Pichot & Brun, 1984) and the State-Trait Anxiety Inventory (STAI Form Y-B, Spielberger, 2010). Then, they completed a training phase until they were comfortable enough with the LABY microworld software to correctly enter a path and altitude instructions through the drop-down menus, to acknowledge a visual notification and to report a deviant sound. After the training, the participants were seated comfortably at 60 cm from the 30 inch screen, with their right hand on the computer mouse and their left hand on the auditory alarm button, in a sound-dampening room. The three EEG electrodes were placed on their scalp and calibrated. Following this step, they completed the four counterbalanced ATC scenarios. Between each scenario, they filled the NASA Task Load Index (NASA TLX, see Cao, Chintamani, Pandya, & Ellis, 2009) questionnaire and answered questions concerning the auditory alarms and visual notifications they perceived in the previous scenario. Participants finally performed the two control oddball tasks in the two speed conditions.
EEG recordings and data processing
Continuous EEG recordings were performed with a ProComp Infinity™ encoder (Thought Technology Ltd). Just before the beginning of the four scenarios, three electrodes were placed for bipolar measurements: the positive electrode on the Pz site (parietal lobe), the reference electrode on the left side of forehead and the ground ear-clip electrode on the right ear lobe. The EEG signal was recorded at a sampling rate of 256Hz with a 0.5Hz high-pass filter and 49Hz low-pass filter.
EEG data analysis was performed using EEGLAB 11.0.3.1b (Delorme & Makeig, 2004) running under MATLAB 7.1 (The Mathworks). The EEG signals were segmented into epochs around the auditory stimulus (from 200 ms before stimulus onset to 1200 ms after). The time window for the average amplitude of the P300 was defined as 364 to 464 ms stimulus, determined from a 100 ms wide time window around the peak latency (414 ms post-stimulus) of the P300 among participants.
Statistical analysis
Statistical analyses were performed using Statistica 7.1 (StatSoft ©). Results were considered statistically significant at p < .05. Mean percentage of correct responses to the central aircraft guiding task, visual notifications detection rate, auditory alarm detection rate, reaction times, and mean P300 amplitude were calculated for the four scenarios. We defined a speed factor (slow vs. fast) and a visual load factor (low vs. high). Visual load * speed interactions were not analyzed. The alarm detection rate and mean P300 amplitude were also analyzed in the two control tasks as reference. Behavioral and physiological data were assessed by one-way ANOVAs to compare the ATC task to the control condition, and by 2*2 ANOVAs to investigate the effect of the factors speed and visual load during the ATC task.
RESULTS
Behavioral results
Auditory alarm detection rate. First, we compared the detection rate in the two control tasks to check for an eventual
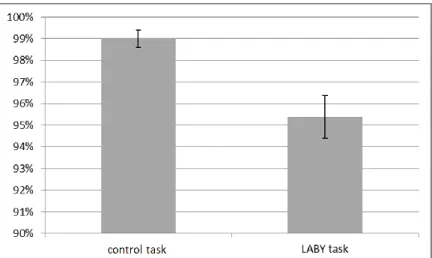
effect of the speed of the oddball sounds series. No significant effect was found (p = .291), allowing us to reasonably merged the two control tasks into one “control condition” for following analysis. Then, we compared the detection rate in the control condition to the detection rate in the LABY task, all scenarios merged, for the factor “task”. There was a significantly lower detection rate in the LABY task condition (M = 95.40%, SD = 5.93%) than in the control condition (M = 99.0%, SD = 2.41%), F(1, 35) = 17.16, p < .001, η²p = .33, cf. Figure 3). Then we performed a 2x2 ANOVA with the within-subjects factors “speed” and “visual load” (mean detection rates for the 4 conditions are reported in Table 2). There was no significant effect of the speed (p = .351) or of the visual load (p = .984) on the auditory alarm detection rate, and no significant interaction.
Figure 3. Mean auditory alarm detection rate, with standard errors, for the control task and the LABY task. Table 2: Auditory alarm detection rates for the four conditions.
condition auditory alarm detection rate
Slow M = 95.94% SD = 5.75% Fast M = 94.86% SD = 7.79% Low M = 95.39% SD = 7.20% High M = 95.41% SD = 5.90%
NASA TLX. We analyzed the NASA TLX scores for “mental demand”, “temporal demand”, “performance” and
“effort” in a 2x2 ANOVA with the within-subjects factors “speed” (slow vs. fast) and “visual load” (low vs. high). There was a significant effect of the speed on those 4 scores (see Table 3). The mental demand, temporal demand performance and effort were rated higher in the fast condition than in the slow condition, supporting our experiment design with speed modulation increasing the processing load in the fast condition. The visual load only had a significant impact on the mental demand dimension. No significant interaction was found.
Table 3: Effects of speed and visual load for the NASA TLX scores
NASA TLX score Significant Speed effect Significant visual load effect
Mental demand F(1, 35) = 29.68, p < .001, η²p = .49 slow : M = 47.93, SD = 21.24 fast : M = 57.54, SD = 21.61 F(1, 35) = 9.72, p = .004, η²p = .22 low : M = 49.54, SD = 22.14 high : M = 55.93, SD = 21.15 Temporal Demand F(1, 35) = 32.20, p < .001, η²p = .48 slow : M = 45.29, SD = 21.38 fast : M = 58.25, SD = 20.53 no (p = .097) Performance F(1, 35) = 13.69, p < .001, η²p = .28 slow : M = 23.81, SD = 18.36 fast : M = 33.85, SD = 17.96 no (p = .536) Effort F(1, 35) = 22.20, p < .001, η²p = .39 slow : M = 39.99, SD = 18.04 fast : M = 50.06, SD = 20.78 no (p = .229)
Performance to the central aircraft guiding task. There was a significant effect of speed on the correct altitude
instructions rate (in the slow condition: M = 96.24%, SD = 3.25%, in the fast condition, M = 84.68%, SD = 12.40%,
F(1, 35) = 45.10, p < .001, η²p = .56, see Figure 4), while the visual load had no significant effect (p = .915).
Figure 4. Mean accuracy rate to the altitude instructions, with standard errors, for the slow condition and the fast condition. Visual notifications detection rate. There was a significant effect of both the speed and the visual load on the visual
notifications detection rate. Significantly fewer visual notifications were reported under the fast condition (M = 96.41%, SD = 5.54%) than under the slow condition (M = 99.11%, SD = 2.09%), F(1, 35) = 11.43, p = .002, η²p = .25, and under the high visual load condition (M = 97.06%, SD = 4.41%) than under the low visual load condition (M = 98.47%, SD = 3.05%), F(1, 35) = 7.05, p = .012, η²p = .17 (Figure 5). There was no significant interaction.
Figure 5. Mean detection rate for the visual notifications, with standard errors, for the slow, fast, low visual load and high visual load conditions.
P300 results
As for the behavioral data, we compared the two control tasks to check for effect of the speed of the oddball sounds series on the auditory P300 amplitude to validate our choice to merge the two control tasks into one baseline condition. The ANOVA showed no effect of the speed (p = .364).
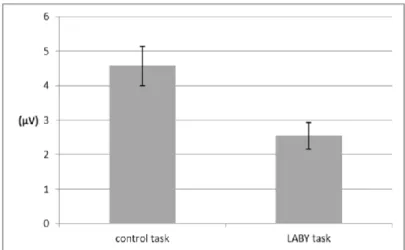
Following the same methodology as for the auditory alarms detection rate, we compare the mean P300 auditory amplitude observed when participants were focused on the tone only, the control condition vs. when the tones had to be detected in parallel of the LABY scenarios. There was a significantly lower P300 in the LABY task condition (M = 2.55µV, SD = 2.31µV) than in the control condition (M = 4.57µV, SD = 3.42µV), F(1, 34) = 14.29, p < .001, η²p = .30 (Figure 6).
Figure 6. Mean auditory P300, with standard errors, for the control task and the LABY task.
We finally performed a 2x2 ANOVA with the factors speed and visual load for the 4 LABY scenarios. There was no significant effect of the speed (p = .274) or the visual load (p = .789) on the P300 amplitude.
CONCLUSIONS
Our study aimed at creating an ecological experiment enabling the inattentional deafness phenomenon to occur multiple times within each participant. We designed four ATC LABY scenarios with two levels of visual load and two level of speed. While participants were performing this task, an oddball paradigm was administered simultaneously to assess their ability to detect an alarm (i.e. the deviant sound in the oddball paradigm). We hypothesized that the mental load generated by the ATC task would modify the ability of the participants to detect the simultaneously occurring alarm. As a consequence, the inattentional deafness rate during the ATC scenarios was hypothesized to be higher than in the control condition. In addition, we assumed that the diminution of the auditory P300 amplitude would be concomitant with the occurrence of inattentional deafness. The behavioral results showed that our task was successful in generating inattentional deafness. Participants missed 4.6% of the alarms in the dual tasks whereas only 1% of the alarms were missed under the control condition. This result corroborates the assumption that the introduction of a visual task recruits and monopolizes part of the attentional resources of an operator, making him/her less efficient in an auditory task.
As expected, this increase in the number of missed alarms during the LABY task was concomitant with a drastic decrease in the auditory P300 amplitude, showing a physiological correlation to the lack of attentional resources in the cerebral response of the operator. While the speed and the visual load factors had no impact on either the physiological responses to auditory alarms or the alarm detection rate, they modulated the performance of the LABY task and the visual notifications detection rate. This result suggests that the participants managed to keep their level of performance to the auditory oddball task despite the increase in the speed and visual load, by dedicating more attention resources to it. One may argue that this compensatory allocation of attentional resources to the oddball task resulted in degrading performance on the ATC task. The increase in the speed and the visual load were perceived by the participants, according to the NASA TLX scores analysis. However, despite this behavioral and subjective
result, we can hypothesize that the load manipulation was not strong enough to exhaust capacity and strongly alter the oddball performance and auditory P300 amplitude. This possible scenario equivalence could be addressed by reducing the time windows between sounds and notifications, limiting resting time and bringing more response competition to the ATC task.
Despite this lack of difference between the four conditions, it is interesting to note that even in the “easier” conditions (i.e. in the low visual load and slow conditions), the participants were still subject to inattentional deafness (4.06% of missed alarms in the low load condition and 4.61% in the slow condition). Even in situations perceived as moderately demanding, the physiological responses to auditory alarms were altered and the risk of failing to detect an alarm remained. An interesting extension of this study could be to further increase and contrast the different levels of visual load and speed to analyze if it could eventually differentially impact the alarms detection rate and the P300 amplitude. This study also opens the way to new paradigms using electrophysiological measurements on working operators, and to new means to evaluate visual notification or auditory alarm designs.
REFERENCES
Bliss, J. P. (2003). Investigation of alarm-related accidents and incidents in aviation. The International Journal of Aviation
Psychology, 13(3), 249–268.
Brand-D’Abrescia, M., & Lavie, N. (2008). Task coordination between and within sensory modalities: Effects on distraction.
Perception & Psychophysics, 70(3), 508–515.
Cabrera, D., Ferguson, S., & Laing, G. (2005). Development of auditory alerts for air traffic control consoles. In Audio
Engineering Society Convention 119. Audio Engineering Society. Retrieved from
http://www.aes.org/e-lib/browse.cfm?conv=119&papernum=6531
Cabrera, D., Ferguson, S., & Laing, G. (2006). Considerations Arising From The Development Of Auditory Alerts For Air Traffic Control Consoles. group, 14(5), 2.
Cao, A., Chintamani, K. K., Pandya, A. K., & Ellis, R. D. (2009). NASA TLX: Software for assessing subjective mental workload. Behavior Research Methods, 41(1), 113–117.
Dehais, F., Causse, M., Vachon, F., Régis, N., Menant, E., & Tremblay, S. (2013). Failure to Detect Critical Auditory Alerts in the Cockpit Evidence for Inattentional Deafness. Human Factors: The Journal of the Human Factors and Ergonomics
Society. doi: 10.1177/0018720813510735
Delorme, A., & Makeig, S. (2004). EEGLAB: an open source toolbox for analysis of single-trial EEG dynamics including independent component analysis. Journal of Neuroscience Methods, 134(1), 9–21.
Edworthy, J., Loxley, S., & Dennis, I. (1991). Improving auditory warning design: Relationship between warning sound parameters and perceived urgency. Human Factors: The Journal of the Human Factors and Ergonomics Society, 33(2), 205–231.
Hansenne, M. (2000). [The p300 cognitive event-related potential. I. Theoretical and psychobiologic perspectives]. Neurophysiol
Clin, 30(4), 191-210.
Hughes, R. W., Hurlstone, M. J., Marsh, J. E., Vachon, F., & Jones, D. M. (2012). Cognitive Control of Auditory Distraction: Impact of Task Difficulty, Foreknowledge, and Working Memory Capacity Supports Duplex-Mechanism Account. Koreimann, S., Strauß, S., & Vitouch, O. (2009). Inattentional deafness under dynamic musical conditions.
Lavie, N., Hirst, A., de Fockert, J. W., & Viding, E. (2004). Load theory of selective attention and cognitive control. Journal of
Experimental Psychology: General, 133(3), 339.
Macdonald, J. S., & Lavie, N. (2011). Visual perceptual load induces inattentional deafness. Attention, Perception, &
Psychophysics, 73(6), 1780–1789.
Moore, D. R., Fuchs, P. A., Rees, A., Palmer, A., & Plack, C. J. (2010). The Oxford Handbook of Auditory Science: The Auditory
Brain (Vol. 2). Oxford University Press. Retrieved from http://books.google.fr/books?hl=en&lr=&id=Kyq65C3ygGAC&oi=fnd&pg=PR7&dq=Fuchs+Plack+Rees+Palmer+20 10+The+Oxford+Handbook+Hearing&ots=wGTYIRGnOL&sig=f0BOj7bAq1SfcW521wpV6YvRWHk
Pichot, P., & Brun, J.-P. (1984). [Brief self-evaluation questionnaire for depressive, asthenic and anxious dimensions]. In Annales
medico-psychologiques (Vol. 142, pp. 862–865). Retrieved from http://europepmc.org/abstract/MED/6524792
Polich, J., & Kok, A. (1995). Cognitive and biological determinants of P300: an integrative review. Biological psychology, 41(2), 103-146.
Polich, J. (2007). Updating P300: an integrative theory of P3a and P3b. Clinical Neurophysiology: Official Journal of the
International Federation of Clinical Neurophysiology, 118(10), 2128.
Santangelo, V., Olivetti Belardinelli, M., & Spence, C. (2007). The suppression of reflexive visual and auditory orienting when attention is otherwise engaged. Journal of Experimental Psychology. Human Perception and Performance, 33(1), 137. Singhal, A., Doerfling, P., & Fowler, B. (2002). Effects of a dual task on the N100-P200 complex and the early and late Nd
attention waveforms. Psychophysiology, 39(2), 236-245. doi: 10.1017/s0048577202011009
Quarterly Journal of Experimental Psychology, 59(8), 1425–1442.
Spence, C., & Read, L. (2003). Speech shadowing while driving on the difficulty of splitting attention between eye and ear.
Psychological Science, 14(3), 251–256.
Spielberger, C. D. (2010). State-Trait Anxiety Inventory. Wiley Online Library. Retrieved from http://onlinelibrary.wiley.com/doi/10.1002/9780470479216.corpsy0943/full
Wood, N. L., & Cowan, N. (1995). The cocktail party phenomenon revisited: Attention and memory in the classic selective listening procedure of Cherry (1953). Journal of Experimental Psychology: General, 124(3), 243.