HAL Id: inserm-00708786
https://www.hal.inserm.fr/inserm-00708786
Submitted on 15 Jun 2012
HAL is a multi-disciplinary open access archive for the deposit and dissemination of sci-entific research documents, whether they are pub-lished or not. The documents may come from teaching and research institutions in France or abroad, or from public or private research centers.
L’archive ouverte pluridisciplinaire HAL, est destinée au dépôt et à la diffusion de documents scientifiques de niveau recherche, publiés ou non, émanant des établissements d’enseignement et de recherche français ou étrangers, des laboratoires publics ou privés.
A method for selecting and monitoring medication sales
for surveillance of gastroenteritis.
Camille Pelat, Pierre-Yves Boëlle, Clément Turbelin, Bruno Lambert,
Alain-Jacques Valleron
To cite this version:
Camille Pelat, Pierre-Yves Boëlle, Clément Turbelin, Bruno Lambert, Alain-Jacques Valleron. A method for selecting and monitoring medication sales for surveillance of gastroenteritis.: Medication sales selection for syndromic surveillance. Pharmacoepidemiology and Drug Safety, Wiley, 2010, 19 (10), pp.1009-18. �10.1002/pds.1965�. �inserm-00708786�
A method for selecting and monitoring medication sales for surveillance of
gastroenteritis
Camille Pelat, MSc (1,2), Pierre-Yves Boëlle, PhD (1,2), Clément Turbelin, MD (1,2), Bruno Lambert, PhD (3), Alain-Jacques Valleron, PhD (1,2)
(1) INSERM, U707, Paris, 75012 France;
(2) Université Pierre et Marie Curie-Paris 6, UMR-S 707, Paris, 75012 France; (3) IMS-Health, Puteaux, 92807 France
Running head: Medication sales selection for syndromic surveillance
Corresponding author:
Camille Pelat
Réseau Sentinelles - INSERM UMR-S 707 Faculté de Médecine Pierre et Marie Curie Site Saint-Antoine / porte 807
27 rue Chaligny, 75571 Paris cedex 12, FRANCE Tel. : +33 1 44 73 84 61 - Fax : +33 1 44 73 84 54 Email : pelat@u707.jussieu.fr
Keywords: Population Surveillance, Disease Outbreaks, Communicable Disease Control,
Pharmacoepidemiology
Key points:
• The selection method presented in this paper allowed selecting relevant drugs for syndromic surveillance purposes from a massive database of drugs sales.
• The selected drugs provided early and specific alerts of gastroenteritis outbreaks. This research was funded by the French Institute for Health and Medical Research (INSERM).
The authors declare that they have no conflict of interest.
ABSTRACT
Purpose
Monitoring appropriate categories of medication sales can provide early warning of certain disease outbreaks. This paper presents a methodology for choosing and monitoring medication sales relevant for the surveillance of gastroenteritis and assesses the operational characteristics of the selected medications for early warning.
Methods
Acute diarrhoea incidences in mainland France were obtained from the Sentinelles network surveillance system for the period 2000-2009. Medication sales grouped by therapeutic classes were obtained on the same period. Hierarchical clustering was used to select therapeutic classes correlating with disease incidence over the period. Alert thresholds were defined for the selected therapeutic classes. Single and multiple voter algorithms were investigated for outbreak detection based on sales crossing the thresholds. Sensitivity and specificity were calculated respective to known outbreaks periods.
Results
Four therapeutic classes were found to cluster with acute diarrhoea incidence. The therapeutic class other antiemetic and antinauseants had the best sensitivity (100%) and timeliness (1.625 weeks before official alerts), for a false alarm rate of 5%. Multiple voter algorithm was the most efficient with the rule: “Emit an outbreak alert when at least 3 therapeutic classes are over their threshold” (sensitivity 100%, specificity 95%, timeliness 1.750 weeks before official alerts).
Conclusions
The presented method allowed selection of relevant therapeutic classes for surveillance of a specific condition. Multiple voter algorithm based on several therapeutic classes performed slightly better than the best therapeutic class alone, while improving robustness against abrupt changes occurring in a single therapeutic class.
INTRODUCTION
Medication sales are increasingly advocated as relevant data sources for syndromic surveillance of acute diseases like influenza-like illness (ILI) and gastroenteritis.1,2
Identification of the most relevant medications for surveillance of a specific condition may be based on a “candidate” approach using prior knowledge or assumptions. For example, Okhusa et al used common-cold medications to monitor ILI because “use of such medications has long been accepted in Japanese society as the first and more common treatment for influenza-like illness”.3 Other authors also used a fixed set of “cold remedies” as a starting point to their analysis,4,5 while some focused on electrolyte products to detect paediatric respiratory and diarrhoeal outbreaks.2 Expert advice was sometimes sought: the National Retail Data Monitor relied on clinician expertise to create and select medication categories for surveillance of ILI and diarrhoeal illness.6 Stirling et al allowed pharmacists to decide which drugs they would report.7 A panel of experts was consulted by Vergu et al to select therapeutic classes for prediction of ILI trends.8
More and more detailed datasets on medication use in large populations are available. In such instances, a “data driven” approach to drug selection for surveillance is advisable, using statistical algorithms to identify the medications the most closely associated to the disease of interest. For example, Das et al. calculated the ratio of sales during peak period to non-peak period to identify a subset of drugs within a group of “cold” medications, for ILI surveillance.9 Li et al. explored through canonical correlations the relationships between a set of diagnoses and a time series of electrolyte sales.10
We took this approach further by using an extensive database of drug sales and described how to select, without a priori knowledge, therapeutic classes likely to inform on the studied disease and to be of use in a syndromic surveillance system. Acute diarrhoea (AD) was taken as an example. We further assessed the operational characteristics of the selected drugs for early warning.
DATA AND METHODS
Data
continental France (59% of pharmacies).11 Data are aggregated into 593 therapeutic classes along the Anatomical Classification of the European Pharmaceutical Marketing Research Association (EphMRA).12
The analyzed database covered the period between week 36 of 2000 and week 16 of 2009. 384 classes spanned the whole period. Sales were measured in boxes sold for each therapeutic class, for each week, for 100,000 inhabitants.
The national weekly rates of incidence of AD for 100,000 inhabitants in France were provided by the Sentinelles network.13 This network is composed of general practitioners who send observations on 10 health indicators to a national database that can be accessed at www.sentiweb.fr. A case of AD was defined as at least 3 daily watery stools, dating less than 14 days, motivating the consultation.
Selection of relevant therapeutic classes
A hierarchical clustering procedure, using the average distance,14 was applied to the time series of therapeutic class sales and AD rate of incidence. The distance between two time series was defined as 1 minus Pearson’s correlation coefficient at the best lag.
Relevant drug sales were identified as those clustering around AD in the hierarchical tree after cutting the tree at an arbitrary height. Increasing the height in cutting the tree increased the number of selected drugs. A decision algorithm was designed to choose the cutting height: the selection process was repeated with various cutting heights and the set of therapeutic classes leading to the best performances, in terms of epidemics detected, false alert rate and timeliness, was selected.
Outbreak detection method
We used the limited baseline CUSUM to provide outbreak alerts based on medication sales. This statistic was chosen since it proved to be efficient when few historical data are available.15,16 As only high values of sales were expected to indicate epidemics, a one-sided upper CUSUM was used.
+ − − = + − + 1 ) ( ) ( ~ ~ , 0 max t r r t t k C s y y C ,
with yt, t=1,2,…, the series of observations and =0
+ −d t
C .
The running mean ~y(r)and the running variance 2 ) (
~
r
s were calculated from the r observations
1
,..., − −
−
−d r i d
i y
y preceding the most recent d weeks. An alert was emitted when the upper
CUSUM Ct+ exceeded a predefined detection threshold.
Outbreak detection evaluation
The detection performances of the therapeutic classes were measured by three characteristics: sensitivity, specificity and timeliness.16,17
Epidemic periods were determined using the official alerts made public by the Sentinelles network at the national level. These alerts are obtained by applying a periodic regression model on AD rates of incidences.18
An acceptable detection window was defined as all weeks within the epidemic period and the 2 preceding weeks. Alerts emitted in the detection window qualified as true alerts.
Sensitivity was defined as the proportion of detected epidemics, i.e. if an alert occurred during the detection window. Specificity was defined as the proportion of weeks outside the detection window for which no alert was emitted. Timeliness was defined as the time of the first true alert minus the start of the epidemic period. Note that with the definition used for true alerts, alerts emitted by a therapeutic class will have at the most a two-week lead on the official dates of the epidemic. When there was no detection, timeliness was undefined.
These measures were combined into an overall measure of performance, the area under the weighted receiver operating characteristic curve (AUWROC),17 see the Appendix. This curve represents the sensitivity weighted by the timeliness (sensitivity × f(timeliness)) in y-axis against 1-specificity in x-axis, for different detection thresholds. An area close to 1 indicates
good sensitivity, specificity and timeliness, while an area close to 0 indicates a low performance for at least one of these 3 features.
Various parameter combinations, given in Table A.1 of the Appendix, were tested for the CUSUM method. For each parameter combination, the detection threshold was varied between 0 and 15 by 0.1 step to provide a broad coverage in terms of sensitivity and specificity.
“Multiple voter” monitoring
“Multiple voter” monitoring of the selected therapeutic classes was conducted by different rules: alerts were emitted when at least one, two, three or four CUSUMs exceeded their threshold.
Analyses were done with R version 2.8.0.19
RESULTS
Selection of relevant therapeutic classes
Selection of therapeutic classes for AD surveillance was done on the classes that existed during the whole study period.
First, a hierarchical tree was built from the drug sales database and AD rate of incidence. Figure 1 shows the reordered database, where similar looking time series clustered together. The tree was cut at height 0.5 to form 54 clusters.
Figure 2 illustrates the process of cutting the tree and forming clusters. Four therapeutic classes were present in the same cluster than AD: other antiemetics and antinauseants (A04A9), motility inhibitors (A07H), all other antidiarrhoeals (A07X) and intestinal
adsorbent antidiarrhoeals (A07B). The best correlations of the therapeutic class sales with
AD rate of incidence were respectively 0.78, 0.78, 0.64 and 0.55 for A04A9, A07H, A07X and A07B (p<10-5); these were obtained at lag 0 for all classes, meaning that peaks of sales and incidences occurred at the same time.
The selected therapeutic classes belonged to 2 super-groups of the EphMRA classification which were antiemetics and antinauseants (A04) and antidiarrhoeals, oral electrolyte
replacers and intestinal anti-inflammatories (A07). Note that all the selected A07 classes
refer to antidiarrhoeal medications.
Time series of selected therapeutic classes were plotted along AD rate of incidence (Figure 3.a). It can be seen on this figure that the selected therapeutic class sales presented a seasonal pattern coinciding with AD rate of incidence, confirming the peak synchrony suggested by the cross correlation zero lags.
Univariate monitoring
The selected therapeutic classes were analyzed for outbreak detection with the limited baseline CUSUM. Weeks before week 10 of 2001 were excluded from the evaluation, to let the CUSUM start running. Summer periods (weeks 18 to 35 of each year) were excluded from the evaluation.
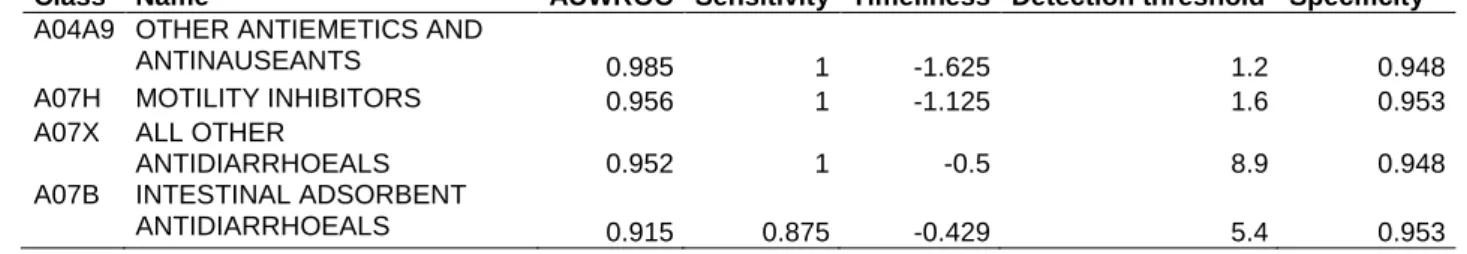
For each therapeutic class, the parameter combination that gave the highest AUWROC was selected (see Table A.2 of the Appendix for details of selected parameters). The sensitivity and timeliness for the detection threshold leading to the specificity closest to 95% were reported, with the AUWROC, in Table 1. Each time a CUSUM crossed its threshold was marked by black rectangles in figure 4. The class other antiemetics and antinauseants (A04A9) maximized the AUWROC (0.985). For a fixed specificity of 95%, it had the best sensitivity (100%) and timeliness (1.625 weeks before official alerts).
“Multiple voter” monitoring
The CUSUM for each therapeutic class was set with the parameter combination that provided the best AUWROC. The threshold for each CUSUM was the one that provided the specificity closest to 95%. Then, a unique epidemic indicator was created by merging the different CUSUM statistics using a voting rule. The rule “Emit an outbreak alert when at least 3 CUSUMs are over their threshold” had the best detection performances, with a sensitivity of
100%, a specificity of 95% and a timeliness of 1.750 weeks before official alerts (see Table 2).
Sensitivity analysis for the cutting height parameter
If the tree was cut at height 0.6, a branch containing 12 more therapeutic classes would have been added to the selected therapeutic classes (see Figure 3.b). Their cross correlations with AD rate of incidence were respectively 0.70, 0.65, 0.55, 0.54, 0.52, 0.51, 0.49, 0.49, 0.47, 0.44, 0.43 and 0.37 for R04A, R05A, R01B, R01A7, A11G1, H02A2, R02A, R05D1, R01A9, R01A1, D06D1 and R03X2. “R” classes refer to respiratory system medications.
Sensitivity of topical antivirals (D06D1) for detection of acute diarrhoea outbreaks was 88% for a fixed specificity of 95% (timeliness: 0.857 weeks before officials alerts). The other classes had low sensitivities (0 to 0.375) and emitted late alerts (1 to 6 weeks after official ones).
When included in the multiple voter algorithm, they decreased its performances: sensitivity was 100%, specificity 89% and timeliness 1.25 weeks before official alerts, for the best rule “Emit an outbreak alert when at least 3 CUSUMs are over their threshold”. Figure 5 presents the mean AUWROC over the classes selected using different cutting heights: it decreases when the cutting height augments.
Thus, according to the decision rule described in the method section, only the 4 classes of the cluster previously obtained by cutting the tree at height 0.5 were kept.
DISCUSSION
We proposed a method for identifying and monitoring therapeutic classes for syndromic surveillance of gastroenteritis, within an extensive medication sales database.
Reactive surveillance system alerting about the start of gastroenteritis epidemics are useful for different public health players. Practitioners may consider gastroenteritis as a differential diagnosis on certain syndromes; pharmacies can use it to manage their stock. Public health messages, concerning for example children dehydration prevention, can be timely broadcasted and individual protection measures such as hand washing encouraged in the population.
Disposing of an alternative data source that strengthens and anticipates traditional epidemiological alerts would allow these public health actions to be launched earlier.
Three antidiarrhoeal classes (motility inhibitors (A07H), all other antidiarrhoeals (A07X) and
intestinal adsorbent antidiarrhoeals (A07B)) and one antiemetic class (other antiemetics and antinauseants (A04A9)) were selected for surveillance through a data mining approach.
Antidiarrhoeals and antiemetics have proven elsewhere to be efficient for detecting gastroenteritis outbreaks of unknown origin,9 viral origin,20 or bacterial origin.7,21 Electrolyte products, used for detecting paediatric diarrhoeal outbreaks by Hogan et al, were not present in the database to allow comparison.2
While these authors selected drugs relying on expert advice, the therapeutic classes were selected here by a data-mining algorithm, among 384 therapeutic classes. The availability of large databases of drug sales has previously pushed some authors toward finding algorithms for objectively selecting drugs, while still incorporating human a priori selection. For example, Das et al. calculated the ratio of sales during peak period to non-peak period to identify relevant drugs within a group of “cold” medications.9 We took this approach further by analyzing an extensive database of drug sales, without any a priori knowledge, using hierarchical clustering.
Hierarchical clustering was previously used by Magruder et al on a set of “cold remedies” to aggregate medications that had similar sale patterns.4 The clustering process described in the present paper differed from the one by Magruder et al on the following points. We did not select an a priori list of medication sales, but instead used all therapeutic classes present in the IMS-Health database. This makes the approach feasible even when a priori relevant medications cannot be defined.
Then, we used the time series of acute diarrhoea rate of incidence together with the time series of sales in the clustering process. Indeed, our approach required selecting several candidate therapeutic classes for the detection of gastroenteritis outbreaks, rather than aggregating them into groups according to their sales pattern.
The hierarchical clustering method allowed grouping away non-relevant medications which would have been captured by a traditional correlation analysis. Indeed, some flu medications, in particular chest rubs and other inhalants (R04A) and cold preparation without
anti-infectives (R05A), had a high correlation coefficient with AD rate of incidence (respectively
0.70 and 0.65, p<10-5), higher than all other antidiarrheals (A07X) and intestinal adsorbent
antidiarrheals (A07B) (respectively 0.64 and 0.55, p<10-5). However, they did not have enough similarity with antidiarrhoeals or antiemetics sales to be placed in the same cluster. Thus, the clustering algorithm placed them in a cluster distant from the one formed by AD rate of incidence, antidiarrhoeals and antiemetics. If included, their detection performances would have been low: AUWROC=0.772 for R04A and AUWROC=0.627 for R05A.
Several methods exist for the monitoring of multiple time series. Some authors monitored directly the sum of various drug sales.7,21 We tested this approach by monitoring the summed sales of the 4 selected therapeutic classes with a CUSUM. The best AUWROC was 0.971, and for a fixed specificity of 95%, sensitivity was 100% and timeliness 1.750 weeks before official alerts. This detection performance was the same than the one obtained by the multiple voter algorithm. However, keeping each series individualized in the analysis allowed visualizing the distinctive characteristics of each therapeutic class, even more if they did not have the same mean volume of sales.
Multivariate methods take into account the correlations between time series.22 While this seems to be the most unrestrictive approach, specification of the correlation structure must be decided a priori and remain fixed along time. Furthermore, only linear correlation can be taken into account. Finally, complex specification of the model hampers straightforward interpretation.
Therefore, a multiple univariate method was undertaken in this paper: the CUSUM statistics were separately calculated on the 4 selected therapeutic classes and merged into a single epidemic indicator by a voting rule. This approach performed as well as multivariate methods for detecting influenza outbreaks using ILI time series.22 It has the advantage to produce a single alert indicator (as multivariate methods do) while providing individual detection statistics for each series. The results can therefore be better validated by human experts. Moreover, if one of the time series exhibits at one point a strange pattern, it can be immediately identified and removed from the multiple univariate detection while deeper
investigations are launched. Using the multiple voter algorithm instead of the best class A04A9 alone allowed gaining in timeliness (from 1.625 to 1.750 weeks) while keeping the same sensitivity (100%) and specificity (95%).
There are some methodological limitations to the present study. Firstly, three potential sources of overfitting were identified: 1) Epidemic detection was run on the same subset of the series that was used to select the most informative therapeutic classes (in reality, this subset was the whole time series). 2) This same subset was used both to optimize the detection method parameters and to evaluate its performances (sensitivity, specificity and timeliness). 3) The “known epidemic periods” used to measure the detection performances were defined with a periodic regression model applied to the time series of acute diarrhoea rate of incidence, which was also used to select the therapeutic classes.
A solution to avoid overfitting from sources 1 and 2 would have been to split the data into a first period used to select therapeutic classes, a second period used to train the detection method and a test period to evaluate detection performances. However, in the present case, we only had access to 9 years of data, which is too small to provide meaningful splits in training and testing blocks. Concerning the third source of overfitting, it would have been interesting to have access to epidemic periods defined with another data source. The only other surveillance system monitoring gastroenteritis in the population in France is based on emergency department data. However, it only started in 2004 and does not release alerts nor give access to its data.
A second limitation to this study is that the uncertainty surrounding individual performances of the selected therapeutic classes (AUWROC, sensitivity, specificity and timeliness) was not assessed. However it should be stressed that the selection of therapeutic classes relied on a hierarchical clustering process that did not involve AUWROC comparisons. Thus, uncertainty around performance measures did not impact which classes were kept for surveillance: all the 4 classes selected via the clustering process were kept into the multiple univariate detector, independently of their individual AUWROC. Performance measures only played a role in the selection process when deciding if the inclusion of a wider group of therapeutic classes improved the multivariate detection performance.
Finally, the generalizability of the presented selection method to other epidemiological contexts has to be assessed on an individual basis. Indeed, it allowed extracting the therapeutic classes “closest” to acute diarrhoea incidence but did not guarantee that they would allow outbreak detection: detection performance relies on the specificity of the selected medications for the disease under surveillance and on how well a consumption change in the population reflects an increase in incidence (self-medication, stockpiling).
We could observe in the IMS-Health database that, in France, the therapeutic classes clustering with ILI incidence were medically relevant but performed poorly for epidemic detection. Indeed, sales started rising up around September, well before seasonal influenza epidemics. However, time series of ILI drug sales in the USA have been shown to have an adjusted lead time of 3 to 8 days over ILI consultations,4 or no lead time.9
Conclusion
The presented clustering-based selection method allowed extracting relevant therapeutic classes for syndromic surveillance of gastroenteritis from an extensive database. Multiple univariate monitoring of the selected therapeutic classes, using a voting rule, allowed detecting epidemics with good sensitivity, specificity and timeliness.
REFERENCES
1. Goldenberg A, Shmueli G, Caruana RA, et al. Early statistical detection of anthrax outbreaks by tracking over-the-counter medication sales. Proc Natl Acad Sci U S A 2002; 99(8): 5237-40.
2. Hogan WR, Tsui FC, Ivanov O, et al. Detection of pediatric respiratory and diarrheal outbreaks from sales of over-the-counter electrolyte products. J Am Med Inform Assoc 2003; 10(6): 555-62.
3. Ohkusa Y, Shigematsu M, Taniguchi K, et al. Experimental surveillance using data on sales of over-the-counter medications--Japan, November 2003-April 2004. MMWR
4. Magruder SF, Lewis SH, Najmi A, et al. Progress in understanding and using over-the-counter pharmaceuticals for syndromic surveillance. MMWR Morb Mortal Wkly
Rep 2004; 53 Suppl: 117-22.
5. Najmi AH, Magruder SF. Estimation of hospital emergency room data using OTC pharmaceutical sales and least mean square filters. BMC Med Inform Decis Mak 2004;
4: 5.
6. Wagner MM, Robinson JM, Tsui FC, et al. Design of a national retail data monitor for public health surveillance. J Am Med Inform Assoc 2003; 10(5): 409-18.
7. Stirling R, Aramini J, Ellis A, et al. Waterborne cryptosporidiosis outbreak, North Battleford, Saskatchewan, Spring 2001. Can Commun Dis Rep 2001; 27(22): 185-92.
8. Vergu E, Grais RF, Sarter H, et al. Medication sales and syndromic surveillance, France. Emerg Infect Dis 2006; 12(3): 416-21.
9. Das D, Metzger K, Heffernan R, et al. Monitoring over-the-counter medication sales for early detection of disease outbreaks--New York City. MMWR Morb Mortal Wkly
Rep 2005; 54 Suppl: 41-6.
10. Li R, Wallstrom GL, Hogan WR. A multivariate procedure for identifying correlations between diagnoses and over-the-counter products from historical datasets. AMIA Annu
Symp Proc 2005; 2005: 450-4.
11. Conseil de l'Ordre des pharmaciens. Les Pharmaciens. Panorama au 1er janvier 2008 (in French). 2008.
12. EphMRA. Anatomical Classification. May 2009. http://www.ephmra.org (accessed 20 May 2009).
13. Valleron AJ, Bouvet E, Garnerin P, et al. A computer network for the surveillance of communicable diseases: the French experiment. Am J Public Health 1986; 76(11):
1289-92.
14. Everitt B. Cluster Analysis. Heinemann Educ. Books: London,1974.
15. Cowling BJ, Wong IO, Ho LM, et al. Methods for monitoring influenza surveillance data. Int J Epidemiol 2006; 35(5): 1314-21.
16. Hutwagner L, Browne T, Seeman GM, et al. Comparing aberration detection methods with simulated data. Emerg Infect Dis 2005; 11(2): 314-6.
18. Costagliola D, Flahault A, Galinec D, et al. A routine tool for detection and
assessment of epidemics of influenza-like syndromes in France. Am J Public Health 1991; 81(1): 97-9.
19. R Development Core Team. R: A language and environment for statistical computing. R Foundation for Statistical Computing, Vienna, Austria; 2008.
20. Edge VL, Pollari F, Ng LK, et al. Syndromic Surveillance of Norovirus using Over-the-counter Sales of Medications Related to Gastrointestinal Illness. Can J Infect Dis
Med Microbiol 2006; 17(4): 235-41.
21. Edge VL, Pollari F, Lim G, et al. Syndromic surveillance of gastrointestinal illness using pharmacy over-the-counter sales. A retrospective study of waterborne outbreaks in Saskatchewan and Ontario. Can J Public Health 2004; 95(6): 446-50.
22. Lau EH, Cowling BJ, Ho LM, et al. Optimizing use of multistream influenza sentinel surveillance data. Emerg Infect Dis 2008; 14(7): 1154-7.
FIGURES AND TABLES
Table 1. Evaluation of univariate monitoring of the selected therapeutic class sales. The sales of each therapeutic class were analyzed separately with a CUSUM statistic. Alerts were emitted when the CUSUM exceeded a detection threshold. Official epidemic dates released by the Sentinelles network were used to evaluate outbreak detection performances. Sensitivity and timeliness are given for the detection threshold that provides the specificity closest to 0.95. The area under the weighted receiver operating characteristic curve (AUWROC) is calculated across a range of thresholds. Timeliness of -1 means that the method emits an alert in average one week before epidemics are officially declared.
Class Name AUWROC Sensitivity Timeliness Detection threshold Specificity
A04A9 OTHER ANTIEMETICS AND
ANTINAUSEANTS 0.985 1 -1.625 1.2 0.948
A07H MOTILITY INHIBITORS 0.956 1 -1.125 1.6 0.953
A07X ALL OTHER
ANTIDIARRHOEALS 0.952 1 -0.5 8.9 0.948
A07B INTESTINAL ADSORBENT
ANTIDIARRHOEALS 0.915 0.875 -0.429 5.4 0.953
Table 2. Evaluation of multiple voter monitoring of therapeutic class sales.
Each therapeutic class was analyzed separately with a CUSUM statistic set with the parameters that lead to the best detection performances. For each class, the selected detection threshold was the one giving the specificity closest to 95%. A multiple voter algorithm was then used to combine the information from all the CUSUMs. Four rules were used: alerts were emitted when at least 1, 2, 3 or 4 CUSUM statistics simultaneously exceeded their thresholds. Sensitivity, specificity and timeliness are presented for each rule.
Rule Sensitivity Specificity Timeliness
At least 1 CUSUM exceeds its threshold 1 0.760 -2.000
At least 2 CUSUMs exceed their thresholds 1 0.906 -1.875
At least 3 CUSUMs exceed their thresholds 1 0.953 -1.750
Figure 1. (a) Time series of therapeutic class sales and acute diarrhoea rate of incidence, from week 36 of year 2000 to week 16 of year 2009. Each row in the image shows the colour-coded sales level of one therapeutic class. One of the rows corresponds to the time series of incidence. Low values are in blue, large ones in red and missing ones in white. Each time series was normalized in the range [0;1]. The vertical ordering of the time series is the result of hierarchical clustering according to similarity in temporal profiles. Clusters are further highlighted on the right side with a name chosen to reflect the mean behaviour in the cluster and the number of series. (b) An average temporal profile is shown below for each cluster.
Figure 2. Subset of the hierarchical tree focused on acute diarrhoea rate of incidence. The dashed-line (respectively the dotted-line) rectangle outlines the cluster containing acute diarrhoea rate of incidence, obtained when cutting the tree at height 0.3 (respectively 0.5). It can be seen that, for cutting height 0.3, two therapeutic classes (A04A9 and A07H) belong to the same cluster as acute diarrhoea rate of incidence, while they are four when cutting height is 0.5 (A04A9, A07H, A07X and A07B).
Figure 3. In black: time series of therapeutic class sales (in number of boxes for 100,000 inhabitants). In grey: acute diarrhoea rate of incidence (in number of cases for 100,000 inhabitants). The method for selecting therapeutic classes consisted in ordering with a hierarchical tree the database formed by the time series of therapeutic class sales and acute diarrhoea rate of incidence. The tree was cut to form distinct clusters of time series. When the tree was cut at height 0.5, four therapeutic classes were in the same cluster than acute diarrhoea (panel a). When the tree was cut at height 0.6, twelve more therapeutic classes were in the same cluster than acute diarrhoea (panel b).
Figure 4. Black rectangles: alerts emitted each week the CUSUM statistic exceeds its detection threshold, for a fixed specificity of 95%, for each selected therapeutic class. The CUSUM of each class is set with the parameters that leaded to the best performances (highest AUWROC). Black curve: acute diarrhoea rate of incidence. Official epidemic periods, as defined by the Sentinelles network using a periodic regression model on acute diarrhoea incidence data, are hatched in grey. Summer periods are left blank, as they are excluded from the evaluation.
Figure 5. Mean AUWROC (Area Under the Weighted Receiver Operating Characteristic curve) of the therapeutic classes selected for different cutting heights. An AUWROC close to 1 indicates that the method detects epidemics with good sensitivity, specificity and timeliness, whereas an AUWROC close to 0 indicates a low performance in one of these 3 characteristics.
Appendix
DETERMINATION OF THE BEST PARAMETER COMBINATIONS FOR THE CUSUM ALGORITHM
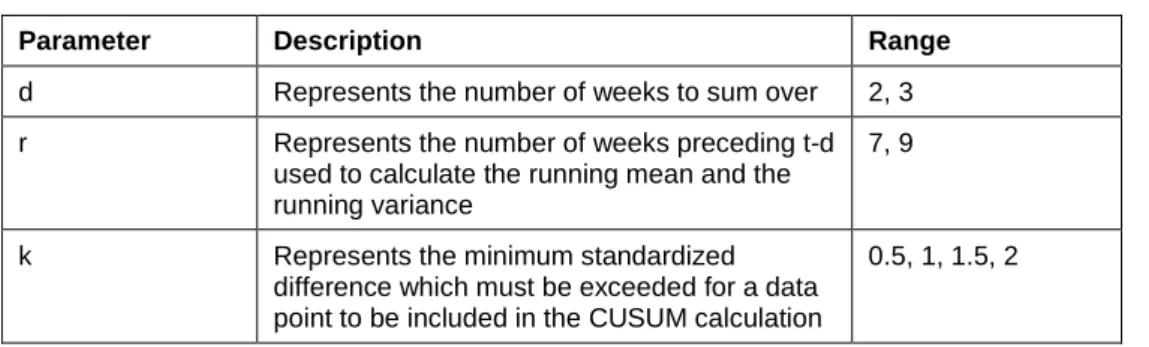
The CUSUM was applied using 16 different parameter combinations (Table A.1). For each parameter combination, the detection threshold was varied between 0 and 15 by 0.1 step to provide a broad coverage in terms of sensitivity and specificity. For each therapeutic class, the combination that gave the best Area Under the Weighted Receiver Operating Characteristic curve (AUWROC) was selected and is presented in Table A.2.
Table A.1. Parameter combinations tested for the CUSUM method.
Parameter Description Range
d Represents the number of weeks to sum over 2, 3
r Represents the number of weeks preceding t-d
used to calculate the running mean and the running variance
7, 9
k Represents the minimum standardized
difference which must be exceeded for a data point to be included in the CUSUM calculation
0.5, 1, 1.5, 2
Table A.2. Parameter combination giving the best AUWROC (Area Under the Weighted Receiver Operating Characteristic curve) for each selected therapeutic class
Class Name d r k AUWROC
A04A9 OTHER ANTIEMETICS AND ANTINAUSEANTS 2 9 0.5 0.985
A07H MOTILITY INHIBITORS 2 7 0.5 0.956
A07X ALL OTHER ANTIDIARRHOEALS 3 9 0.5 0.952
A07B INTESTINAL ADSORBENT ANTIDIARRHOEALS 3 9 0.5 0.915
AREA UNDER THE WEIGHTED RECEIVER OPERATING CHARACTERISTIC CURVE (AUWROC)
This curve represents the sensitivity weighted by a function of the timeliness, called the Timed Saved (TS), in y-axis against 1-specificity in x-axis, for different detection thresholds. An area below the curve close to 1 indicates good sensitivity, specificity and timeliness, while an area close to 0 indicates a low performance for at least one of these 3 features.
The TS was calculated as 1 minus the ratio of the detection delay to a predefined maximal delay.22 The detection delay was the time between the true epidemic onset, supposed to be 2
weeks before the official alert emitted by the Sentinelles network, and the first true alert. It is a positive quantity.
When the detection delay was greater than the maximal delay, TS was set to 0. If there was no detection, TS was also set to 0. TS lied between 0 and 1. The maximal delay was set to 4 weeks, as it did not seem acceptable to detect an AD epidemic more than 4 weeks after its onset. The weighted ROC curve was constructed by plotting sensitivity × TS against the false positive rate (1-specificity).
(a) 2001 2002 2003 2004 2005 2006 2007 2008 Time series profile Decreasing 1 (n=56) Decreasing 2 (n=71) Seasonal 1 (n=11) Seasonal 2 (n=27) Stable 2 (n=14) Seasonal 3 (n=6) Decreasing 3 (n=65) Seasonal 4 (n=6) Stable 3 (n=25) Increasing (n=80) Seasonal 5 (n=24) Low values High values
(b) Average time series by profile group
0 1 Decreasing 1 0 1 Decreasing 2 0 1 Seasonal 1 0 1 Seasonal 2 0 1 Stable 2 0 1 Seasonal 3 0 1 Decreasing 3 0 1 Seasonal 4 0 1 Stable 3 0 1 Increasing 0 1 Seasonal 5 2001 2002 2003 2004 2005 2006 2007 2008
0.5 0.4 0.3 0.2 0.1 0.0
A07B INTESTINAL ADSORBENT ANTIDIARRHOEALS A07X ALL OTHER ANTIDIARRHOEALS
Acute diarrhea rate of incidence
A04A9 OTHER ANTIEMETICS AND ANTINAUSEANTS A07H MOTILITY INHIBITORS
D06D1 TOPICAL ANTIVIRALS
R03X2 ALL OTHER ANTI−ASTHMA AND COPD PRODUCTS, SYSTEMIC R02A THROAT PREPARATION
A11G1 PLAIN VITAMIN C (INCLUDING VITAMIN C SALTS) R01B SYSTEMIC NASAL PREPARATIONS
R04A CHEST RUBS AND OTHER INHALANTS
R05A COLD PREPARATIONS WITHOUT ANTI−INFECTIVES R01A9 OTHER TOPICAL NASAL PREPARATIONS
H02A2 ORAL CORTICOSTEROIDS, PLAIN R05D1 PLAIN ANTITUSSIVES
R01A1 NASAL CORTICOSTEROIDS WITHOUT ANTI−INFECTIVES R01A7 NASAL DECONGESTANTS
(a) 0 2000 4000 6000 8000 10000 12000 2001 2003 2005 2007 0 200 400 600 800 Sales Rate of incidence
1) A04A9 OTHER ANTIEMETICS AND ANTINAUSEANTS
0 5000 10000 15000 20000 2001 2003 2005 2007 0 200 400 600 800
2) A07H MOTILITY INHIBITORS
0 2000 4000 6000 8000 2001 2003 2005 2007 0 200 400 600 800
3) A07X ALL OTHER ANTIDIARRHOEALS
0 5000 10000 15000 20000 2001 2003 2005 2007 0 200 400 600 800
4) A07B INTESTINAL ADSORBENT ANTIDIARRHOEALS
(b) 0 2000 4000 6000 8000 10000 12000 2001 2003 2005 2007 0 200 400 600 800
5) R04A CHEST RUBS AND OTHER INHALANTS
0 10000 20000 30000 40000 50000 2001 2003 2005 2007 0 200 400 600 800
6) R05A COLD PREPARATIONS WITHOUT ANTI−INFECTIVES
0 5000 10000 15000 20000 2001 2003 2005 2007 0 200 400 600 800
7) R01B SYSTEMIC NASAL PREPARATIONS
0 10000 20000 30000 40000 2001 2003 2005 2007 0 200 400 600 800
8) R01A7 NASAL DECONGESTANTS
0 2000 4000 6000 8000 2001 2003 2005 2007 0 200 400 600 800
9) A11G1 PLAIN VITAMIN C (INCLUDING VITAMIN C SALTS)
0 5000 10000 15000 20000 25000 30000 35000 2001 2003 2005 2007 0 200 400 600 800
10) H02A2 ORAL CORTICOSTEROIDS, PLAIN
0 20000 40000 60000 80000 2001 2003 2005 2007 0 200 400 600 800 11) R05D1 PLAIN ANTITUSSIVES 0e+00 2e+04 4e+04 6e+04 8e+04 1e+05 2001 2003 2005 2007 0 200 400 600 800
12) R02A THROAT PREPARATION
0 5000 10000 15000 20000 25000 2001 2003 2005 2007 0 200 400 600 800
13) R01A9 OTHER TOPICAL NASAL PREPARATIONS
0 10000 20000 30000 40000 2001 2003 2005 2007 0 200 400 600 800
14) R01A1 NASAL CORTICOSTEROIDS WITHOUT ANTI−INFECTIVES
3000 4000 5000 400 600 800 15) D06D1 TOPICAL ANTIVIRALS 15000 20000 600 800
OTHER ANTIEMETICS AND ANTINAUSEANTS (A04A9) MOTILITY INHIBITORS (A07H) ALL OTHER ANTIDIARRHOEALS (A07X) INTESTINAL ADSORBENT ANTIDIARRHOEALS (A07B) 2001 2002 2003 2004 2005 2006 2007 2008
0.3 0.5 0.7 0.9 0.65 0.70 0.75 0.80 0.85 0.90 0.95 Cutting height Mean A UWR