Publisher’s version / Version de l'éditeur:
Vous avez des questions? Nous pouvons vous aider. Pour communiquer directement avec un auteur, consultez la
première page de la revue dans laquelle son article a été publié afin de trouver ses coordonnées. Si vous n’arrivez pas à les repérer, communiquez avec nous à [email protected].
Questions? Contact the NRC Publications Archive team at
[email protected]. If you wish to email the authors directly, please see the first page of the publication for their contact information.
https://publications-cnrc.canada.ca/fra/droits
L’accès à ce site Web et l’utilisation de son contenu sont assujettis aux conditions présentées dans le site LISEZ CES CONDITIONS ATTENTIVEMENT AVANT D’UTILISER CE SITE WEB.
The Journal of Ocean Technology, 14, Special Edition, pp. 2-20, 2019-10-01
READ THESE TERMS AND CONDITIONS CAREFULLY BEFORE USING THIS WEBSITE. https://nrc-publications.canada.ca/eng/copyright
NRC Publications Archive Record / Notice des Archives des publications du CNRC :
https://nrc-publications.canada.ca/eng/view/object/?id=44392714-0c44-40d5-a684-a44dd2727bdf https://publications-cnrc.canada.ca/fra/voir/objet/?id=44392714-0c44-40d5-a684-a44dd2727bdf
NRC Publications Archive
Archives des publications du CNRC
This publication could be one of several versions: author’s original, accepted manuscript or the publisher’s version. / La version de cette publication peut être l’une des suivantes : la version prépublication de l’auteur, la version acceptée du manuscrit ou la version de l’éditeur.
Access and use of this website and the material on it are subject to the Terms and Conditions set forth at
Experimental study of the wake produced by single and multiple
cross-flow turbines
Provan, Mitchel; Cornett, Andrew; Knox, Paul; Cousineau, Julien; Ferguson,
Sean
Provan, Cornett, Knox, Cousineau, and Ferguson
provide an initial investigation of the interactions
between multiple cross-flow turbines places in
an array.
Studying Wakes
Who should read this paper?
This paper should be read by renewable energy developers and researchers looking to gain more insight to the interactions between cross-flow turbines in arrays and to gain an understanding on the technological progress of hydrokinetic/tidal turbines.
Why is it important?
Optimized array guidelines are still in their beginning stages; there exists a knowledge gap in how the wakes of turbines interact with each other. This knowledge is required in order to produce guidelines for renewable energy developers to optimize the placement of turbines. The eventual goal of this work is to use the results from this study to improve numerical models which can then be used to help optimize the layout of these turbines to optimize power extraction in specific project locations.
About the authors
Mitchel Provan is a research engineer with the Ocean, Coastal and River
Engineering Research Centre of the National Research Council of Canada (NRC-OCRE). His research interests include applying physical modelling to study and help optimize the design of coastal infrastructure, riverine infrastructure, and renewable energy devices. Dr. Andrew Cornett is a research program leader with NRC-OCRE, and is also an adjunct professor in the Department of Civil Engineering of the University of Ottawa. He is a specialist in the application of physical hydraulic modelling, numerical simulation, and engineering analysis to investigate and develop innovative solutions to a wide variety of problems in rivers, estuaries, oceans, and coastal regions. His research interests include coastal engineering and marine renewable energy technologies. Paul Knox is a senior coastal engineer and team lead of the Coastal Engineering Team at NRC-OCRE. He has experience in civil engineering hydraulics and physical modelling of coastal processes, coastal structures, moored ship response, port developments, and marine renewable energy devices.
Julien Cousineau is a research engineer with NRC-OCRE. He applies
numerical modelling to provide innovative solutions to a wide range of problems in rivers, oceans and coastal regions. His research interests include flood mitigation, optimization of dam operations, and
improvement in the development of marine renewable energy resources.
Sean Ferguson is a researcher with NRC-OCRE. With a background in
fluvial geomorphology and open channel hydraulics, he supports a variety of research related to river engineering, coastal engineering, water resources, and marine renewable energy.
Mitchel Provan
Andrew Cornett
Paul Knox
EXPERIMENTAL STUDY OF THE WAKE PRODUCED BY SINGLE AND
MULTIPLE CROSS-FLOW TURBINES
Mitchel Provan, Andrew Cornett, Paul Knox, Julien Cousineau, and Sean Ferguson
National Research Council of Canada, Ottawa, ON, Canada ABSTRACT
Hydrokinetic turbines, which convert the kinetic energy of flowing water into electrical energy, are increasingly being deployed in arrays, much like multiple wind turbines are commonly organized into a wind farm. Deploying multiple devices in an array can increase the amount of energy produced from a site and tends to make project economics more favourable. Despite growing interest in hydrokinetic turbine arrays, relatively few researchers have studied arrays and limited information exists concerning the character of the turbulent flows within arrays and methods for optimizing array layout, particularly for cross-flow turbines. This paper presents results from a set of experiments conducted in a current flume in which the wakes produced by a single cross-flow turbine and pairs of identical cross-flow turbines were measured in detail. Two different ambient turbulence intensities were studied so that the effect of turbulence level on wake recovery could be quantified. The velocity data has been analyzed to identify the mean velocity and the turbulence intensity in the turbine wake(s). These experiments form one component of a larger study that aims to develop numerical methods and guidelines to help project developers optimize the design of turbine arrays.
KEYWORDS
INTRODUCTION
Hydrokinetic energy has the potential to become a viable long-term source of renewable energy, provided that the cost of producing energy can be lowered to competitive levels. Despite considerable efforts and advances in recent years,
substantial research and development in many areas is still required to achieve this objective. Following in the footsteps of the wind turbine industry, deploying multiple hydrokinetic turbines in an array is likely required for hydrokinetic project developers to achieve a good business return. However, available information regarding turbine arrays is limited and there is a need to further learn about the interactions between adjacent turbines, the performance of individual turbines deployed in arrays, and the impact of turbine arrays on the flow and surrounding environment. This knowledge will make it possible to optimize turbine array layouts with respect to power generation or cost of energy or environmental footprint by adjusting the turbine
configuration, turbine spacing, and the number and types of turbines deployed.
Previous research conducted on theoretical aspects of power extraction from fluid flow dates back to the work proposed by Betz [1920] on wind power and rotorcraft
applications in the early 20th century using the
conservation of mass and momentum. More recently, theoretical one-dimensional power extraction analyses for use in tidal power applications have been developed by Garrett and Cummins [2007], Houlsby et al. [2008], and Whelan et al. [2009]. Scaled experimental model studies have been conducted to help
investigate the wakes produced by a single turbine and multiple turbines placed into an array configuration. Previous studies have used porous plates or discs to represent a simplified turbine or array of turbines without the complexities of a scaled rotating turbine. Myers and Bahaj [2010; 2012] and Myers et al. [2011] studied the wakes produced by porous discs that were used to represent axial flow turbines, shedding light on various characteristics of the velocity deficits created by these plates for different in-line and in-plane turbine spacings. Coles et al. [2016] applied a similar approach in a study where large turbine arrays were simulated using porous fences; drag forces and velocity distributions were measured downstream of the porous fences. Previous studies have also employed scaled model turbines to
characterize the wake generated by turbine arrays [Stallard et al., 2013; Mycek et al., 2013; 2014]. However, the majority of these studies focus on axial-flow turbines. A study completed by Ordonez-Sanchez et al. [2017] investigated the wake characteristics of cross-flow turbine arrays where a number of scaled momentum-reversal-and-lift turbines were introduced into the flow in three different array layouts. Bachant and Wosnik [2015] measured the downstream wake of a vertical axis, cross-flow type turbine at a relatively large (1:6) scale; this study focused on characterizing the near-field wake and, therefore, velocity measurements were recorded at 1 turbine diameter downstream of the turbine only. Despite the previous research regarding turbine-induced wake and wake
characterization, there currently exists a knowledge gap in the characterization of the
far-field downstream wake produced by vertical axis cross-flow turbines, an
understanding of which is required in order to devise effective and efficient array layout configurations. The ultimate objective of the research presented herein is to develop a set of guidelines that developers can use to facilitate hydrokinetic turbine array design in riverine environments. The first step in this study involved collecting high quality experimental data (velocity and turbulence intensity) concerning the wake produced by vertical-axis cross-flow hydrokinetic turbines; it is intended that this information be used to calibrate and validate a computational fluid dynamics (CFD) model in a subsequent, complementary project. The CFD model will be used to study turbine-turbine interactions. Research findings from the CFD model will be implemented into a
hydrodynamic model to study the turbine array-riverine interactions. The authors have
previously completed a series of tests
measuring the downstream wake using simple porous plates to represent cross-flow turbines [Knox et al., 2018; Provan et al., 2018]. This paper summarizes subsequent testing and analysis focused on characterizing the downstream wake(s) produced by single and pairs of rotating small-scale cross-flow turbines.
PHYSICAL MODEL
Model Setup
The experiments were conducted in a large wave-current flume (WCF) at the Ocean, Coastal and River Engineering Research Centre of the National Research Council of Canada. The WCF is 97 m long, 2 m wide, and up to 2.75 m deep. The facility is equipped with a
current generation system that can provide a maximum of 1.1 m3/s of flow through the
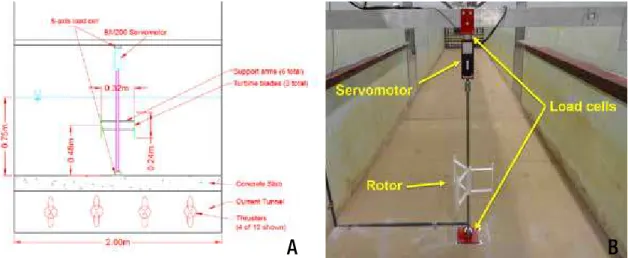
testing section. Water level in the flume can be controlled and adjusted to a desired depth. For this study, the water level in the flume was maintained at a depth of 0.75 m and the undisturbed flow speed in the streamwise direction (U0) was set to 0.68 m/s. A set of flow straighteners was installed upstream of the test section to diminish vorticity in the flow caused by the current generation system, and to provide a uniform uni-directional flow through the testing section. An overall view of the flume is pictured in Figure 1.
Model Turbine
Testing was conducted using small scale vertical-axis cross-flow hydrokinetic turbines (i.e., the turbine shaft is perpendicular to the water surface). A sketch of a single model turbine positioned in the WCF is shown in Figure 2a while Figure 2b shows a picture of the turbine installed in the WCF. The turbine rotor consists of three airfoil blades with a NACA 63-021 profile. Each blade is connected
Figure 1: Overview of the wave-current flume.
to a vertical collar by two support struts which have a NACA-12 airfoil shape (six struts in total). The three blades and six struts all have a 0.023 m chord length, while the length (i.e., height) of each blade is 0.24 m. The overall diameter of the turbine is 0.32 m and produces a blockage ratio of 0.051. The entire turbine rotor, including blades, struts and collar, was 3D printed using a nylon powder to provide a lightweight and waterproof material that could easily be shaped to produce the required airfoil forms with high precision. All surfaces were sanded smooth to provide a low surface roughness of the blades and supporting struts. The rotor was mounted onto a 0.019 m diameter stainless steel shaft at an elevation that sets the centre of the turbine at 0.48 m (1.5D, where D=0.32m, the turbine rotor diameter) above the flume floor. The bottom of the stainless steel shaft was mounted in an acetal marine bearing and the top of the shaft was attached to a servomotor. The bearing at the bottom of the shaft and the motor at the top of the shaft were connected to independent 6-axis load cells. Detailed information on the servomotor and load cells used in this study are provided below.
Instrumentation
The primary goal of the experiments was to measure and characterize the turbine wake downstream of different turbine configurations. Six different instruments were used to measure velocities within the model; a single 2-axis electromagnetic current meter (ECM) manufactured by Valeport and five 3-axis acoustic Doppler velocimeters (ADV)
manufactured by Nortek. The ECM probe was mounted approximately 25D upstream of the turbine and was used as a reference velocity measurement throughout the entire testing program. The five ADV probes were mounted to an instrumentation rack that could be moved in all three dimensions (vertically, cross-flume, and along-flume) at 0.1 m steps. Thin guy-wires were used to provide additional stability to the ADV probes and reduce vibration of the measurement sensors during testing. At each measurement point, velocity data was sampled for a duration of 180 s at a sampling rate of 25 Hz. This produced 4,500 individual
measurements or “pings” for each sampling location. The ADV probes typically had a correlation percentage upwards of 90% and a signal to noise ratio of approximately 15 dB.
Figure 2: a) Sketch of the cross-flow turbine installed in the wave-current flume (WCF) and b) photo showing the turbine and its instrumentation in the WCF.
The velocity measurements were despiked to remove any outliers from the recorded data prior to conducting further analysis. The velocity measurements were used to calculate two time-averaged, non-dimensional numbers that can be used to characterize the downstream wake; the velocity ratio (Uratio) and the turbulence intensity (I ). The velocity ratio parameter relates the time-averaged wake velocity (Uw) at a certain location downstream of the turbine to the time-averaged free-stream velocity (U0). Since the flow is primarily uni-directional in the streamwise direction (along the x-axis), the velocity ratio can be calculated as:
(1)
The turbulence intensity value corresponds to the time-averaged fluctuation in the flow velocity caused by turbulence represented as a percentage of the mean velocity. Turbulence intensity can be calculated for all three directions (x, y, and z). However, since the flow is primarily uni-directional along the streamwise direction (x-direction), the turbulence intensity reported herein is the turbulence intensity in the streamwise direction:
(2)
where σx is the standard deviation of the streamwise velocity measurement and ux is the time-averaged mean streamwise velocity. The drag force acting on the turbine was measured using two Mini45 IP65/IP68 load cells manufactured by ATI Industrial Automation. As shown in Figure 2, one load
cell was installed above the servomotor at the top of the turbine shaft and another load cell was attached on the underside of the bearing at the bottom of the shaft. The combined force measured by each load cell provided the total drag force acting on the turbine rotor and the turbine shaft. In order to isolate the
hydrodynamic forces acting on the rotor, the rotor was removed and the drag force was measured on only the shaft. The force measurement of the shaft was then subtracted from the force measurement of the combined rotor and shaft. Multiple force readings were recorded for a duration of 180 s and these readings were averaged to obtain the average force exerted on the turbine rotor by the flow in the streamwise direction. The force
measurements were used to calculate the drag coefficient, Cd, of the turbine using:
(3)
where Fd is the drag force acting on the rotor, ρ is the fluid density (assumed to be 998 kg/ m3) and At is the area of the turbine rotor. The
drag coefficient of the turbine rotor was calculated to be 0.67.
The top of the turbine shaft was connected to an Aerotech BM200 brushless rotatory servomotor. The servomotor was used to drive and/or brake the model turbine to match the desired RPM for the wake measurements. The motor is able to output both the RPM of the spinning shaft as well as the torque applied to the shaft. The servomotor was controlled using Aerotech’s Ensemble Digital Scope software where the “MCOMM” command was utilized to supply the motor with a constant current. The applied current was then transformed to a
torque value using the torque constant of the motor (0.14 Nm/A). The motor is also equipped with a 4000 count encoder that provides the rotational measurement of the shaft in rotations per second. The rotational speed of the turbine was maintained at 1.69 rotations/second (101.5 rotations/minute). The tip speed ratio (TSR), the ratio between the tip velocity of the turbine and the upstream flow velocity, can then be calculated as follows:
(4)
where λ is the tip speed ratio, ω is the angular velocity of the turbine blade, and r is the turbine radius. The TSR of the model turbine was maintained at 2.5 throughout the testing program, which can be considered a typical operating TSR for cross-flow turbines of this type [Mavi Innovations et al., 2016]. Based on the chosen rotational speed of the turbine, the average blade chord Reynolds number can be calculated as:
(5) where c is the blade chord length and ν is the kinematic viscosity of water (assumed to be 1.004x10⁻⁶ m2/s for 20°C water). Using the
calculated TSR and the model turbine chord length of 0.023 m, the average blade chord Reynolds number is 3.89x10⁴. The resulting
chord Reynolds number is smaller compared to turbines that would be deployed for real world projects. The small chord Reynolds number can be attributed to the small size of the model turbine and the lower flow speeds that were created in the flume. Therefore, the wake recovery of the model turbines may differ from the wake recovery of full scale
turbines. This is an aspect of the study that will investigated in the future using a combination of CFD models and full scale field measurements.
MODEL RESULTS AND DISCUSSION
Testing Program
As previously stated, the goal of the research study was to collect experimental data of the wake characteristics of vertical axis cross-flow hydrokinetic turbines to gain a better
understanding of the wake behaviour and to help calibrate and validate a CFD model. The experimental portion of this research study has been categorized in four main groups: Group A – ambient flow conditions, Group B –
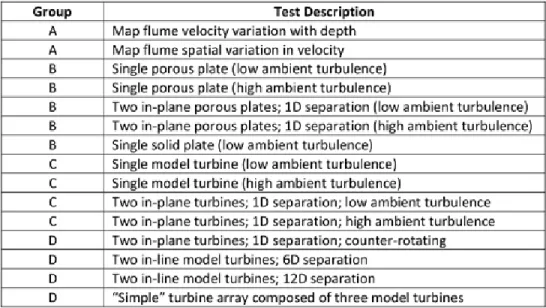
characterizing the wake downstream of porous plates, Group C – characterizing the wake downstream of a single cross-flow turbine and a pair of cross-flow turbines arranged in-plane across the flow, and Group D – characterizing the wake downstream of a pair of cross-flow turbines arranged in-line with the flow and a “simple” turbine array. A summary of the overall experimental testing program is provided in Table 1. The focus of this paper will be on the Group A and Group C tests. Results from the Group B tests can be found in Knox et al. [2018] and Provan et al. [2018]. All tests followed a similar testing procedure. At the z=1.5D elevation (rotor mid-height), the flow velocity was measured along 13 cross-sections or stations downstream of the turbine(s), ranging from x=2D to x=20D (see Figure 3a). Fifteen individual measurements were taken along each station at a 0.33D spacing ranging from y=-2.33D to y=+2.33D. Additional velocity measurements were taken
at a coarser resolution above and below the turbine mid-height at the z=0.8D and z=2.2D elevations, with nine stations ranging from x=2D to x=10D. At these elevations, five measurements were taken along each cross-section with a 0.66D spacing ranging from y=-1.33D to y=+1.33D (shown in Figure 3b). This resulted in a total of 325 individual wake velocity measurement locations for each test setup.
Ambient Flow Characteristics
The first step of the testing program was to measure the free-stream (i.e., no turbine in the flume) flow velocities at 80 individual points throughout the testing section in order to gain an understanding of the natural flow
characteristics of the flume. The measured results showed a maximum of 5% variance in the flow speed measurements throughout the testing section with an overall average free-stream velocity of U0=0.68 m/s. In addition,
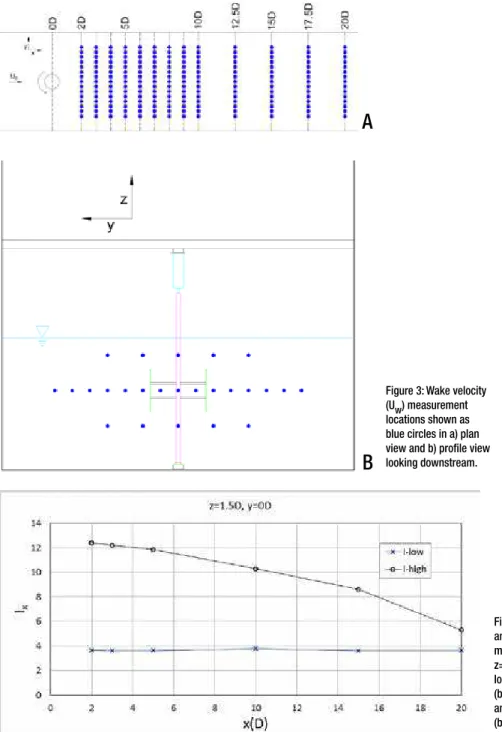
measurements indicate that the flume’s “natural” ambient turbulence intensity, I, was approximately 4%. These values, recorded
Table 1: Full testing program of the experimental study.
with a mechanical flow straightener installed upstream, represent an ambient free-stream flow condition with a relatively low-level of ambient turbulence.
To create a flow condition with greater ambient turbulence, a series of vertical pipes were introduced into the flow 7D upstream of the turbine location in order to uniformly increase turbulence at the testing section. This increased the ambient free-stream turbulence intensity to approximately 12% at x=2D; however, it decreased to approximately 5.5% by x=20D (see Figure 4). Therefore, the rate of wake recovery for tests conducted at higher ambient turbulence levels can be expected to decrease with downstream distance. This may result in a longer wake region than would occur if the ambient turbulence intensity remained steady at 12% throughout the entire testing section.
Single Turbine – High Ambient Turbulence
A single turbine was installed at the centre of the flume (x=0D, y=0D) and the set of vertical
Figure 3: Wake velocity (Uw) measurement locations shown as blue circles in a) plan view and b) profile view looking downstream.
Figure 4: Longitudinal ambient turbulence measurements at z=1.5D and y=0D for low ambient turbulence (blue x’s) and high ambient turbulence (black circles).
A
B
pipes described in “Ambient Flow Characteristics” (above) was placed in the flume to investigate the wake generated by a single turbine operating in a flow with high ambient turbulence. Velocity measurements were taken at 325 individual locations
downstream of the turbine (specific locations described in “Testing Program” above). The measured velocity ratio, Uw,x/U0, and
turbulence intensity, Ix, along the centreline of
the flume (y=0D) are plotted in Figure 5 for the three elevations z=0.8D (below rotor),
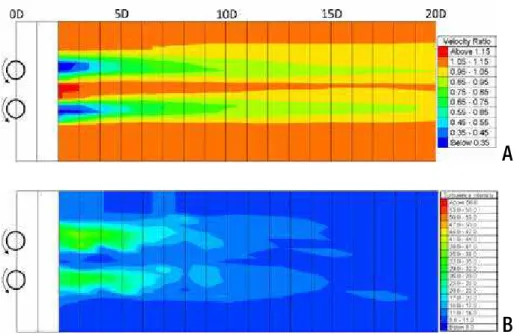
z=1.5D (mid-rotor), and z=2.2D (above rotor). Contour plots developed from the
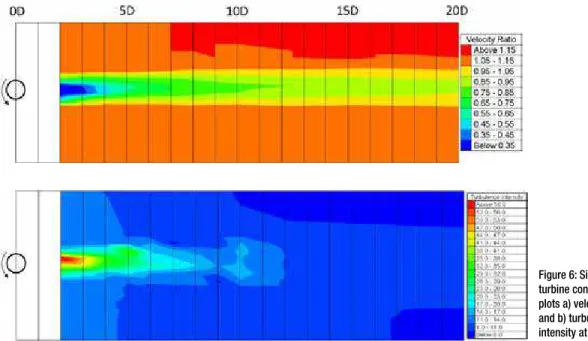
interpolation of the velocity ratio and turbulence intensity measurements are provided in Figure 6. At z=1.5D, the mean streamwise velocity immediately downstream of the turbine is reduced to 20% of the free-stream velocity and recovers to 60% of the free-stream velocity at approximately 4.5D downstream. The rate of wake recovery appears to reduce downstream of 5-6D with the streamwise velocity eventually recovering to 90% of the free-stream velocity by 14D. By the time the wake reaches the downstream limit of the testing section (x=20D), the wake recovers to 95% of the free-stream velocity. A similar trend can be seen in the turbulence intensity measurements at z=1.5D (mid-rotor)
where the turbulence intensity is highest (~45%) immediately downstream of the turbine and quickly reduces to 20% by x=7D. Between 7D and 20D the recovery is more gradual with the turbulence intensity eventually decreasing to ~10% at x=20D. The wake above (z=2.2D) and below (z=0.8D) the turbine rotor both appear to follow a similar trend, but with differing magnitude. At these elevations, the velocity ratios decrease as the turbine wake expands in the z- and
y-directions, reaching a minimum near x=6D. Further downstream the velocity ratio
increases as the wake begins to dissipate. The velocity ratios below the rotor (z=0.8D) are consistently smaller than above the rotor (z=2.2D). Figure 5b shows that the turbulence
Figure 5: Longitudinal variation of a) velocity ratio and b) turbulence intensity at y=0D (centreline of the turbine) for z=0.8D, z=1.5D and z=2.2D.
A
intensity of the wake is asymmetric in the vertical plane, and is significantly greater below the rotor (z=0.8D) than above the rotor (z=2.2D). Moreover, the elevated turbulence below the rotor tends to remain strong and persist over the region between x=2D and x=10D. In fact, beyond x=5D, the turbulence intensity below the rotor (z=0.8D) is greater than at mid-rotor elevation (z=1.5D).
Influence of Low Ambient Turbulence on Single Turbine
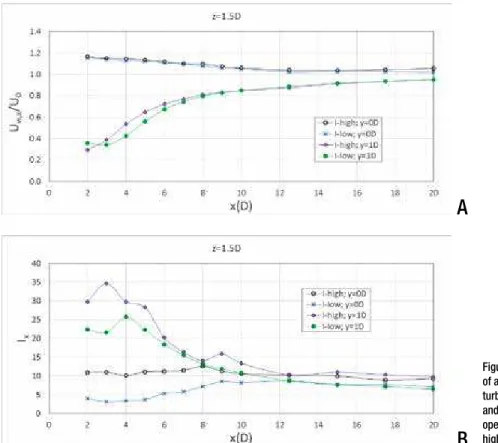
Following the experiment with a single turbine operating in a flow with high (12%) ambient turbulence, testing was conducted with the same setup for a flow with low (4%) ambient turbulence. Velocity measurements were taken at identical locations and analyzed in the same manner as before. The results from these two experiments along the rotor centreline at mid-rotor elevation are compared in Figure 7. These results demonstrate the influence of ambient turbulence level on wake character and recovery. The mean streamwise
velocity recovers slightly more rapidly when the ambient turbulence level is higher;
however, the level of turbulence in the wake is also greater when the ambient turbulence is greater, as expected. By x=5D, the streamwise velocity in the wake has recovered to 58% of the free-stream velocity for the low ambient turbulence case, compared to 66% velocity recovery at the same downstream location for the high ambient turbulence case. The rate of velocity recovery appears to be similar between the two cases downstream of x=8D, which can be attributed to the more similar ambient turbulence intensities in that portion of the flume. For low ambient turbulence, the streamwise velocity recovers to 90% of the upstream value at approximately x=19D, compared to x=14D for the high ambient turbulence case.
The turbulence intensities along the wake centreline for the two flows conditions (low and high ambient turbulence) are compared in Figure 7b. The wake is more turbulent when
Figure 6: Single turbine contour plots a) velocity ratio and b) turbulence intensity at z=1.5D.
the ambient flow is more turbulent, particularly in the region immediately
downstream from the rotor (x<5D). However, the turbulence intensities along the wake centreline converge and reach similar levels further downstream, for x>12D.
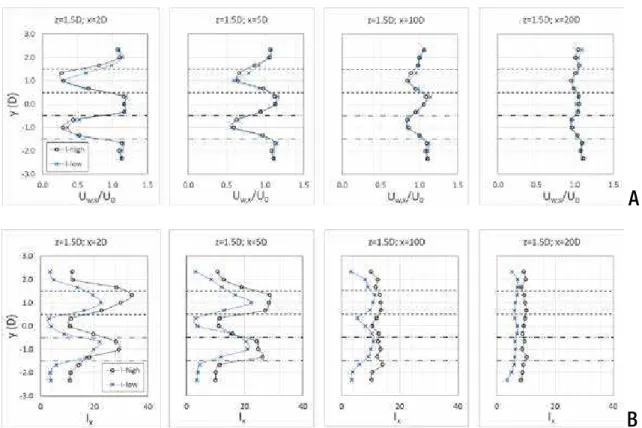
The plots in Figure 8 show the lateral variation (along the y-axis) of velocity ratio and
turbulence intensity for both low ambient turbulence and high ambient turbulence flow conditions at z=1.5D (rotor mid-height) for various stations (x-locations) downstream of the turbine. In Figure 8, the rotor blades are moving upstream near the upper dashed horizontal line and moving downstream near the lower dashed horizontal line. The measured data reveals that the wakes are both slightly asymmetric in the horizontal plane, with the velocity ratio being lower, and the turbulence
intensity being higher toward the up-blade side of the turbine (upper dash line in Figure 8). This suggests that turbine blades moving upstream against the incident flow create a larger velocity deficit and higher turbulence compared to the opposite side where the blades are moving downstream with the incident flow. The data reveals that between the edges of the turbine rotor and the flume walls, the
downstream streamwise velocity is higher than the free-stream velocity measured upstream (Uw,x/U0>1.0). This is consistent with the
reality that the turbine obstructs the flow at the centre of the flume causing flow to accelerate around each side of the turbine. The wake mixes and merges with this higher velocity flow as the wake progresses downstream, which can be seen beginning near x=5D. By the time the wake reaches x=20D, the velocity
A
B
Figure 7: Longitudinal variation of a) velocity ratio and b) turbulence intensity at z=1.5D and y=0D for low ambient turbulence (blue x’s) and high ambient turbulence (black circles).
deficit in the shadow of the turbine has become small and weak and the turbulence intensity has become virtually uniform across the flume for both the low ambient turbulence and high ambient turbulence flow conditions. Results from these experiments with a single small-scale cross-flow turbine suggest that if a downstream turbine was to be placed within the wake shadow of an upstream turbine, it should ideally be placed further than 15D downstream in order to provide enough separation for the flow to recover to near-free-stream conditions (~90% velocity recovery).
Two Turbines – High Ambient Turbulence
The first turbine was relocated to a position off the flume centreline (y=-1D) and a second identical small-scale cross-flow turbine was installed in the flume at x=0D, y=1D such that
there was a 2D separation (measured from shaft centre to shaft centre) between the two turbines resulting in a 1D gap between the edges of the turbine rotors. The two turbines were positioned side by side at the same elevation with a 1D gap between the swept areas and both turbines were set to rotate counterclockwise. Similar to previous experiments with a single turbine, velocities were measured at various points downstream of the turbine pair and the velocity data was processed and analyzed as before. The resulting velocity ratio and turbulence intensities at z=1.5D (rotor mid-height) are shown in Figure 9 for two y-locations: y=0D (gap centreline between the turbine pair) and y=1D (centreline of one of the turbines). Contour plots developed from the interpolation of the velocity ratio and turbulence intensity measurements are provided in Figure 10. The
Figure 8: Lateral variation of a) velocity ratio and b) turbulence intensity at z=1.5D for different downstream locations. Blue x’s denote data measured in low ambient turbulence flow, and black circles denote data measured in high ambient turbulence flow. Dashed horizontal lines denote the edges of the turbine rotor.
A
A
B
Figure 9: Longitudinal variation of a) velocity ratio and b) turbulence intensity at z=1.5D for y=0D (black circles) and y=1D (purple diamonds) for a turbine pair operating in flow with high ambient turbulence.
B
Figure 10: Two turbine scenario contour plots for a) velocity ratio and b) turbulence intensity at z=1.5D.
streamwise velocity along y=1D recovers to 60% of the free-stream velocity by x=4.5D and recovers to 90% of the free-stream velocity by x=14D, similar to the wake produced by the single turbine operating in the flow with 12% ambient turbulence intensity. The velocity ratio along y=0D reveals increased streamwise velocities downstream from the gap between the two rotors. The streamwise velocity in the gap at x=2D is approximately 20% larger than the free-stream velocity measured upstream. These elevated velocities persist along the centreline of the flume until the end of the testing section, 20D downstream from the turbine pair. This region of high velocity flow downstream from the gap between the two turbines can be attributed to the effect of the rotors on the flow. The flow passing through the areas swept by the turbine rotors is decelerated and reduced, and the flow passing around each swept area (and between them) is accelerated and increased to compensate. This zone of high velocity flow can potentially be exploited by placing a third turbine
approximately 3-5 diameters downstream from the gap between the two upstream turbines. The turbulence intensity along y=0D was measured to be approximately 10-12%, which is very similar to the ambient turbulence intensity of the incident flow (I=12%).
Moreover, the data indicates that this moderate level of turbulence persists without diminishing over the full length of the wake region, to x=20D. This behaviour is notably different from the case without turbines (see Figure 4) where the ambient turbulence intensity of the incident flow decays to 5% at the point in the flume corresponding to x=20D. This may be attributed to the increased turbulence present in
the turbine wakes mixing with the ambient flow in between the two turbines. This mixing may provide an increased turbulence further downstream compared to the case with no turbines in the flow. The turbulence intensity measured at mid-rotor height along y=1D reaches a maximum of I=35% at x=3D downstream, and then decreases rapidly between x=3D and x=8D, where the turbulence intensity falls below 15%. Beyond x=12D, the turbulent intensities along y=0D and y=1D are virtually identical.
Influence of Low Ambient Turbulence on Two Turbines
The velocities within the wake downstream of the turbine pair were also measured in flow with a low level of ambient turbulence. The results of this experiment are plotted in Figure 11, superimposed on the results discussed above (measured in flow with high ambient turbulence). Similar to the single turbine results, the lower ambient turbulence reduces the rate at which the streamwise velocity recovers downstream in the near-field region (up to x=8D), but the turbulence level of the ambient flow has little influence on velocity recovery beyond x=10D. A similar trend is also observed for turbulence intensity where there is a large discrepancy between the low ambient turbulence and high ambient turbulence conditions in the near-field region, but this difference diminishes as the wake progresses downstream. The increase in velocity along y=0D is almost identical for the low and high ambient turbulence scenarios. The turbulence intensities measured along y=0D show a relatively large difference of ~10-15% close to the turbines (x<5D); however, this
Figure 11: Longitudinal variation of a) velocity ratio and b) turbulence intensity along y=0D and y=1D for a turbine pair operating in flows with low and high ambient turbulence.
A
B
difference in turbulence intensity diminishes further downstream as the wakes from the two turbines dissipate and begin to merge with the surrounding flow.
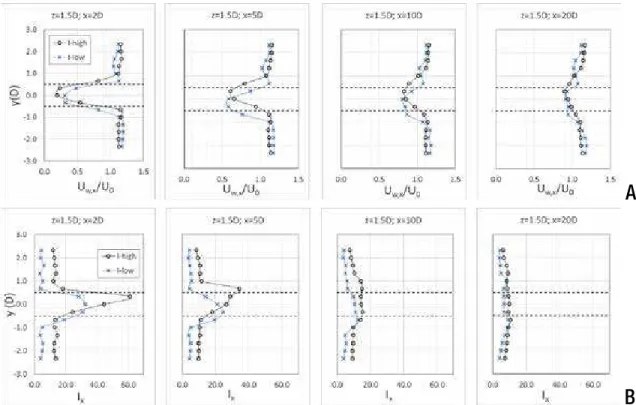
The plots in Figure 12 show the lateral variation of the velocity ratio and turbulence intensity at z=1.5D (mid-rotor height) for various x-locations (stations) downstream from the turbine pair for flows with both low and high ambient turbulence. Again, the wakes downstream from each turbine are somewhat asymmetric in the horizontal plane. The points of minimum velocity ratio and maximum turbulence intensity appear to be shifted away from the centreline of each rotor towards the side on which the rotor blades are moving upstream (the upper side in Figure 12). This pattern matches what was observed in the experiments with a single turbine. The
individual wakes from each of the turbines are clearly identifiable in the near-field region (between x=2D and x=5D). However, the wakes begin to dissipate and merge with the surrounding flow near x=5D and are almost completely dissipated and merged by the end of the testing section at x=20D. It can also be seen that the velocity ratio profiles for the two ambient flow conditions are very similar for x=5D and beyond. This suggests that the turbulence intensity of the incident flow has little influence on the horizontal distribution and recovery of streamwise velocity beyond x=5D downstream.
The zone of increased velocity along y=0D and between the rotors and the flume walls is clearly shown in Figure 12. The initial width of the central zone of accelerated flow is approximately 1D, suggesting that a third
turbine of the same size as the two upstream turbines placed on the centreline around x=3-5D downstream could benefit from the increased flow velocity in this region. The central zone of accelerated flow starts to weaken and decrease in size beyond x=5D as it starts to merge with the turbine wakes on either side. It would be interesting to investigate, either in future experiments or numerical simulations, the influence of the gap distance between the two upstream turbines on the intensity and persistence of the zone of accelerated flow downstream from the central gap. Such information could be used to inform array layout design.
Figure 12b clearly shows that the turbulence intensity in the combined wake downstream
from the turbine pair is strongly influenced by the turbulence intensity of the incident flow, such that incident flows with higher turbulence produce more turbulent wakes. The lateral distribution of turbulence intensity is very uneven in the nearfield region (for x=2D and x=5D). In this zone, the turbulence intensity immediately behind each rotor is much higher than in the gap between them or to either side of the rotor pair. However, by x=10D the lateral variations in turbulence intensity have decayed significantly and the turbulence intensity is much more uniformly distributed across the wake region, particularly for the case of ambient flow with higher turbulence. By x=20D, the lateral distribution of
turbulence intensity is essentially uniform for both ambient flow conditions.
Figure 12: Lateral variation of a) velocity ratio and b) turbulence intensity at z=1.5D at different stations downstream from a pair of cross-flow turbines. Blue x’s and black circles denote data measured in low and high turbulence flow, respectively. Dashed horizontal lines denote the outside edge of each turbine rotor.
A
CONCLUSION
The downstream wake produced by both a single and a pair of vertical axis cross-flow turbines has been measured in detail and the results have been presented. The velocity mapping exercise was carried out for two ambient turbulence intensities, a higher ambient turbulence of 12% and a lower ambient turbulence of 4%. The time averaged streamwise velocities downstream of a single turbine operating in a turbulent flow were shown to recover to 60% of the free-stream velocity at a distance of 4.5 turbine diameters and to 90% of the free-stream velocity at a distance of 14 turbine diameters. Decreasing the ambient flow turbulence slowed the velocity recovery such that a distance of 5.5 turbine diameters was required to recover to 60% of the free-stream velocity and a distance of 19 turbine diameters was required to recover to 90% of the free-stream velocity.
The wakes produced by a pair of turbines separated by 1 turbine diameter were also characterized for the two ambient turbulence intensities. The individual wake produced by a single turbine within the pair showed similar characteristics regarding velocity decay and recovery compared to the single turbine tests. In addition, a zone with higher velocities developed downstream from the gap between the two turbines, where flow speeds up to 20% greater than the free-stream velocity were measured. This region of high velocity flow had a width of 1 turbine diameter and persisted between 3 to 5 turbine diameters downstream from the gap between the turbine rotors. A third turbine placed in this region could benefit from greater in-flow velocities. Beyond approximately 5
diameters downstream, the intensity of the flow in central region gradually dissipates and the region becomes smaller.
The experiments described in this paper have produced a unique dataset concerning the character of the flow field downstream from small-scale vertical-axis cross-flow turbines operating in ambient flows with low and high levels of turbulence. The results presented in this paper represent a portion of the results available from the experimental program. Results for additional turbine configurations, including two configurations with in-line turbine pairs as well as a “simple” array composed of three turbines, will be disseminated in future publications. In future work, the data collected in these experiments will be used to help calibrate and validate a CFD model of wake generation, which will be used to investigate additional array layouts and scenarios as well as the similarity of the turbines wakes at low Reynolds numbers (model scale turbines) and high Reynolds numbers (full scale turbines). The ultimate goals of the project are to develop and validate numerical methods that are able to simulate complex flows within turbine arrays and develop a guideline to assist project
developers in designing turbine array layouts for specific project sites.
ACKNOWLEDGMENTS
The authors would like to thank Natural Resources Canada and the National Research Council of Canada for funding this study. REFERENCES
Bachant, P. and Wosnik, M. [2015].
flow turbine. Journal of Turbulence, Vol. 16, pp. 392-410.
Betz, A. [1920]. Das Maximum der theoretisch moglichen Ausnutzung des Windes durch Windmotoren, A, fur Das. Gesamte
Turbinewes. Vol. 26, pp. 307-309. Coles, D.S.; Blunden, L.S.; and Bahaj, A.S. [2016]. Experimental validation of the
distributed drag method for simulating large marine current turbine arrays using porous fences. International Journal of Marine Energy, Vol. 16, pp. 298-316. Garrett, C. and Cummins, P. [2007]. The
efficiency of a turbine in a tidal channel. Journal of Fluid Mechanics, Vol. 588, pp. 243-251.
Houlsby, G.T.; Draper, S.; and Oldfield, M.L.G. [2008]. Application of linear momentum actuator disc theory to open channel flow. University of Oxford
Department of Engineering Science Report No, OUEL 2296/08.
Knox, P.; Provan, M.; Cornett, A.; Murphy, E.; and Cousineau, J. [2018]. Experimental study of velocity deficit and wake due to single and multiple rectangular porous plates in steady flow. Coastlab 2018, Santander, Spain.
Mavi Innovations; NRC Ocean Coastal and River Engineering; Universite Laval; and Lambda2 [2016]. Quantifying extractable power in a stretch of river using an array of MHK turbines. Final report presented to Marine Renewables Canada.
Mycek, P.; Gaurier, B.; Germain, G.; Pinon, G.; and Rivoalen, R. [2013]. Numerical and experimental study of the interaction between two marine current turbines. International Journal of Marine Energy, Vol. 1, pp. 70-83.
Mycek, P.; Gaurier, B.; Germain, G.; Pinon, G.; and Rivoalen, E. [2014]. Experimental study of the turbulence intensity effects on marine current turbines behaviour. Part II: Two interacting turbines. Renewable Energy, Vol. 68, pp. 876-892.
Myers, L.E. and Bahaj, A.S. [2010]. Experimental analysis of the flow field around horizontal axis tidal turbines by use of scale mesh disk rotor simulators. Ocean Engineering, Vol. 37, pp. 218-227.
Myers, L.E.; Keogh, B.; and Bahaj, A.S. [2011]. Experimental investigation of inter-
array wake properties in early tidal turbine arrays. Oceans’11 MTS, Waikola, USA. Myers, L.E. and Bahaj, A.S. [2012]. An
experimental investigation simulating flow effects in first generation marine current energy converter arrays. Renewable Energy, Vol. 37, pp. 28-36.
Ordonez-Sanchez, S.; Sutherland, D.; Payne, G.; Bruce, T.; Gebreslassie, M.; Belmont, M.; and Moon, I. [2017]. Experimental evaluation of the wake characteristics of cross flow turbine arrays. Ocean Engineering, Vol. 141, pp. 215-226.
Provan, M.; Knox, P.; Cornett, A.; and Cousineau, J. [2018]. Experimental study of the wake produced by single and multiple rectangular porous plates. Marine Energy Technology Symposium 2018, Washington, USA. Stallard, T.; Collings, R.; Feng, T.; and Whelan,
J. [2013]. Interactions between tidal turbine wakes: experimental study of a group of
three-bladed rotors. Philosophical
Transactions of the Royal Society A, Vol. 371. Whelan, J.; Graham, J.; and Peiro, J. [2009]. A
free-surface and blockage correction for tidal turbines. Journal of Fluid Mechanics, Vol. 624, pp. 281-291.