HAL Id: hal-02009109
https://hal.archives-ouvertes.fr/hal-02009109
Submitted on 24 Apr 2019
HAL is a multi-disciplinary open access
archive for the deposit and dissemination of
sci-entific research documents, whether they are
pub-lished or not. The documents may come from
teaching and research institutions in France or
abroad, or from public or private research centers.
L’archive ouverte pluridisciplinaire HAL, est
destinée au dépôt et à la diffusion de documents
scientifiques de niveau recherche, publiés ou non,
émanant des établissements d’enseignement et de
recherche français ou étrangers, des laboratoires
publics ou privés.
A deep X-ray view of the bare AGN Ark 120
D. Porquet, C. Done, J.N. Reeves, N. Grosso, A. Marinucci, G. Matt, A.
Lobban, E. Nardini, V. Braito, F. Marin, et al.
To cite this version:
D. Porquet, C. Done, J.N. Reeves, N. Grosso, A. Marinucci, et al.. A deep X-ray view of the bare
AGN Ark 120: V. Spin determination from disc-Comptonisation efficiency method. Astron.Astrophys.,
2019, 623, pp.A11. �10.1051/0004-6361/201834448�. �hal-02009109�
https://doi.org/10.1051/0004-6361/201834448 c D. Porquet et al. 2019
Astronomy
&
Astrophysics
A deep X-ray view of the bare AGN Ark 120
V. Spin determination from disc-Comptonisation efficiency method
D. Porquet
1, C. Done
2, J. N. Reeves
3, N. Grosso
1, A. Marinucci
4, G. Matt
4, A. Lobban
5, E. Nardini
6, V. Braito
7,
F. Marin
8, A. Kubota
9, C. Ricci
10,11, M. Koss
12,13, D. Stern
14, D. Ballantyne
15, and D. Farrah
161 Aix-Marseille Univ., CNRS, CNES, LAM, Marseille, France
e-mail: [email protected]
2 Department of Physics, University of Durham, South Road, Durham DH1 3LE, UK
3 Center for Space Science and Technology, University of Maryland Baltimore County, 1000 Hilltop Circle, Baltimore,
MD 21250, USA
4 Dipartimento di Matematica e Fisica, Università degli Studi Roma Tre, Via della Vasca Navale 84, Roma 00146, Italy 5 Astrophysics Group, School of Physical and Geographical Sciences, Keele University, Keele, Staffordshire ST5 5BG, UK 6 INAF – Osservatorio Astrofisico di Arcetri, Largo Enrico Fermi 5, Firenze 50125, Italy
7 INAF – Osservatorio Astronomico di Brera, Via Bianchi 46, Merate 23807, LC, Italy
8 Université de Strasbourg, CNRS, Observatoire Astronomique de Strasbourg, UMR 7550, Strasbourg 67000, France
9 Department of Electronic Information Systems, Shibaura Institute of Technology, 307 Fukasaku, Minuma-ku, Saitama-shi, Saitam
337-8570, Japan
10 Núcleo de Astronomía de la Facultad de Ingeniería, Universidad Diego Portales, Av. Ejército Libertador 441, Santiago, Chile 11 Kavli Institute for Astronomy and Astrophysics, Peking University, Beijing 100871, PR China
12 Institute for Particle Physics and Astrophysics, ETH Zurich, Wolfgang-Pauli-Strasse 27, 8093 Zürich, Switzerland 13 Eureka Scientific Inc., 2452 Delmer Street, Suite 100, Oakland, CA 94602, USA
14 Jet Propulsion Laboratory, California Institute of Technology, 4800 Oak Grove Drive, Mail Stop 169-221, Pasadena,
CA 91109, USA
15 Center for Relativistic Astrophysics, School of Physics, Georgia Institute of Technology, 837 State Street, Atlanta,
GA 30332-0430, USA
16 Department of Physics, Virginia Tech, Blacksburg, VA 24061, USA
Received 17 October 2018/ Accepted 18 December 2018
ABSTRACT
Context. The spin of supermassive black holes (SMBH) in active galactic nuclei (AGN) can be determined from spectral signature(s) of relativistic reflection such as the X-ray iron Kα line profile, but this can be rather uncertain when the line of sight intersects the so-called warm absorber and/or other wind components as these distort the continuum shape. Therefore, AGN showing no (or very weak) intrinsic absorption along the line-of-sight such as Ark 120, a so-called bare AGN, are the ideal targets for SMBH spin measurements. However, in our previous work on Ark 120, we found that its 2014 X-ray spectrum is dominated by Comptonisation, while the relativistic reflection emission only originates at tens of gravitational radii from the SMBH. As a result, we could not constrain the SMBH spin from disc reflection alone.
Aims. Our aim is to determine the SMBH spin in Ark 120 from an alternative technique based on the global energetics of the disc-corona system. Indeed, the mass accretion rate ( ˙M) through the outer disc can be measured from the optical-UV emission, while the bolometric luminosity (Lbol) can be fairly well constrained from the optical to hard X-rays spectral energy distribution, giving access
to the accretion efficiency η = Lbol/( ˙Mc2) which depends on the SMBH spin.
Methods. The spectral analysis uses simultaneous XMM-Newton (OM and pn) and NuSTAR observations on 2014 March 22 and 2013 February 18. We applied the optxconv model (based on optxagnf) to self consistently reproduce the emission from the inner corona (warm and hot thermal Comptonisation) and the outer disc (colour temperature corrected black body), taking into account both the disc inclination angle and relativistic effects. For self-consistency, we modelled the mild relativistic reflection of the incident Comptonisation components using the xilconv convolution model.
Results. We infer a SMBH spin of 0.83+0.05−0.03, adopting the SMBH reverberation mass of 1.50 × 10⁸M
. In addition, we find that the
coronal radius decreases with increasing flux (by about a factor of two), from 85+13−10Rgin 2013 to 14 ± 3 Rgin 2014.
Conclusions. This is the first time that such a constraint is obtained for a SMBH spin from this technique, thanks to the bare properties of Ark 120, its well determined SMBH reverberation mass, and the presence of a mild relativistic reflection component in 2014 which allows us to constrain the disc inclination angle. We caution that these results depend on the detailed disc-corona structure, which is not yet fully established. However, the realistic parameter values (e.g. Lbol/LEdd, disc inclination angle) found suggest that this is a
promising method to determine spin in moderate- ˙MAGN.
Key words. X-rays: individuals: Ark 120 – galaxies: active – quasars: general – radiation mechanisms: general – accretion, accretion disks
Open Access article,published by EDP Sciences, under the terms of the Creative Commons Attribution License (http://creativecommons.org/licenses/by/4.0),
1. Introduction
In the standard paradigm (the so-called no hair theorem), astro-physical black holes (BH) are described by their mass and their angular momentum commonly called spin. The spin is usually expressed in terms of the dimensionless parameter a ≡ cJ/(GM2
BH), where c, J, G and MBH are the speed of
light, the angular momentum, the Gravitational constant and the black hole mass, respectively. In stellar-mass BHs (black hole X-ray binaries, BHXBs), the spin is expected to be native (King & Kolb 1999, but seeFragos & McClintock 2015); while, in SMBHs (with masses spanning from a few millions to sev-eral billions solar masses), the spin is related to the accretion-ejection history of SMBHs, for example chaotic versus coherent accretion, relativistic jets, and to the galaxy merger history (e.g.
Blandford & Znajek 1977; Berti & Volonteri 2008; King et al. 2008).
For BHXBs, there are up-to-now four main methods that can be applied to X-ray data to determine their spin (e.g. Remillard & McClintock 2006; Miller et al. 2009;
McClintock et al. 2011;Reynolds 2014, and references therein): Spectral fitting of the relativistic reflection iron Kα line pro-file, spectral fitting of the thermal continuum emission (also called “disc continuum fitting” method), quasi periodic oscilla-tions (QPO), and polarimetry. The first two are the most used and depend on the accretion disc extending down to the inner-most stable circular orbit (ISCO) radius, RISCO, which is spin
dependent. Determining the spin from the QPO depends on the assumed model – even with current data favouring Lense-Thirring precession for low frequency QPOs (Ingram et al. 2009,
2016). Indeed, the constraints on the spin are not tight unless combined with models for the high frequency QPOs (Motta 2016) whose origin is more uncertain. The last technique, X-ray polarimetry (e.g.Dovˇciak et al. 2004;Schnittman & Krolik 2009) is waiting for the launch of the next generation of X-ray polarimeters, such as the Imaging X-ray Polarimetry Explorer (IXPE, a NASA Small Explorer planned for launch in 2021;
Weisskopf et al. 2016).
In the case of SMBHs in AGN, the method based on X-ray spectral analysis of the relativistic reflection signature(s) was the only one used until recently (e.g. Reynolds 2014, and ref-erences therein). Indeed, disc continuum fitting is more difficult in local AGN for two reasons. Firstly, whereas the disc radiates in the X-rays for BHXBs, the disc models predict a peak tem-perature for typical broad-line Seyfert 1 s (BLS1s) AGN (with a BH mass of 108M accreting at Lbol/LEdd= 0.2) in the extreme
UV (∼20 eV) that is unobservable due to Galactic absorption. Secondly, the observed emission in typical AGN is not generally as disc-dominated as observed in BHXBs at similar Lbol/LEdd=
0.2. Instead, the optically-thick, geometrically-thin disc emis-sion appears to turn over in the far UV, connecting to an upturn in the observed soft X-ray flux. This can be fit by an additional warm Comptonisation component with kTe ∼ 0.1−0.5 keV,
which is optically-thick with τ ∼ 10−20 (e.g. Porquet et al. 2004; Piconcelli et al. 2005; Bianchi et al. 2009; Scott et al. 2012; Petrucci et al. 2018), very different from the standard hot X-ray corona which has τ ∼ 1, and kTe ∼ 30–150 keV
(e.g.Brenneman et al. 2014;Balokovi´c et al. 2015;Fabian et al. 2015,2017; Marinucci et al. 2014;Marinucci & Tortosa 2016;
Tortosa et al. 2018, but see for some exceptions, Matt et al. 2015;Tortosa et al. 2017; Kara et al. 2017; Turner et al. 2018). However, as pointed out by Done et al. (2012), one exception can be AGN with much lower BH masses and higher Lbol/LEdd
such as the narrow-line Seyfert 1 s (NLS1s) for which the disc
emission is predicted to extend to the soft X-rays and peak near 0.1 keV, and where such disc-dominated spectra are often seen. However, even here the disc models drop much more sharply than the observed soft X-ray shape, these also require a small additional warm Compton component as well as the dominant disc emission and weak (and steep) X-ray coronal emission typ-ically seen in BHXBs at high Eddington ratio (Done et al. 2012;
Jin et al. 2012).
Done et al. (2012) developed a radially stratified two-zone Comptonisation disc model (see their Fig. 5), called optxagnf. This model conserves energy, assuming that the emissivity is set by the standard geometrically thin disc Novikov & Thorne
(1973)’s relation, but the energy generated by mass accre-tion between Rcorona and RISCO is dissipated as both warm
and hot coronal Comptonisation emission, while the outer disc (R > Rcorona) emits in the optical-UV as expected for a
multi-colour black-body disc. This model has been applied to some disc-dominated NLS1s (that is, those where Rcorona is close
to RISCO) to constrain spin and mass (Done et al. 2012, 2013;
Jin et al. 2012;Done & Jin 2016); but typically the spin value was either fixed or almost unconstrained due to large uncer-tainties in the BH mass. For disc-dominated objects, pure disc models can also be used for spin measurements but, until now, have only provided weak constraints due to large uncer-tainties on the BH mass of the considered AGN, for exam-ple SDSS J094533.99+100950.1, NGC 3783, and H1821+643 (Czerny et al. 2011;Capellupo et al. 2017). This latter technique is similar to the disc-continuum fitting method (which also depends on BH mass, distance and disc inclination) used for BHXBs.
The optxagnf model can also fit the BLS1s for which the soft X-ray excess is found to produce mainly by warm Comptoni-sation (Done et al. 2012;Jin et al. 2012;Mehdipour et al. 2011,
2015; Porquet et al. 2018) rather than by relativistic reflection (Crummy et al. 2006). Indeed, in case the X-ray spectrum is mainly due to warm and hot Comptonisation the spin can still be constrained from the global energetics of the flow (Done et al. 2012). This was first explored by Davis & Laor (2011), who assumed that the optical-UV emission was produced in the outer disc, so that the mass accretion rate for a standard disc could be constrained simply from the optical-UV luminosity as:
Lopt−UV∝ (MBHM)˙ 2/3cos θ, (1)
where MBH is the SMBH mass, ˙M the absolute accretion rate
and θ the accretion disc inclination angle. If MBHis known, for
example from reverberation mapping, and θ is constrained or already known, then this relation determines the mass accretion rate through the outer disc. The bolometric luminosity is:
Lbol= η ˙Mc2, (2)
where η is the accretion radiative efficiency that indicates how much binding energy at the ISCO is radiated away. Since the ISCO radius varies monotonically with the black hole spin value (Bardeen et al. 1972), η is directly related to the black hole spin, assuming that the inner radius of the accretion disc cor-responds to the ISCO. Davis & Laor(2011) applied this disc-Comptonisation efficiency method to a sample of bright QSOs. They find that η increased with MBH, being consistent with low
spin for lower mass SMBH but requiring higher spin for the most massive objects in their sample. This is consistent with the results of Jin et al. (2012), where their sample of nearby, fairly low mass SMBH could all be fit with zero spin (that is, η = 0.057) models.
Ark 120 (z = 0.03271; Theureau et al. 2005) is the bright-est and cleanbright-est bare AGN known. Indeed, its UV and X-ray spectra are “contaminated” neither by line of sight warm absorption signatures (Crenshaw et al. 1999; Vaughan et al. 2004; Reeves et al. 2016) nor by a neutral intrinsic absorber (Reeves et al. 2016). Ark 120 is also free from intrinsic red-dening in its infrared-optical-UV continuum (Ward et al. 1987;
Vasudevan et al. 2009), though there are non-negligible UV reddening and X-ray absorption from our own Galaxy in its direction. Moreover, the SMBH mass of Ark 120 is well con-strained thanks to reverberation mapping measurement per-formed byPeterson et al.(2004) who assumed the virial factor1 fromOnken et al.(2004), and obtained 1.50 ± 0.19 × 10⁸M
. In
Porquet et al.(2018), using a deep X-ray observation performed in March 2014 with XMM-Newton and NuSTAR, we show that the X-ray spectra of Ark 120 is dominated by warm and hot Comptonisation components. A mild reflection component is still required above about 10 keV, but with a low degree of rel-ativistic smearing indicating that the relrel-ativistic reflection only occurs beyond several 10 s of Rg (see alsoNardini et al. 2016),
and therefore does not enable us to infer any constraint on the SMBH spin from disc reflection alone.
In this work, we report on the Ark 120 spectral energy distribution (SED) fitting using the disc-Comptonisation e ffi-ciency method combining simultaneous optical–UV (XMM-Newton/OM), and X-rays (XMM-Newton/pn and NuSTAR) observations performed on 2014 March 22 and 2013 February 18. In Sect.2, we describe the data reduction procedure, while the spectral modelling is described in Sect.3. The simultaneous optical to hard X-ray data analysis for the 2014 March 22 and the 2013 February 18 observations is reported in Sect.4. In Sect.5
our main results are discussed, followed by our conclusions in Sect.6.
2. Observation, data reduction
Ark 120 was observed by XMM-Newton (Jansen et al. 2001) over four consecutive orbits between 2014 March 18 and March 24 (PI: D. Porquet). Here, we used the 2014 March 22 obser-vation, which was the only one that was simultaneous with a NuSTARobservation (PI: NuSTAR AGN team). We also analysed an earlier joint XMM-Newton and NuSTAR observation, which was performed in a single XMM-Newton orbit on 2013 Febru-ary 18 (PI: G. Matt). During this 2013 observation, the X-ray flux of Ark 120 was about a factor of two lower than in 2014 (Matt et al. 2014; Marinucci et al. 2019), while the optical-UV flux was also lower (Lobban et al. 2018). Figure1shows the six-month Swift UVOT and XRT light curves (Lobban et al. 2018). We note that the shaded areas show the equivalent XRT rates, corresponding to the flux levels measured from the 2013 and 2014 XMM-Newton observations described above. This illus-trates that during the 2013 and 2014 XMM-Newton observa-tions, the source was observed very close to its lowest and highest flux state levels, respectively. The log of the observations of Ark 120 used in this work is reported in Table1.
2.1. XMM-Newton data reduction
For the data reduction we used the Science Analysis System (SAS) v16.1.0, applying the latest calibrations available on 2018 February 2. This updated calibration, compared toPorquet et al.
(2018), results in a better 7–10 keV cross-calibration between pn 1 A definition of the virial factor is given in Sect.5.
Fig. 1.The Swift UVOT light curve of Ark 120 showing the corrected count rates in the U (red) and UVM2 (blue) bands (adapted from
Lobban et al. 2018). Each point corresponds to a single image observa-tion. The 0.3–10 keV XRT light curve (black) is overlaid with an addi-tional y-axis scale. The lower and upper grey shaded areas correspond to the XRT count rates at the 2013 and 2014 XMM-Newton 0.3–10 keV fluxes, respectively. The horizontal dashed lines correspond to the mean flux for each dataset.
and NuSTAR data with a slight steepening of the 2–10 keV pho-ton indices by about+0.03, in other words, by about 1.6%. 2.1.1. pn data
Due to the high source brightness, the EPIC-pn camera (Strüder et al. 2001) was operated in Small Window mode to pre-vent any pile-up. The 2013 and 2014 pn spectra were extracted from circular regions centred on Ark 120, with radii of 3000. We
selected the event patterns 0–4, that is, single and double pixels, while we also applied FLAG==0 in order that all events at the edge of a CCD and at the edge of a bad pixel were excluded. The background spectra were extracted from a rectangular region in the lower part of the small window that contains no (or neg-ligible) source photons. After the correction for dead time and background flaring, the total net pn exposures were about 82 ks for the 2014 observation and about 88 ks for the 2013 observa-tion. Redistribution matrices and ancillary response files for the two pn spectra were generated with the SAS tasks rmfgen and arfgen. We used the time-averaged pn spectra since, as shown in
Lobban et al.(2018), the spectral variability within a single orbit is slow and moderate. The 0.3–10 keV pn spectra were binned to give 100 counts per bin.
A gain shift was applied to take into account the known inaccuracy of the EPIC-pn energy scale likely due to inaccura-cies in the long-term charge transfer inefficiency (CTI) calibra-tion2. The gain xspec command allows us to modify accordingly the response file gain and is characterised by two parameters: slope and intercept (in units of keV). The new energy is calcu-lated by E0 = E/hslopei − hintercepti. For the 2014
observa-tions, we fit simultaneously the four available pn spectra tying the gain parameters values using the following baseline model: tbnew×(comptt+zpo+zga(broad)+3×zga(BLR)). Indeed, such modelling is adequate for the 2014 observation as shown in
Porquet et al.(2018). The parameters of the broad Gaussian and of the three BLR Gaussian lines were tied between the four observations. We allowed to vary between each observation: kTe,
τ, normalisation(comptt), Γ and normalisation(zpo). We infered slope = 1.0083+0.0001−0.0004 and intercept = 4.77+0.11−0.01 × 10
−3keV. We
performed the same modelling for the 2013 pn spectrum but 2 http://xmm2.esac.esa.int/docs/documents/
Table 1. Observation log of the data analysed in this work for Ark 120.
Mission Obs. ID Obs. start (UTC) Exp.a Cb
(ks) (s−1)
XMM-Newton 0721600401 2014 March 22 – 08:25:17 82.4 25.23 ± 0.02 (pn)
NuSTAR 60001044004 2014 March 22 – 09:31:07 65.5 1.089 ± 0.004 (FPMA)
65.3 1.072 ± 0.004 (FPMB)
XMM-Newton 0693781501 2013 February 18 – 11:45:48 87.7 10.30 ± 0.01 (pn)
NuSTAR 60001044002 2013 February 18 – 10:46:07 79.5 0.626 ± 0.003 (FPMA)
79.4 0.598 ± 0.003 FPMB)
Notes.(a)Net exposure in ks.(b)Source count rate over the 0.3–10 keV for XMM-Newton/pn and over 3–79 keV for NuSTAR.
without the need of a broad Gaussian line, and we infered slope = 1.0073+0.0005−0.0007and intercept = −1.72+0.14−0.46× 10
−3keV.
2.1.2. OM data
We used the XMM-Newton optical-UV Monitor telescope (here-after OM;Mason et al. 2001). For the March 2014 observation, we acquired about about five ∼1.2 ks exposures in default imag-ing and fast mode consecutively through the V (effective wave-length= 5430 Å), B (4500 Å), U (3440 Å), UVW1 (2910 Å) and UVM2 (2310 Å) filters before spending the rest of the observa-tion acquiring exposures with the UVW2 (2120 Å) filter. We did not use the (redundant) fast mode data reported inLobban et al.
(2018). For the 2013 observation, a series of snapshots were consecutively acquired with the UVW1 (ten ∼3.4 ks exposures), UVM2 (ten ∼4.4 ks exposures) and UVW2 (ten ∼4.4 ks expo-sures) filters.
The imaging mode data were processed using the SAS script omichain which takes into account all necessary calibration processes (e.g. flat-fielding), and runs a source detection algo-rithm before performing aperture photometry on each detected source, and combines the source lists from separate exposures into a single master list to compute mean corrected count rates. The optical and UV counterparts of Ark 120 detected with the OM is point-like. The FWHM is 100. 5 and 300with the V and UV
filters, respectively (Mason et al. 2001). The aperture radius is 12 unbinned pixels (corresponding to 500. 7 for 000. 4765 square
pix-els) and the background is estimated within an annulus region: for the optical filters the inner and outer radii of the annulus are 14.0 and 25.1 unbinned pixels, respectively (corresponding to 600. 7 and 1100. 9, respectively); for the UV filters the inner and outer
radius of the annulus are 37.0 and 42.4 unbinned pixels, respec-tively (corresponding to 1700. 6 and 2000. 2, respectively).
For comparison we show in Fig.2 the omichain apertures for the V-filter overlaid on the Pan-STARRS-1 g-filter image3 (Chambers et al. 2016). As the omichain background apertures for the optical filter are located on the galaxy disc, we recom-puted the OM optical photometry with the SAS task omsource from the unbinned central images in the detector plane, cor-rected for the modulo-8 pattern (*OM*IMAGE_0000.FIT) using a background aperture of ∼1200-radius located ∼4300 SW of Ark 120.
Figure 3 illustrates the wavelength coverage with the OM broad-band UV-filters of the UV emission of Ark 120 by com-parison with the observed UV spectrum obtained with the Hub-ble Space Telescope Faint Object Spectrograph (HST/FOS) on 3 The Pan-STARRS-1 image cutout server is available at http://
ps1images.stsci.edu 14.0s 12.7s 11.3s 5h16m10.0s 08.7s 08m40s -0d09m00s 20s 40s Right Ascension (J2000) Declination (J2000) custom optical bgd UV bgd optical bgd source
Fig. 2.Pan-STARRS-1 g-filter image of Ark 120. North is up and east is left. The intensity is non-linearly scaled using an asinh transfor-mation. The circle and the dashed annulus are the OM source and background apertures, respectively. The dashed circle is the custom background aperture that we used for the optical photometry.
1995 July 29 (post-COSTAR with a science aperture of 000. 86
in diameter) by Kuraszkiewicz et al. (2004)4. The green data are the UVW2 and UVM2 synthetised photometry from the HST/FOS spectrum using the OM filter profiles. The OM broad-band UV photometry is little affected by the bright broad emis-sion lines and is a measure of the continuum emisemis-sion. The red and blue data, respectively, are the observed OM UV photome-try on 2014 March 22 and on 2013 February 18 (Lobban et al. 2018).
We estimated the contribution of the host galaxy to the OM optical photometry by using the flux variation gradient method proposed by Choloniewski (1981). In this method, the combined fluxes of the galaxy and the AGN are obtained in two broad-band filters within an aperture centred on the galactic nucleus and plotted in a flux-flux diagram. The observed flux-flux vari-ation produced by the AGN activity follows a linear trend, characterised by a slope determined by the host-free AGN con-tinuum in the filter pair, and independent of the aperture size as the AGN is spatially unresolved (e.g. Choloniewski 1981;
Doroshenko et al. 2008;Winkler et al. 1992;Haas et al. 2011). Therefore, the AGN colour index in the filter pair is indepen-4 The merged calibrated spectrum of Ark 120 was downloaded from
http://hea-www.harvard.edu/~pgreen/HRCULES.html, and smoothed with a four-bin window for better visibility.
Fig. 3.Wavelength coverage of the UV emission of Ark 120 with the OM broad-band UV-filters. The continuous line is the observed UV spectrum of Ark 120 obtained with the Hubble Space Telescope Faint Object Spectrograph (HST/FOS) on 1995 July 29 (Kuraszkiewicz et al. 2004), where the main broad emission lines are labelled. The faint absorption lines are galactic in origin (Crenshaw et al. 1999). The dashed lines are the OM filter areas. The green data are the syn-thetised photometry that we computed from this HST/FOS spectrum using the OM broad-band UV-filter profiles. The red and blue data are the observed mean UVW2, UVM2, and UVW1 fluxes from the cor-rected observed mean count rates on 2014 March 22 and on 2013 Febru-ary 18, respectively (Lobban et al. 2018).
Fig. 4.Uversus V dereddened fluxes of Ark 120, measured in a 600
.7-radius aperture with OM. The galaxy and galaxy+AGN slopes are from
Doroshenko et al.(2008).
dent of the AGN flux. In this flux-flux diagram, the galaxy locus is a line going through the origin with a slope given by the galaxy colour index in the filter pair. The intersection of these two lines provides the estimate of the galaxy flux in the aperture.
We selected near-simultaneous OM photometry in V-U and U-B filters obtained in subsequent exposures5. To convert the OM count rates to fluxes we used the conversion factors obtained
5 Namely, V-filter S403 and U-filter S007 exposures, and U-filter S408
and B-filter S008 exposures.
Fig. 5.Uversus B dereddened fluxes of Ark 120, measured in a 600
.7-radius aperture with OM. The galaxy and galaxy+AGN slopes are from
Doroshenko et al.(2008).
from observations of standard white dwarf stars6 to be consis-tent with the canned OM response matrices used for the spec-tral modelling in Sect.3. We dereddened these observed fluxes using E(B − V) = 0.113 (Schlafly & Finkbeiner 2011) and the extinction law of Cardelli et al. (1989) using RV = 3.1,
lead-ing to AV,OM = 0.355 mag, AB,OM = 0.451 mag, and AU,OM =
0.563 mag. We obtain: FV = 17.68 ± 0.09 mJy, FB = 13.32 ±
0.05 mJy, and FU= 14.63 ± 0.05 mJy.
We used the AGN and galaxy colour indices obtained by
Doroshenko et al. (2008) for Ark 120 in 700. 5-radius aperture
and 700. 7–1300. 8–radius annulus, respectively, neglecting possible
variations of the galaxy colour indices with distance from the nucleus. Following Doroshenko et al. (2008), we used U − V and U − B filter pairs to minimise the impact of the colour-index errors on the intersection, as the differences between the colour indices of the AGN and galaxy is largest for these filter pairs. From the AGN colour indices U − B = −1.015 ± 0.018 and B − V = +0.021 ± 0.009 (see Table 3 ofDoroshenko et al. 2008) and after dereddening7 we computed8 the galaxy+AGN flux-flux slopes of 1.48 ± 0.03 and 1.21 ± 0.02 for the UV and U Bflux-flux plot, respectively. From the galaxy colour indices (U − B)g = −0.13 ± 0.24 and (B − V)g = +0.80 ± 0.03
(Doroshenko et al. 2008) and after dereddening, we computed the galaxy flux-flux slopes of 0.32 ± 0.07 and 0.54 ± 0.12 for the UVand U B flux-flux plot, respectively.
Figures4and5show the UV and U B flux-flux plots, respec-tively. Taking into account the slope uncertainties, we obtain the following dereddened fluxes of the galaxy in the central aperture: FgV = 9.9 ± 0.8 mJy, FgB= 2.3 ± 0.7 mJy, and FgU= 2.3 ± 1.2 mJy (average value of the UV and U B flux-flux plots), corresponding to 56±4%, 17±5%, and 15±7%, respectively, of the dereddened 6 Namely, FCFV = 2.49, FCFB = 1.29, FCFU = 1.94 in unit
of 10−16erg cm−2Å−1count−1 (from the header of the calibration file
OM_COLORTRANS_0010.CCF).
7 We adopted for the effective wavelengths 5500, 4330, 3650 Å for
the V, B, and U Johnson filters, respectively. We dereddened of AV =
0.350 mag, AB= 0.473 mag, and AU = 0.545 mag.
8 We adopted for the conversion from magnitude in the
Johnson-Cousin photometric system to Jy, the zero magnitude fluxes of 3836.3, 4266.7, and 1895.8 Jy in V, B, and U, respectively.
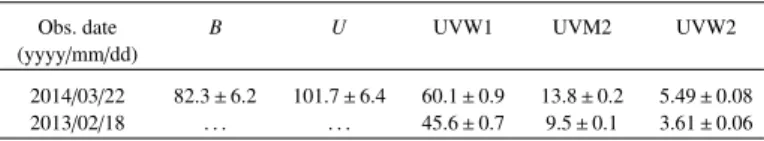
Table 2. OM average reddened count rates (expressed in s−1) of the
AGN and associated errors for optical and UV filters used for the SED fitting.
Obs. date B U UVW1 UVM2 UVW2 (yyyy/mm/dd)
2014/03/22 82.3 ± 6.2 101.7 ± 6.4 60.1 ± 0.9 13.8 ± 0.2 5.49 ± 0.08 2013/02/18 . . . 45.6 ± 0.7 9.5 ± 0.1 3.61 ± 0.06
Notes. See text for details on their calculations.
flux inside the central aperture. Since the V data are strongly dominated by the host galaxy emission, we did not use them for the SED fitting, and used the B value from the UB flux-flux plot. Therefore, we subtracted the following estimate of the galaxy contributions inside the central aperture to the observed (red-dened) count rates: 9.8 ± 3.1, and 16.7 ± 8.6 counts s−1 in the B, and U filters, respectively.
For each optical and UV filters, we took the average (with-out weighting) of count rates in the unbinned central image (by contrast to omichain, we did not include the redundant count rate of the binned central image) with corresponding Gaussian propagated errors. We subtracted the above contribution of the galaxy only for the optical count rates, as the host contribution is negligible in the UV.
In order to take into account the OM calibration uncertainty of the conversion factor between the count rate and the flux, we added quadratically to the statistical error of the count rate a rep-resentative systematic error of 1.5%9. The final OM reddened count rates and associated errors are reported in Table2. We used OM canned response matrices10to fit this OM photometry with XSPEC.
2.2. NuSTAR data reduction
NuSTAR (Harrison et al. 2013) observed Ark 120 with its two co-aligned X-ray telescopes with corresponding focal planes: Focal Plane Module A (FPMA) and B (FPMB) starting on 2013 February 18 and 2014 March 22 for a total of ∼166 ks and ∼131 ks of elapsed time, respectively. The Level 1 data products were processed with the NuSTAR Data Analysis Software (NuS-TARDAS) package (v. 1.6.0). Cleaned event files (level 2 data products) were produced and calibrated using standard filtering criteria with the nupipeline task and the calibration files avail-able in the NuSTAR calibration database (CALDB: 20170222). Extraction radii for both the source and background spectra were 1.25 arcmin. After this process, the net exposure times for the two observations were about 79 ks (2013) and 65 ks (2014). The two pairs of NuSTAR spectra were binned in order to over-sample the instrumental resolution by at least a factor of 2.5 and to have a Signal-to-Noise Ratio (SNR) greater than five in each spectral channel. We allowed for cross-calibration uncer-tainties between the two NuSTAR spectra and the simultaneous XMM-Newton/pn spectrum by including in the fit a cross-normalisation constant – which are let free to vary – correspond-ing to CNuSTAR Aand CNuSTAR B for NuSTAR FPMA and FPMB
spectra, respectively. 9 http://xmm2.esac.esa.int/docs/documents/ CAL-SRN-0346-1-0.pdf 10 Available athttps://www.cosmos.esa.int/web/xmm-newton/ om-response-files 3. Spectral modelling
3.1. Galactic hydrogen column density and extinction correction
The Galactic Hydrogen column density (NH) is assumed to
be 9.78 × 1020cm−2 as inferred from the weighted average NHvalue of the Leiden/Argentine/Bonn Survey of Galactic H i
(Kalberla et al. 2005). Since there can be some additional con-tribution associated with molecular hydrogen (Willingale et al. 2013), we allowed the value of Galactic NH to slightly vary.
However, we did not allow for any intrinsic absorption in the rest frame of Ark 120, since, as found inReeves et al. (2016) from the 2014 deep RGS spectrum, none is present. We used the X-ray absorption model tbnew (v2.3.2) fromWilms et al.(2000), assuming throughout their ISM elemental abundances and the cross-sections fromVerner et al.(1996).
The redden component allows us to take into account the IR-optical-UV extinction from our Galaxy (Cardelli et al. 1989). The extinction at V is A(V) = E(B − V) × RV, with
the standard value of RV being 3.1 for the Milky Way. We
fixed E(B − V) to 0.113 that corresponds to Galactic Extinc-tion from theSchlafly & Finkbeiner(2011) recalibration of the
Schlegel et al. (1998) infrared-based dust map. As mentioned previously, Ark 120 does not show any intrinsic reddening in its infrared-optical continuum (Ward et al. 1987; Vasudevan et al. 2009).
3.2. Disc-Comptonisation modelling: optxconv
The broad X-ray spectrum of Ark 120 is dominated by warm and hot Comptonisation in both March 2014 (Porquet et al. 2018, see their Fig. 9), and February 2013 observations (Matt et al. 2014), though a mild relativistic reflection contribution is observed beyond tens of Rgin 2014. As described in the introduction, the
baseline model used in this work, optxagnf (Done et al. 2012), allows us to infer the global energetics of the flow (Davis & Laor 2011), and then the SMBH spin. Since the optxagnf model includes the colour temperature corrected black body of the outer accretion disc, we were able to use the corresponding OM data (see Sect.2.1.2).
3.2.1. Description of the optxagnf model parameters
The optxagnf model is characterised by the following parameters:
– The SMBH mass (MBH) in solar masses.
– The co-moving distance (D) in Mpc.
– The log(Lbol/LEdd) ratio, which is equal to log( ˙M/ ˙MEdd),
where ˙Mis the absolute accretion rate (see Eq. (1)) and ˙MEdd
is the Eddington accretion rate.
– The dimensionless BH spin (a): 0≤ a ≤ 0.998.
– The coronal radius (Rcorona) in units of Rgwhere the
transi-tion from a colour temperature corrected black body emis-sion to a Comptonised spectrum occurs (the latter extending down to RISCO).
– The log of the outer radius of the disc in units of Rg: here, we
used the option allowing to fix it to the self-gravity radius as calculated fromLaor & Netzer(1989). However, fixing it to a specific value, such as for example five, has only a marginal impact of the fit results.
– The electron temperature (kTe) of the warm Comptonisation
component in keV.
– The optical depth (τ) of the warm Comptonisation component.
– The spectral index (Γ) of the hot Comptonisation compo-nent (power-law shape) which has a (fixed) temperature set internally at 100 keV (based on the nthcomp model;
Zdziarski et al. 1996;Zycki et al. 1999˙ ).
– The fraction ( fpl) of the power below Rcoronawhich is emitted
in the hot Comptonisation component. 3.2.2. Taking into account inclination effects
The optxagnf model is by default calculated for a disc inclination angle (θ) of 60◦(that is, for a normalisation value tied to unity).
Therefore in order to take into account inclination effects on the optxagnf component emission, we linked its normalisation to the disc inclination angle of the relativistic reflection component (reflcomp, see Sect.3.3) using a cos(θ)/cos(60◦) relationship.
3.2.3. Taking into account relativistic effects: the optxconv model
The optxagnf model does not include any relativistic effects on the propagation of light from the disc to the observer, but the combination of Doppler and gravitational shifts may impact the results. We included these relativistic effects using the optx-conv model detailed inDone et al.(2013), which effectively con-volves the broad-band emission from optxagnf with the relativis-tic blurring calculated by the relconv convolution model (v0.4c;
Dauser et al. 2010). The relconv model is characterised by the following parameters:
– the radius (Rbrexpressed in Rg) where the broken power-law
emissivity index changes from q1 (for R < Rbr) to q2 (for
R> Rbr). Throughout this work, q1and q2 are tied together
and fixed to the typical value of 3.0. – the dimensionless BH spin (a);
– the disc inclination angle (θ, expressed in degrees);
– the inner and outer radii of the disc where the relativistic reflection is observed: Rinand Rout(expressed in Rg),
respec-tively;
– The limb-darkening/-brightening laws (0, 1 and 2 correspond to isotropic, darkening and brightening law, respectively). Here, we assumed an isotropic value but we checked that this has a negligible impact on the fit results.
The soft excess (warm Comptonisation) and the hard energy tail (hot Comptonisation) were convolved with the relconv rel-ativistic kernel between RISCO and Rcorona where the coronal
emission occurs. Outside Rcorona, that is, the colour temperature
corrected black body spectrum (here called the outer disc emis-sion) at each radius could be in principle convolved with relconv at that radius, and integrated from Rcorona to Rout. However, this
would be extremely time-consuming to calculate. Therefore, we used the fact that most of the outer disc emission arises from radii less than twice that of its innermost radius, that is, from Rcoronato 2 Rcorona(seeDone et al. 2013). Indeed, at much larger
disc radii far from the black hole, the relativistic correction to optxagnf are largely negligible.
The optxconv model can be summarised as: relconv [Rin=Rcorona;Rout=2Rcorona]⊗optxagnf(outer
disc)+ relconv[Rin=RISCO;Rout=Rcorona]⊗optxagnf(warm
and hot Comptonisation).
3.3. Relativistic reflection modelling: the reflcomp model The 2013 and 2014 X-ray broad-band spectra are domi-nated by warm and hot Comptonisation (Matt et al. 2014;
Porquet et al. 2018), nonetheless in 2014 an additionnal mild
relativistic reflection component is still required (Nardini et al. 2016;Porquet et al. 2018). Its low degree of relativistic smearing indicates that this emission only arises from a few tens of gravi-tational radii rather than closer to the ISCO. However, this reflec-tion component becomes non negligible above about 10 keV and must be included in the spectral fits for an accurate determina-tion of the bolometric luminosity (Eq. (2)). Even if no signif-icant relativistic reflection component is reported for the 2013 February 18 observation (Matt et al. 2014), we included one for self-consistency, and checked for any possible contribution.
The relativistic reflection component, hereafter called reflcomp, was calculated using the following model: relconv⊗xilconv⊗optxagnf.
The xilconv convolution model (Done & Gierli´nski 2006;
Kolehmainen et al. 2011) combines an ionised disc table model from the xillver model (Garcia & Kallman 2010) with the
Magdziarz & Zdziarski(1995) Compton reflection code. There-fore, it allows us to use the optxagnf (Comptonisation) emission as the incident spectrum for the reflection component, that is, xilconv⊗optxagnf. In order to account for relativistic effects, we also convolved it with the relconv model.
The xilconv model is characterised by the following parameters:
– the reflection fraction: R;
– the iron abundance relative to the solar value
(Grevesse & Sauval 1998): AFe. Here, we fixed it to
unity, but if let free to vary it has only a marginal impact on the fit results;
– the ionisation parameter (erg cm s−1, in log units) at the sur-face of the disc (that is, the ratio of the X-ray flux to the gas density): log ξ;
– the high-energy cut-off: Ecut (expressed in keV). Here, its
value was fixed to 300 keV to be consistent with the tem-perature internally set at 100 keV in optxagnf (Sect.3.2) – which is taken as the incident spectrum for the relativistic reflection model – as for a thermal distribution of electrons Ecut∼ 3 kT (e.g.Fabian et al. 2015).
The parameters of the relconv and optxagnf models have been already described in Sect.3.2.
In this work, we assumed that the warm optically-thick corona has a full coverage. Therefore, unless otherwise men-tioned we fixed Rin (inner radius of the observed relativistic
reflection) to Rcorona (corona radius) meaning that below Rcorona
any reflection is hidden to the observer by the warm optically-thick corona.
3.4. Modelling of the Fe K complex components from the broad line region (BLR)
In Nardini et al. (2016), from modelling the 2014 Chandra HETG observation of Ark 120, we resolved the core of the Fe Kα line, where its velocity width (FW H M ∼ 4700 km s−1) was
found to be consistent with the broad Hβ line in the optical spectrum. Thus, the narrow neutral core of the Fe Kα emis-sion is assumed to be associated with the optical BLR rather than the torus, which may also be the case for any ionised emis-sion from Fe XXVI Lyα. Therefore, throughout this work we took into account the contribution from the BLR emission to the Fe K complex using three Gaussian lines (as inPorquet et al. 2018): the Fe KαBLR (E fixed at 6.40 keV) plus its associated
Fe KβBLR line (E fixed at 7.05 keV), and the H-like iron line
(E fixed at 6.97 keV). The normalisation of Fe KβBLRwas set to
0.135 times that of Fe KαBLR (Palmeri et al. 2003). The widths
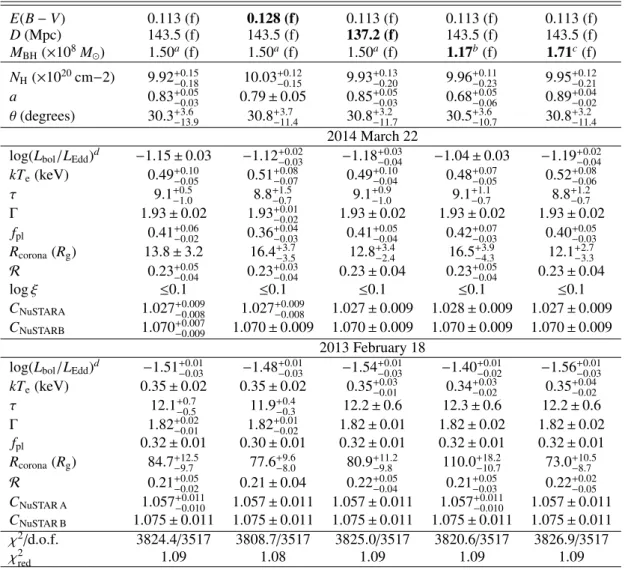
Table 3. Simultaneous SED (from optical to hard X-rays) fitting of both 2014 March 22 and 2013 February 18 observations with the model redden×tbnew× {optxconv + re f lcomp + 3 × zgaussian(BLR)} described in Sect.3.
E(B − V) 0.113 (f) 0.128 (f) 0.113 (f) 0.113 (f) 0.113 (f) D(Mpc) 143.5 (f) 143.5 (f) 137.2 (f) 143.5 (f) 143.5 (f) MBH(×108M ) 1.50a(f) 1.50a(f) 1.50a(f) 1.17b(f) 1.71c(f) NH(×1020cm−2) 9.92+0.15−0.18 10.03−0.15+0.12 9.93+0.13−0.20 9.96+0.11−0.23 9.95+0.12−0.21 a 0.83+0.05−0.03 0.79 ± 0.05 0.85+0.05−0.03 0.68+0.05−0.06 0.89+0.04−0.02 θ (degrees) 30.3+3.6−13.9 30.8+3.7−11.4 30.8+3.2−11.7 30.5+3.6−10.7 30.8+3.2−11.4 2014 March 22
log(Lbol/LEdd)d −1.15 ± 0.03 −1.12+0.02−0.03 −1.18+0.03−0.04 −1.04 ± 0.03 −1.19+0.02−0.04
kTe(keV) 0.49+0.10−0.05 0.51+0.08−0.07 0.49+0.10−0.04 0.48+0.07−0.05 0.52+0.08−0.06 τ 9.1+0.5−1.0 8.8+1.5−0.7 9.1+0.9−1.0 9.1+1.1−0.7 8.8+1.2−0.7 Γ 1.93 ± 0.02 1.93+0.01−0.02 1.93 ± 0.02 1.93 ± 0.02 1.93 ± 0.02 fpl 0.41+0.06−0.02 0.36+0.04−0.03 0.41+0.05−0.04 0.42+0.07−0.03 0.40+0.05−0.03 Rcorona(Rg) 13.8 ± 3.2 16.4+3.7−3.5 12.8+3.4−2.4 16.5+3.9−4.3 12.1+2.7−3.3 R 0.23+0.05−0.04 0.23+0.03−0.04 0.23 ± 0.04 0.23+0.05−0.04 0.23 ± 0.04 log ξ ≤0.1 ≤0.1 ≤0.1 ≤0.1 ≤0.1 CNuSTARA 1.027+0.009−0.008 1.027+0.009−0.008 1.027 ± 0.009 1.028 ± 0.009 1.027 ± 0.009 CNuSTARB 1.070+0.007−0.009 1.070 ± 0.009 1.070 ± 0.009 1.070 ± 0.009 1.070 ± 0.009 2013 February 18
log(Lbol/LEdd)d −1.51+0.01−0.03 −1.48+0.01−0.03 −1.54+0.01−0.03 −1.40+0.01−0.02 −1.56+0.01−0.03
kTe(keV) 0.35 ± 0.02 0.35 ± 0.02 0.35+0.03−0.01 0.34+0.03−0.02 0.35+0.04−0.02 τ 12.1+0.7−0.5 11.9+0.4−0.3 12.2 ± 0.6 12.3 ± 0.6 12.2 ± 0.6 Γ 1.82+0.02−0.01 1.82+0.01−0.02 1.82 ± 0.01 1.82 ± 0.02 1.82 ± 0.02 fpl 0.32 ± 0.01 0.30 ± 0.01 0.32 ± 0.01 0.32 ± 0.01 0.32 ± 0.01 Rcorona(Rg) 84.7+12.5−9.7 77.6−8.0+9.6 80.9+11.2−9.8 110.0+18.2−10.7 73.0+10.5−8.7 R 0.21+0.05−0.02 0.21 ± 0.04 0.22+0.05−0.04 0.21+0.05−0.03 0.22+0.02−0.05 CNuSTAR A 1.057+0.011−0.010 1.057 ± 0.011 1.057 ± 0.011 1.057+0.011−0.010 1.057 ± 0.011 CNuSTAR B 1.075 ± 0.011 1.075 ± 0.011 1.075 ± 0.011 1.075 ± 0.011 1.075 ± 0.011 χ2/d.o.f. 3824.4/3517 3808.7/3517 3825.0/3517 3820.6/3517 3826.9/3517 χ2 red 1.09 1.08 1.09 1.09 1.09
Notes. We allow for cross-calibration uncertainties between the two NuSTAR spectra and the simultaneous XMM-Newton/pn spectrum by including in the fit a cross-normalisation constant corresponding to CNuSTAR Aand CNuSTAR Bfor NuSTAR FPMA and FPMB spectra, respectively. The fit with
the default values for E(B − V), the AGN distance, and MBH are reported in Col. 1. The other columns report the fit results when we vary one
assumption from the fixed values (marked in bold) compared to the default values of E(B − V), the AGN distance and MBH. (f) means that the
parameter value is fixed.(a)BH mass from reverberation mapping (Peterson et al. 2004) using the calibration of the M–σ
?relation for AGNs (mean virial factor: h f i= 5.5 ± 1.8) fromOnken et al.(2004).(b)BH mass from reverberation mapping (Peterson et al. 2004) using the calibration of the
M–σ?relation for AGNs based on high-luminosity quasars hosts (mean virial factor: h f i= 4.31 ± 1.05) fromGrier et al.(2013),Bentz & Katz
(2015).(c)BH mass from reverberation mapping (Peterson et al. 2004) using the calibration of the M–σ
?relation for classical bulge galaxies (mean
virial factor: h f i= 6.3±1.5) fromHo & Kim(2014). See Sect.5.1.2for a detailed explanation.(d)The log(L
bol/LEdd) ratio is equal to log( ˙M/ ˙MEdd),
where ˙Mis the absolute accretion rate (see Eq. (1)) and ˙MEddis the Eddington accretion rate. narrow core, that is, 43 eV as determined from the
simultane-ous Chandra/HETG spectrumNardini et al.(2016). These three BLR emission lines are called hereafter “3× zgaussian(BLR)”. 4. Spectral analysis
The xspec v12.9.1p software package (Arnaud 1996) was used for spectral analysis. We used throughout the χ2 minimisa-tion, quoting confidence levels of 90 percent for one interesting parameter (∆χ2= 2.71). Unless stated otherwise, we assumed a reverberation SMBH mass value of 1.50×10⁸M
(Peterson et al.
2004). We adopted a distance11 of 143.5 Mpc inferred from the 11 This distance value is calculated via the NED Cosmology Calculator
(Wright 2006), assuming a flat Universe:http://www.astro.ucla. edu/~wright/CosmoCalc.html
cosmological constants fromPlanck Collaboration XIII(2016), that is, H0= 67.8 km s−1Mpc−1,Ωm= 0.308, and ΩΛ0= 0.692.
All spectra are displayed in the AGN rest-frame. Hereafter, the energy range over which the models are calculated has been extended up to 500 keV and down to 1 eV (B filter band).
Throughout this work, we used the following model (where the components have been described in Sect.3) simultaneously to the SED of both the 2014 March 22 and the 2013 Febru-ary 18 XMM-Newton (OM+ pn) and NuSTAR observations: redden×tbnew×{optxconv + reflcomp +3×zgaussian(BLR)}.
Since the Galactic column density (NH), the disc inclination
angle (θ), and the BH spin (a) are not supposed to vary in a year time-scale, they were tied between both datasets. Moreover, the disc ionisation parameter was also tied between both datasets since its value is similar for 2013 and 2014 observations.
We find a good fit statistic (χ2/d.o.f. = 3824.4/3517, χ2red= 1.09), the best fit parameters of this model are listed in Table3
(left-hand column). However, some deviations are found in the hardest energy part of both X-ray spectra (Fig. 6, top panel). In optxagnf the temperature of the hot component is not a free parameter since internally fixed to 100 keV (see Sect.3.2). The best-fit temperature may vary from this value during these 2014 and 2013 observations. Indeed,Marinucci et al.(2019), using a nthcomp component (as used in optxagnf and optxconv models) for the hot corona find kTe≥ 40 keV for the 2013 dataset and
155+350−55 keV for the 2014 dataset. However, these deviations have a very marginal impact on the determination of the bolometric luminosity and then on the inferred spin value found in this work. There is also a deviation of the B band flux for 2014 that may be due to an overestimation of the true galaxy host contribution at this wavelength.
For the 2014 observation, we infer temperature and optical depth values for the warm Comptonisation (producing part of the soft excess) that are similar to those found inPorquet et al.
(2018), where a simplified modelling with the comptt model has been used. It is worth pointing out, that during this 2014 observation, both the flux and photon index correspond to the “high-flux spectrum” found for Ark 120 from a Swift monitor-ing (Gliozzi et al. 2017; Lobban et al. 2018), as illustrated in Fig.1. The optically-thick corona extension is rather moderate with Rcoronaof about 14 Rg. We infer an accretion rate consistent
with the one inferred from the ∼ six-month Swift monitoring data of Ark 120 (Buisson et al. 2017).
We find the overall observed luminosity requires a spin value of 0.83+0.05−0.03 which is remarkably well constrained. Since rela-tivistic reflection component (reflcomp) is only observed beyond about 14 Rgin 2014, the spin constraint is driven by the optxconv
SED modelling, however the disc inclination – that is an impor-tant variable to determine the accretion rate (see Eq. (1)) – is well constrained thanks to the mildly relativistic reflection compo-nent present during the 2014 observation. Therefore, this shows that in order to obtain via this method a good constraint on the spin value, the presence of a relativistic reflection component is needed in order to measure the disc inclination. Hence, if we consider the 2013 data in isolation, we are unable to constrain the spin value, due to the lack of any disc relativistic reflection com-ponent (also see Matt et al. 2014). We notice that the inferred value of the accretion disc inclination (θ ∼ 30◦) is similar to that
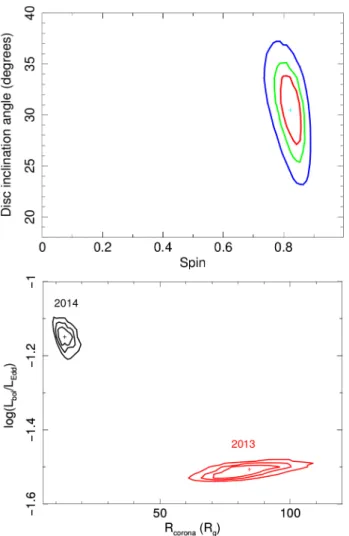
of the host galaxy (that is, 26◦;Nordgren et al. 1995). Figure7
displays the 2D contour plots of the spin versus the disc inclina-tion angle (top panel).
We find that the temperature of the warm optically-thick corona has slightly increased with statistical signifi-cance of about 1.8σ between 2013 and 2014 (see Table 3, Col. 1), corresponding to unabsorbed 0.3–2 keV fluxes of 2.58 × 10⁻¹¹erg cm−2s−1 and 5.42 × 10⁻¹¹erg cm−2s−1, respec-tively. Moreover, the photon index of the hot optically-thin corona has softened (by about 3.9σ) between the 2013 (Γ = 1.82+0.02−0.01) and 2014 (Γ = 1.93 ± 0.02) observations, cor-responding to 2–79 keV flux of 7.28×10⁻¹¹erg cm−2s−1 and
1.03×10⁻¹⁰erg cm−2s−1, respectively. This again confirms
pre-vious results (Matt et al. 2014;Gliozzi et al. 2017;Lobban et al. 2018) where a “softer when brighter” behaviour for Ark 120 was reported.
This disc-corona model implies that the radius of the (warm and hot) corona (Rcorona) has significantly decreased (with a
statistical significance of about 5.5σ) between the 2013 and 2014 observations, from 85+12.5−9.7 to 14 ± 3 Rg. Figure7 (bottom
panel) displays the 2D contour plots of Lbol/LEddversus Rcorona
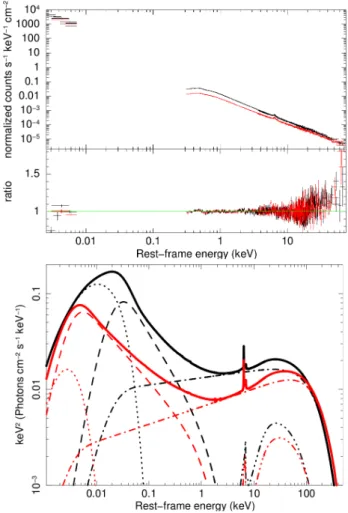
Fig. 6. Simultaneous fit of the Ark 120 SED (XMM-Newton/OM/pn
and NuSTAR) spectra of Ark 120 (AGN rest-frame) obtained on 2014 March 22 and on 2013 February 18. The 2014 and 2013 observations are displayed in black and red, respectively. Top panel: spectra and data/model. Bottom panel: intrinsic (that is, corrected for reddening and Galactic absorption) SED and the corresponding model components. Continuous curves: total SED. Dotted curves: outer disc emission. Dashed curved: warm optically-thick Comptonisation component (soft excess). Dotted-dashed curves: hot Comptonisation component (hard energy tail). 3-dotted-dashed curves: relativistic reflection component. For clarity purposes, the three BLR Gaussian line components are not displayed.
(expressed in Rg) found for the 2014 observation (high-flux state,
in black) and for the 2013 observation (low-flux state, in red). Consequently, the decreasing inner radius of the observed rela-tivistic reflection can explain the broader Fe K profile in 2014, while in 2013 the more extended warm optically-thick corona hid most of the relativistic reflection from the accretion disc, implying a smaller and narrower Fe K line. However, in contra-diction with the expected viscous disc time-scale, we infer from the fit a significant increase in mass accretion rate through the disc from Lbol/LEdd ∼ 0.03 (2013) to 0.07 (2014) in only one
year. This issue is discussed in Sect.5.2.
Figure6(bottom panel) displays the different intrinsic (cor-rected for both Galactic reddenning and absorption) SED for both the 2013 (in red) and 2014 (in black) observations. The intrinsic luminosities from optical to hard X-rays are 1.07 × 1045erg s−1and 2.42 × 1045erg s−1, respectively. The outer disc
emission (dotted curves) in 2014 (in black) is much stronger and peaks at a higher energy than in 2013 (in red) due to a much smaller inner radius (that is, 14 Rgand 85 Rgin 2014 and 2013,
Fig. 7.2D contour plots (at the 68%, 90% and 99% confidence levels) from the simultaneous fit of the 2013 and 2014 observations. Top panel: disc inclination angle versus spin. Bottom panel: log(Lbol/LEdd) versus
Rcorona(expressed in Rg) found for the 2014 observation (high-flux state,
in black) and for the 2013 observation (low-flux state, in red).
respectively). The UV band flux is significantly higher in 2014 than in 2013, as for example by a factor of about 50% for the UVW2 filter (Lobban et al. 2018; see also Table2). This higher UV flux likely drives the requirement in the SED model for a lower inner disc radius (Rcorona) in 2014. The warm
optically-thick Comptonisation components (dashed curves) also differ significantly between the two observations with different peak energies, but nonetheless are the dominant process in both obser-vations in the soft X-ray band below 1 keV. The hot Compton-isation component is much steeper in 2014 when the source is brighter as mentioned above, but becomes similar to the 2013 one above about 100 keV.
In order to assess the impact on the spin value of the hypoth-esis of a full covering optically-thick corona, we relaxed the assumption where Rin is tied to Rcorona. The inferred spin value
of 0.86+0.02−0.01is slightly higher than the spin value found assum-ing a full coverassum-ing warm optically-thick corona (that is, Rintied
to Rcorona), but still compatible within the error bars. For the
2014 observation, Rcorona and Rin are found to be similar with
Rcorona = 12.0+2.7−3.1Rg and Rin = 13.9+4.5−3.8Rg, while for the 2013
observation the two values differ significantly with Rcorona =
77.3+11.6−8.5 Rg and Rin = 14.2+10.0−3.7 Rg (χ2/d.o.f. = 3809.6/3515).
For the 2013 observation, this suggests that beyond 14 Rgsome
contribution of the reflection off the disc is observed and that the
optically-thick corona may be patchy above this radius. This would be consistent with the rapid variability of the FeK emission complex, as discussed in Nardini et al. (2016). Alternatively, the reflection continuum from more distant mate-rial (e.g. the outer disc, dense BLR clouds or the inner torus) may also become more important in the lower flux 2013 observation.
5. Discussion
5.1. Impacts of the assumed fixed parameter values
The disc-Comptonisation efficiency method using optx-agnf/optxconv has been applied to some other AGN (Done et al.
2012, 2013; Done & Jin 2016) but the spin value was either fixed or almost unconstrained. Indeed, this method requires a rather precise knowledge of: the BH mass, the AGN distance and the accretion disc inclination angle along the line of sight. Therefore, in practice, the uncertainties in the spin estimates are dominated by their systematic uncertainties. As previously mentioned in Sect. 4, the disc inclination angle (θ ∼30◦) is
well determined here thanks to the mildly relativistic reflection component observed in the 2014 observation, and is found to be similar to that of the host galaxy (that is, 26◦; Nordgren et al. 1995). Therefore, we now investigate in this section the impact of the assumed values of the fixed parameters: E(B − V), the AGN distance, and the BH mass.
5.1.1. Impact of the assumed E(B − V) and of the AGN distance values
We first investigated how the fit measurement depends on the assumption on the values of the Galactic extinction (E(B − V)), and of the AGN distance. We allowed each of these to be free sequentially, and compared the inferred spin value with that found in the previous section.
We assumed E(B − V) = 0.128 (instead of 0.113) which corresponds to the original value from Schlegel et al. (1998) without the recalibration performed by Schlafly & Finkbeiner
(2011). We find a slightly lower value of the spin (0.79 ± 0.05, Table3, Col. 2) compared to that found previously with E(B − V) = 0.113 (0.83+0.05−0.03, Table 3, Col. 1), but still compatible within the error bars. Indeed, for a given observed optical-UV luminosity a higher reddening along the line of sight implies a higher intrinsic luminosity, then a larger accretion rate (Eq. (1)) and at last a smaller accretion efficiency (Eq. (2)).
We then evaluated the impact on the fit results with a dif-ferent AGN distance of D = 137.2 Mpc (instead of 143.5 Mpc) corresponding to the distance assuming the older cosmologi-cal constants from the five-year WMAP (Spergel et al. 2003) where the corresponding cosmological constants are H0 =
71 km s−1Mpc−1, andΩ
Λ0 = 0.73. We find a negligible impact
on the parameters fit compared to the reference model (Table3, Col. 3).
5.1.2. Black hole mass value
Ark 120 is one of the about 60 AGN (Bentz & Katz 2015) for which the BH mass has been determined via reverberation map-ping (Blandford & McKee 1982;Peterson 1993), which is one of the most reliable and direct methods to measure it in AGN (e.g.
Peterson et al. 2004;Peterson 2014, and references therein). This method is based on the response of the broad emis-sion lines of the BLR to changes in the continuum. The virial BH mass is then estimated as f (∆V2R
the line width, RBLR is the reverberation radius, and G is the
Gravitational constant. The quantity in brackets is called the “virial product” and is determined by two directly observable parameters (∆V and RBLR). f is a dimensionless factor – often
called the “virial factor” – to take into account the unknown BLR properties (structure, geometry, kinematics and inclination with respect to the observer) and can be different from object to object. A mean f , h f i, value is currently determined via the MBH–σ∗ relationship assuming that it is the same for quiescent
and active galaxies (Ferrarese & Merritt 2000; Gebhardt et al. 2000; Woo et al. 2013), and by normalising the reverberation mapped AGN to this relation (see Peterson et al. 2004 for a detailed explanation). However, this h f i quantity is not straight-forward to infer since it may, for example, depend on the bulge classification and/or on the presence of bars (e.g. Ho & Kim 2014; Graham et al. 2011), but see Graham(2014) on caveats about bulge classification. The estimated values of h f i broadly range from about 4 and 6 (e.g. Onken et al. 2004; Shen et al. 2008;Woo et al. 2010,2013;Park et al. 2012;Grier et al. 2013;
McConnell & Ma 2013; Ho & Kim 2014; Batiste et al. 2017). So we now consider the minimum and maximum values of h f i reported in the literature since the last few years. Ho & Kim
(2014) find h f i = 6.3 ± 1.5 for classical bulge galaxies such as Ark 120, though Batiste et al. (2017) find that their best-fit relationship is insensitive to galaxy morphology. Alternatively,
Grier et al. (2013) find a smaller mean virial factor with h f i = 4.31 ± 1.05. This is the default value taken for the calcula-tion of the BH mass in “The AGN Black Hole Mass Database” (Bentz & Katz 2015)12, using the calibration of the M
BH–σ?
relation for AGNs based on high-luminosity quasars hosts. The commonly used BH mass in the literature for Ark 120 is 1.50 × 10⁸M
. This is calculated from the virial product of
2.72 × 10⁷M determined byPeterson et al.(2004), and
assum-ing the viral factor of 5.5 ± 1.8 from Onken et al. (2004; see Table 6 inPeterson et al. 2004). So we now appraise the impact on the inferred spin value still based on the virial product value from Peterson et al. (2004) but using the lowest and highest virial product values as discussed above, that is, h f i= 4.31±1.05 (Grier et al. 2013) and h f i= 6.3 ± 1.5 (Ho & Kim 2014). These values would correspond to BH masses of 1.17 × 10⁸M and
1.71 × 10⁸M
, respectively.
As reported in Table3, the value of the BH mass has the most important impact on the inferred spin value, compared to the E(B − V) and AGN distance values for which the impact is much less or even marginal. We find a spin value of 0.68+0.05−0.06and 0.89+0.04−0.03for h f i= 4.31 ± 1.05 and h f i = 6.3 ± 1.5, respectively. The higher the BH mass, the higher the BH spin value. Indeed, for a given observed Lopt−UV, increasing/decreasing MBHleads
to a lower/higher ˙Mvalue (Eq. (1)). Therefore, to reproduce the overall Lbol a higher/lower efficiency (η) is required (Eq. (2))
which corresponds to a higher/smaller BH spin value.
It is noteworthy that applying a general relativistic accretion disc corona model – but excluding the soft ray data (soft X-ray excess) – to five higher accretion rate AGN (0.3. ˙M. 0.5),
You et al.(2016) show that the spin can be well constrained if the mass measurement is known to within 50% accuracy (see alsoCzerny et al. 2011;Done et al. 2013). Here, considering the lowest and highest BH masses for Ark 120 as determined above, this correspond to an accuracy of the BH value compared to the reference one of 22% and 14%, respectively.
Other direct methods to determine the mass exist and have been applied to Ark 120. Recently,Denissyuk et al.(2015) 12 http://www.astro.gsu.edu/AGNmass/
used the radial velocities of emission features to infer a BH mass for Ark 120 of 1.675 ± 0.028 × 10⁸M
, similar to
that found by Peterson et al. (2004) and Ho & Kim (2015). Another method is based on polarisation of the broad emis-sion lines (e.g.Afanasiev & Popovi´c 2015;Songsheng & Wang 2018; Savi´c et al. 2018), and has been applied to Ark 120 by Afanasiev & Popovi´c (2015). The inferred a BH mass of 1.04+1.38−0.58× 10⁸M that is compatible within its error bars with
the values used in this work.
Finally, we estimate from the SED shape the required BH mass that would correspond to a non-rotating BH (a = 0) or a maximally rotating BH (a = 0.998). We find MBH =
5.82+1.33−0.96 × 10⁷M
( χ2/d.o.f. = 3820.3/3517), and MBH =
3.34+0.07−0.26 × 10⁸M
( χ2/d.o.f. = 3850.7/3517), respectively.
These would correspond, respectively, to mean virial factors of about 2.1 and 12.3 which are very discrepant from the mean values published during the last few years. So, unless the indi-vidual virial factor for Ark 120 strongly differs from the mean value reported for AGN, these two “extreme” solutions appear unlikely. Therefore, an intermediate spin value of about 0.7–0.9 is strongly favoured for Ark 120.
5.2. Deviations from Novikov-Thorne thin disc?
As shown by general relativistic magnetohydrodynamic (GRMHD) simulations of accretion onto stellar BHs, contrary to the basic assumptions of the thin disc model ofNovikov & Thorne
(1973, hereafter NT), there can be significant magnetic stress throughout the plunging region. This means that additional dissipation and radiation can be expected. However, as shown by Kulkarni et al. (2011) for an accretion rate of 0.1 times Eddington and an accretion disc inclination angle of 30◦, that
is, similar to the values found for Ark 120, the discrepancies on the inferred spin values between calculations from GRMHD simulations and a NT disc assumption are only about 0.007 and 0.02 for spin values of 0.9 and 0.7, respectively (see also,
Penna et al. 2010;Noble et al. 2011;Penna et al. 2012;Zhu et al. 2012; Sa¸owski 2016). This would mean that for objects with both low-to-moderate accretion rates and inclination angles, as Ark 120, such systematic error is marginal (and much smaller than the error bars from spectral measurements), and that the NT disc theory is adequate and can be safely applied.
However, for the Ark 120 the warm and hot Comptonisa-tion components are dominant in the SED. Therefore, the hot corona in particular may well have significant scale height, espe-cially during the 2013 low-flux state observation that would correspond to a low accretion rate (L/LEdd) of about 0.03 and
may be in form of a hot inner flow with large scale height (Kubota & Done 2018, see their Fig. 2 for the disc-corona scheme). This could mean that the flow has some pressure sup-port so is sub-Keplerian, and then that advection is imsup-portant as a cooling mechanism, which acts to suppress η below that expected from a thin disc (Narayan & Yi 1995). Therefore, ded-icated calculations are required to determine possible deviations from the NT model (and then ultimately on spin measurements) for moderate accretion rate AGN for which warm and hot Comp-tonisation are the dominant processes. However, it is notewor-thy thatYou et al.(2016) from their general relativistic accretion disc-corona model find that for a BH mass of 108M
and spin
of 0.9 the disc thickness (H/R) is much less than 0.1 (see their Fig. 13) for an accretion rate value of about 0.08 of Eddington, that is, similar to that of Ark 120 in 2014.
Another clear difference for Ark 120 with the NT thin disc predictions is the variability. From the best simultaneous