EUROPEAN ORGANISATION FOR NUCLEAR RESEARCH (CERN)
Submitted to: JHEP CERN-EP-2021-041
8th April 2021
A search for the decays of stopped long-lived
particles at
√
𝒔 = 13 TeV with the ATLAS detector
The ATLAS Collaboration
A search for long-lived particles, which have come to rest within the ATLAS detector, is presented. The subsequent decays of these long-lived particles can produce high-momentum jets, resulting in large out-of-time energy deposits in the ATLAS calorimeters. These decays are detected using data collected during periods in the LHC bunch structure when collisions are absent. The analysed dataset is composed of events from proton–proton collisions produced by the Large Hadron Collider at a centre-of-mass energy of
√
𝑠= 13 TeV and recorded by the
ATLAS experiment during 2017 and 2018. The dataset used for this search corresponds to a total live time of 579 hours. The results of this search are used to derive lower limits on
the mass of gluino 𝑅-hadrons, assuming a branching fraction B ( ˜𝑔→ 𝑞 ¯𝑞 ˜𝜒0
1) = 100%, with
masses of up to 1.4 TeV excluded for gluino lifetimes of 10−5to 103s.
© 2021 CERN for the benefit of the ATLAS Collaboration.
Reproduction of this article or parts of it is allowed as specified in the CC-BY-4.0 license.
1 Introduction
This paper presents a search for long-lived particles which have come to rest within the ATLAS calorimeters and decay at a later time when no proton–proton (𝑝 𝑝) collisions occur.
Although absent in the Standard Model (SM), exotic metastable particles are featured in many
beyond-the-SM (Bbeyond-the-SM) theories. These include R-parity-conserving supersymmetry (SUSY) [1–7] models such as
split-SUSY [8,9] and gauge-mediated SUSY breaking [10–12], as well as other scenarios such as universal
extra dimensions [13,14]. In the example of split-SUSY, it is assumed that the naturalness problem is
solved via a small amount of fine-tuning, and gauge coupling unification and dark matter are used to guide the theory. Here, SUSY-breaking can occur at a very high energy scale, leading to correspondingly heavy squarks and sleptons. This results in a suppression of gluino decay via a heavy off-shell squark, creating
the possibility for the gluino to acquire a non-negligible mean proper lifetime 𝜏 ( ˜𝑔).
If long-lived gluinos are produced by proton collisions at the Large Hadron Collider (LHC), these strongly produced SUSY particles would hadronise with SM quarks and gluons, forming new composite states
known as 𝑅-hadrons [1]. This scenario was chosen as the benchmark for this search. The constituent
gluino or squark can be regarded as a heavy particle surrounded by a cloud of interacting, coloured SM particles. As the 𝑅-hadron traverses the detector it interacts with the detector material via the exchange of constituent partons, thereby altering its composition. During this process the 𝑅-hadron can flip between neutral, charged or even doubly charged states. Since in most models the lightest 𝑅-baryon state is
charge neutral [15], a significant fraction of 𝑅-hadrons that exit the ATLAS calorimeter would be charge
neutral. Detector-stable 𝑅-hadrons are therefore likely to not leave charged tracks in the muon spectrometer system.
Assuming that the gluinos are produced near threshold at the LHC, the 𝑅-hadrons they form are expected to be slow-moving, and some fraction will lose sufficient momentum while traversing the detector to come to rest. In such cases a stopped gluino could decay significantly later than the bunch crossing in which
it was produced, depending on 𝜏 ( ˜𝑔), leaving a significant energy deposit within the ATLAS calorimeter
system.
This search makes use of data collected in so-called empty bunch crossings, where the proton buckets in the crossing beams are unfilled, providing a clean environment in which to identify these delayed decays. This
approach provides sensitivity to gluino lifetimes across several orders of magnitude, in the range of 10−5to
103s. In the absence of proton collisions, events containing muons from cosmic rays or the interaction
of beam protons with upstream collimators, residual gas within the beam pipe, or the beam pipe itself, become the dominant background.
Similar searches have been performed previously by the ATLAS and CMS collaborations at √
𝑠 = 7, 8
and 13 TeV [16–21]. This analysis represents the first search for stopped long-lived particles at ATLAS
using √
𝑠= 13 TeV 𝑝 𝑝 collision data, with an integrated luminosity of 111 fb−1. The analysis significantly
expands the limits on such signatures given by previous ATLAS analyses, which exclude gluinos with
mass 𝑚 ( ˜𝑔) < 832 GeV for 𝜏( ˜𝑔) from 10 𝜇s to 1000 s. Novel strategies for the estimation of non-collision
background processes have been developed, making use of additional non-collision datasets collected by the ATLAS experiment to derive background templates.
2 ATLAS detector
The ATLAS detector [22] at the LHC covers nearly the entire solid angle around the collision point.1 It
consists of an inner tracking detector surrounded by a thin superconducting solenoid, electromagnetic and hadronic calorimeters, and a muon spectrometer incorporating three large superconducting toroidal magnets.
The inner-detector system is immersed in a 2 T axial magnetic field and provides charged-particle tracking in the range |𝜂| < 2.5. The high-granularity silicon pixel detector covers the vertex region and typically provides four measurements per track, the first hit normally being in the insertable B-layer installed before
Run 2 [23,24]. It is followed by the silicon microstrip tracker, which usually provides eight measurements
per track. These silicon detectors are complemented by the transition radiation tracker (TRT), which enables radially extended track reconstruction up to |𝜂| = 2.0. The TRT also provides electron identification information based on the fraction of hits (typically 30 in total) above a higher energy-deposit threshold corresponding to transition radiation.
The calorimeter system covers the pseudorapidity range |𝜂| < 4.9. Within the region |𝜂| < 3.2,
electromagnetic calorimetry is provided by electromagnetic barrel and endcap high-granularity lead/liquid-argon (LAr) calorimeters, with an additional thin LAr presampler covering |𝜂| < 1.8 to correct for energy loss in material upstream of the calorimeters. Hadronic calorimetry is provided by the steel/scintillator-tile (Tile) calorimeter, segmented into three barrel structures within |𝜂| < 1.7, and two copper/LAr hadronic endcap calorimeters (HEC). The solid angle coverage is completed with forward copper/LAr and tungsten/LAr calorimeter modules optimised for electromagnetic and hadronic measurements respectively.
The muon spectrometer (MS) comprises separate trigger and high-precision tracking chambers measuring the deflection of muons in a magnetic field generated by the superconducting air-core toroids. The field integral of the toroids ranges between 2.0 and 6.0 T m across most of the detector. A set of precision chambers covers the region |𝜂| < 2.7 with three layers of monitored drift tubes (MDTs), complemented by cathode-strip chambers (CSCs) in the forward region, where the background is highest. The muon trigger system covers the range |𝜂| < 2.4 with resistive-plate chambers in the barrel, and thin-gap chambers in the endcap regions. Interesting events are selected to be recorded by the first-level (L1) trigger system implemented in custom hardware, followed by selections made by algorithms implemented in software in
the high-level trigger (HLT) [25]. The L1 trigger accepts events from the 40 MHz bunch crossings at a rate
below 100 kHz, which the HLT reduces in order to record events to disk at about 1 kHz.
3 Dataset and reconstruction
During 𝑝 𝑝 collision data-taking the LHC circulates two counter-rotating proton beams constructed from
bunches of protons (∼1011 protons per bunch). The radio frequency (RF) cavities providing particle
acceleration at the LHC operate at 400 MHz, which corresponds to an RF bucket spacing of 2.5 ns. A group of ten RF buckets are assigned a unique bunch-crossing identifier (BCID) within which only one RF
1ATLAS uses a right-handed coordinate system with its origin at the nominal interaction point (IP) in the centre of the detector and the 𝑧-axis along the beam pipe. The 𝑥-axis points from the IP to the centre of the LHC ring, and the 𝑦-axis points upwards. Cylindrical coordinates (𝑟, 𝜙) are used in the transverse plane, 𝜙 being the azimuthal angle around the 𝑧-axis. The pseudorapidity is defined in terms of the polar angle 𝜃 as 𝜂 = − ln tan(𝜃/2). Angular distance is measured in units of Δ𝑅 ≡√︁(Δ𝜂)2+ (Δ𝜙)2.
bucket can contain a proton bunch, for each beam. Proton bunches are spaced at 25 ns intervals, such that a filled RF bucket is separated from the next by at least 25 ns. There are 3564 available BCIDs in which a filled bunch can reside around the LHC circumference, with each corresponding to a time window of 25 ns. Following LHC injection not all BCIDs contain a filled bunch, with the number of unfilled bunches
depending on the LHC filling scheme. [26]
To identify potential signals in the calorimeter that originate from delayed decays of stopped exotic particles, this analysis makes use of events recorded during empty bunch crossings (BXs), where the ten crossing RF buckets in each beam are unfilled. Events selected for analysis are taken from empty BXs during stable beam periods, when data-taking for physics purposes is underway, and are required to pass standard
data-quality requirements [27]. The use of empty bunches minimises detector activity from collision
events, reducing contamination from SM processes in a bid to identify out-of-time decays. As a result, the main backgrounds for this search are from non-collision sources, which, to leading order, scale with live time as opposed to the integrated luminosity of the proton–proton data-taking campaign. Here ‘live time’ refers to the total amount of time during which the trigger was able to select and accept signal-like events in empty BXs in the
√
𝑠= 13 TeV 𝑝 𝑝 data-taking. In contrast to the background, the number of signal events
in a given dataset approximately scales with both the live time, governing the acceptance of potential signal events, and the integrated luminosity of the 𝑝 𝑝 collisions, which governs their production.
This analysis includes data collected during 2017, with an empty-BX live time of 298 hours, and during 2018, with an empty-BX live time of 281 hours. These are the live times for this analysis after imposing requirements based on beam conditions, detector conditions and data quality. The 2017 dataset corresponds
to an integrated luminosity of 49.0 fb−1of
√
𝑠= 13 TeV 𝑝 𝑝 collisions delivered by the LHC to the ATLAS
experiment, while the 2018 dataset corresponds to 62.1 fb−1. The uncertainty in the 2017 (2018) integrated
luminosity is 2.4% (2.0%) [28], obtained using the LUCID-2 detector [29] for the primary luminosity
measurements. The analysis sensitivity is higher for the 2018 dataset, which has the larger integrated luminosity and a slightly lower live time than the 2017 dataset. The higher live time during 2017 results in a larger contribution from non-collision backgrounds, while the lower integrated luminosity of the 2017 dataset leads to fewer expected signal events. For 2015 and 2016 the even lower integrated luminosities and higher live times reduce the sensitivity of the analysis further, motivating the use of the 2017 and 2018 datasets alone in this search. The exception to this is a single dataset from 2016, taken during a period of time when there were no beams circulating within the LHC machine, which is used to study backgrounds induced by cosmic rays (a background component referred to herein as ‘cosmics’).
3.1 Analysis data samples and triggers
Dedicated triggers are used to select empty-BX events with significant calorimeter activity. For the 2017 data, these triggers require that the empty bunch in each beam is separated from a filled bunch by at least five unfilled BCIDs both before and after. This effectively enforces a 150 ns buffer between the empty BXs considered in this analysis and a collision event. Due to the introduction of additional trigger acceptance, in the 2018 dataset this buffer is reduced to 100 ns before the considered BX, but for BXs following the considered BX the buffer remains at 150 ns. ‘Signal-like’ events forming the search sample for this analysis
are selected in empty BXs by a trigger requiring missing transverse momentum 𝐸Tmiss > 50 GeV and at
least one jet with transverse momentum 𝑝T> 55 GeV and |𝜂| < 2.4 at the HLT. In order to be selected by
this trigger the event must contain at least one jet with 𝑝T >30 GeV at L1. To ensure the trigger is fully
efficient relative to the analysis selection, events selected for analysis are required to contain at least one jet
Table 1: Overview of the data samples used in this analysis. The kinematic requirements at the HLT or L1 trigger that events are required to pass in order to be recorded are indicated under ‘trigger requirements’, with the corresponding requirements enforced at analysis level indicated under ‘offline requirements’. No ‘bunch structure’ is listed for the cosmic sample, since no beam was circulating in the LHC machine while these cosmic data were being collected.
Data sample Bunch Trigger Offline
(purpose) structure requirements requirements
Search sample Empty HLT jet 𝑝T> 55 GeV Leading jet 𝑝T> 90 GeV
HLT 𝐸Tmiss> 50 GeV
HLT jet |𝜂| < 2.4 Leading jet |𝜂| < 2.4
Cosmic sample − L1 jet 𝑝T>12 GeV Leading jet 𝑝T> 90 GeV
Leading jet |𝜂| < 2.4
Beam-induced background sample Unpaired L1 jet 𝑝T>12 GeV or Leading jet 𝑝T> 90 GeV
L1 jet 𝑝T>50 GeV
Leading jet |𝜂| < 2.4
Cavern background sample Empty Random −
Additional datasets are used to study background processes. Cosmic rays can result in energetic muons traversing the detector, which can in turn induce energetic jets in the calorimeters, presenting an important background for this search. To obtain a pure sample of cosmic-ray events free of beam-induced backgrounds (BIB), a cosmic run (taken without beam in the LHC machine) recorded during 2016 provides a cosmic sample. Beam-induced backgrounds in this search arise as a result of stray protons interacting with material upstream from the detector, producing energetic particles that traverse the detector in the horizontal plane. Jets induced by energetic muons produced in these interactions present the other important background process for this search. An additional BIB sample for studying beam-induced backgrounds is taken from unpaired BX data. Here only one of the crossing LHC beams contains a filled bunch (with the corresponding bunch in the other beam remaining unfilled), reducing contributions from beam–beam
collisions. Events are selected from these datasets using a trigger requiring the presence of a jet with 𝑝T
greater than either 12 GeV or 50 GeV at L1. Only a fraction of the total available events are recorded by the
12 GeV trigger, so this trigger is only used to select events in which the highest jet 𝑝Tis under 120 GeV.
The contribution from events selected by this trigger is scaled by the inverse of the corresponding fraction,
to ensure a smooth jet-𝑝Tdistribution when transitioning between events selected using the 12 GeV and
50 GeV L1 trigger (the latter trigger is used to select events in which the highest jet 𝑝Tis ≥120 GeV). An
additional cavern background sample is formed using events recorded by a random trigger, which was active during empty BXs. This is used to provide an unbiased sample from which to derive the amount of noise expected in the ATLAS detector due to effects such as activity from errant neutrons and photons commonly called ‘cavern background’. A summary of the data samples used in this analysis is given in
Table1. The same 𝑝Trequirements are placed on each data sample used in the analysis in order to bring
samples selected using different triggers into alignment. The exception to this is the cavern background sample, where an unbiased sample is obtained by making no kinematic selection.
Figure 1: Event display showing an event from the cosmic sample reconstructed using collision reconstruction (left) and cosmic reconstruction (right) configurations. The red line represents the extrapolated muon path based on the hits induced in the MDTs (blue). For readability, only the MDT chambers with associated hits are shown. A cut-away view of the LAr and Tile calorimeters is included for orientation. By using cosmic reconstruction mode the muon-segment track reconstruction requirements are loosened, increasing the efficiency for identifying muon segments induced by cosmic rays. With collision reconstruction settings, only the lower half of the cosmic-ray muon track is reconstructed, whereas in cosmic reconstruction mode the upper leg is reconstructed as well.
3.2 Data reconstruction
The signal decays targeted by this search would be expected to originate from within the detector material, and be displaced from the interaction point (IP). The decay of a stationary long-lived particle would be isotropic, and so the decay activity would likely not point directly towards or away from the IP, nor would resulting energy deposits necessarily be projective with respect to the expected positions of beam–beam collision vertices. In order to increase the efficiency with which out-of-time and non-pointing signals can be reconstructed, and to increase the identification (and subsequently rejection) efficiency of background
events from cosmic rays, a cosmic reconstruction configuration [30] is applied to reconstruct all data
used in this search. This configuration loosens the pointing and impact parameter requirements on muon
segments [31], such that muon tracks are not required to point towards the IP. Special timing procedures
are applied to cosmic muon reconstruction in the MDT detectors to account for the different timing of the recorded hits relative to the nominal LHC bunch crossing. These modifications increase the efficiency with which the upper muon segments produced by a cosmic-ray muon are reconstructed. This is illustrated
in Figure1, where both the upper and lower muon segments induced by a traversing cosmic-ray muon
are reconstructed when using the cosmic reconstruction mode, but when using a collision reconstruction configuration only the lower segments are reconstructed.
The LAr calorimeter reconstruction method remains unchanged when reconstructing the data in cosmic mode, while the Tile calorimeter reconstruction methods are altered to use an iterative method that more
are employed to reconstruct collision vertices in order to veto contributions from beam–beam collisions.
Jets are reconstructed using the anti-𝑘𝑡 algorithm [33,34] with a radius parameter of 𝑅 = 0.4. Jets are
required to have 𝑝T >20 GeV and reside within |𝜂| < 4.5. Due to low average energy deposition in the
environment studied in this search, jet four-momentum calibration is derived from a sample of collision events with a low number of additional 𝑝 𝑝 interactions per BX, known as pile-up. As such, no pile-up corrections are applied to data collected during empty BXs.
To reject backgrounds, reconstructed track segments in the MS are used in the signal region definitions.
Reconstructed muon segments [35] are required to have at least three hits, except for CSC segments, which
must have at least three 𝜂 hits and three 𝜙 hits. For chambers in which there are two inactive layers, only two
𝜂hits and two 𝜙 hits are necessary. Muon segments with a failed track fit, or that have activity overlapping
with adjacent events, are rejected by including only those segments with a time-of-first-hit between 0 and 750 ns (where 750 ns corresponds to the maximum drift time in the MDTs).
Stand-alone muons [35] are used to select enriched control regions and to reject
cosmic-ray-induced backgrounds in signal-enriched regions within the search sample. Stand-alone muon tracks are formed by requiring at least two matched segments (except in the transition region between the MS barrel and endcap, where a single good-quality segment can be used). Using this configuration, approximately 85% of events selected in the cosmic sample have at least one stand-alone muon reconstructed.
4 Signal models
The results of this search are interpreted in the context of a split-SUSY-inspired simplified model in which
gluinos are produced, forming 𝑅-hadrons, with the gluinos decaying as ˜𝑔→ 𝑞 ¯𝑞 ˜𝜒0
1. Signal samples were
generated with gluino masses 𝑚 ( ˜𝑔) in the range 400 to 1800 GeV. Three different mass scenarios for the
lightest neutralino, ˜𝜒0
1, are considered in order to probe a range of possible kinematic signatures. In one
case the mass of the lightest neutralino 𝑚 ( ˜𝜒0
1) is fixed at 100 GeV, in another more ‘compressed’ scenario
the mass difference Δ𝑚 ≡ 𝑚 ( ˜𝑔) − 𝑚 ( ˜𝜒0
1) is fixed at 100 GeV, and in the third scenario Δ𝑚 = 500 GeV.
The way in which 𝑅-hadrons would interact with matter is not certain, but many of the uncertain aspects do not have a major impact on this analysis. The details of the 𝑅-hadron mass spectrum, the formation of bound states that include gluons, the rehadronisation, and the treatment of heavy flavour and strangeness in the initial and final states, for example, must all be treated with a specific numerical hadronic interaction
model. In this analysis the 𝑅-hadron simulation uses the Regge model [36,37], which makes assumptions
about the mass spectra of the 𝑅-hadron states and their production rates. The precise configuration used in the generation and simulation of the signal samples considered herein follows that documented in
Ref. [15]. The details of the stopping mechanisms and the probability of stopping are also discussed in this
reference.
In the configuration detailed in Ref. [15], a little over half of the produced 𝑅-hadrons are electrically
neutral. This fraction is sensitive to the probability of producing gluino–gluon bound states, since this so-called gluinoball state is electrically neutral. There is only a 10% decrease in 𝑅-hadron stopping rate with increasing gluinoball probability over the full range of probabilities. As such, in contrast to most searches for very long-lived particles, the sensitivity of the analysis presented herein remains robust against variations in the gluinoball probability, being sensitive to both neutral and charged 𝑅-hadron states.
Each decay is locally isotropic as the 𝑅-hadron would be stationary within the detector. The spectator partons in the final 𝑅-hadron do not modify the decay kinematics significantly. Since stopped 𝑅-hadron decays generally occur inside the calorimeter system, the energy from the decay products tends to be deposited near the point of the decay. Jet algorithms subsequently cluster the resulting energy depositions
into one or two high-𝑝Tjets.
As this search is carried out using empty-BX data, signal samples were simulated without pile-up. Any potential impact of residual pile-up on the energy measurement of signal jets is expected to be negligible, since a pile-up jet would have to overlap geometrically with the signal jet in order to contaminate the energy reconstruction. This assumption is supported by signal-jet energy comparisons made using signal samples simulated with and without pile-up, where no significant difference in jet energy was observed in signal events with and without pile-up. Even in this non-collision environment, spurious detector activity as a result of non-collision backgrounds or residual radiation in the ATLAS cavern can occur. Such activity is not modelled in the signal simulation. To account for this effect, simulated signal events are overlaid with
events from the cavern background data sample indicated in Table1. About 92% of these random events
contain muon segment activity, less than 0.5% contain a reconstructed muon track, and less than 0.03% contain a reconstructed jet.
Potential signal decays will be recorded only if the trigger accepts the event. The sensitive time window for the trigger is estimated to be [−10, +15] ns relative to the bunch crossing time, so 𝑅-hadron decays are placed in this time window in simulated event samples. The detector is timed in for particles moving at the speed of light, so that particles from the collision are assigned to detector elements in the same bunch crossing. This requires calorimeter cells further from the interaction point to have a later readout time than those closer to the interaction point. In order to account for this effect, the decay times of the 𝑅-hadrons are offset by the propagation time of a particle traveling at the speed of light from the interaction point to the decay position.
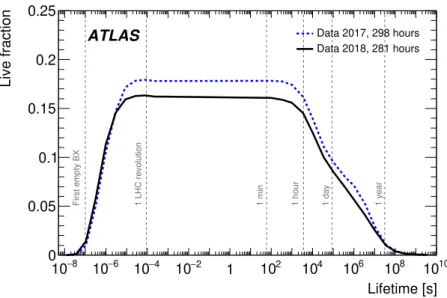
The 𝜏 ( ˜𝑔) dependence of the interpretation is evaluated using the signal live fraction as a function of 𝜏( ˜𝑔).
The signal live fraction defines the temporal acceptance of the trigger for a given signal scenario and
depends on 𝜏 ( ˜𝑔). The live fraction for the empty-BX data considered in this analysis is shown as a function
of 𝜏 ( ˜𝑔) in Figure2. Typically, ATLAS records data continuously during periods of time in which the LHC
is delivering collision data. Each of the datasets taken while ATLAS is continuously recording is referred
to as an ATLAS run [27]. Taking both run and bunch structure into consideration, there are two 𝜏 ( ˜𝑔)
regimes for the live-fraction calculation.
In the short lifetime (𝜏 ( ˜𝑔) < 1 s) regime, 𝑅-hadrons would usually originate, stop, and decay within a single
luminosity block (LB) [27], a data-taking interval during which detector conditions can be considered
stable and that is usually about one minute in length. For these lifetimes a simple algorithm sums the product of the probability for 𝑅-hadrons to be produced in each BCID within the LB and the probability for them to decay in a subsequent empty BCID. Per-BCID instantaneous luminosities are included in this calculation, with the assumption that the instantaneous luminosity for a given BCID is constant within an LB. This probability, multiplied by the trigger-only live fraction, summed and weighted by integrated luminosity over all the LBs in a data-taking period, is the live fraction for a short lifetime gluino. The live
fraction becomes significant for gluino lifetimes of 𝜏 ( ˜𝑔) ∼ 100 ns, corresponding to the minimum time
between an empty BX considered in this analysis and the previous colliding BX. The turn-on is faster for 2018 data, where the inclusion of empty BXs closer to the last filled BX boosts sensitivity in this small 𝜏( ˜𝑔) regime.
Lifetime [s] 8 − 10 10−6 10−4 10−2 1 102 104 106 108 1010 Live fraction 0 0.05 0.1 0.15 0.2 0.25 1 hour
First empty BX 1 LHC revolution 1 min 1 day 1 year
Data 2017, 298 hours Data 2018, 281 hours ATLAS
Figure 2: The live fraction for empty-BX data considered in this analysis as a function of particle mean proper lifetime for data collected during 2017 and 2018. For small lifetimes, per-BCID luminosities and the LHC bunch structure are used to calculate the live fraction until it flattens at ∼100 𝜇s, where the live-time is dominated by the trigger live fraction and the bunch structure. At large lifetimes, the run schedule throughout the year dominates the behavior.
As 𝜏 ( ˜𝑔) approaches a full orbit of the LHC (∼100 𝜇s), the precise structure of the bunches is no longer
relevant, and the signal live fraction is dominated by the fraction of empty BCIDs in the LHC ring and the trigger live fraction. Here the trigger-only live fraction is defined as the fraction of the total physics data-taking time corresponding to the trigger live time. At this point the signal live fraction flattens out, reaching a plateau at the fraction of empty bunches in the machine multiplied by the trigger-only live
fraction. This plateau marks the maximum signal live fraction across the 𝜏 ( ˜𝑔) range probed by this search,
and corresponds to 18% in 2017 and 16% in 2018. The maximum live fraction is higher in 2017 due to there being a larger number of empty BXs in the LHC ring during 2017 data-taking.
For longer lifetimes of the order of a minute, gluinos being produced in one LB and decaying in a subsequent LB is an important effect. The signal live fraction becomes a weighted sum of the probability of the decay being captured in the live time of a subsequent LB over all possible production LBs in a given run. For lifetimes approaching 1 hour, most gluinos will decay either during the same run, or otherwise before the next run begins, with the signal live fraction decreasing as a result of the latter cases. For even longer lifetimes, the number of potentially stopped gluinos present in the detector at any given time depends on the run structure, and the integrated luminosity delivered during previous ATLAS runs becomes more important in accounting for potential gluino production in earlier runs. This search considers the potential production of gluinos during the 2017 and 2018 data-taking periods only, as including the decays of gluinos
produced in preceding years would only have an effect for lifetimes above 109s, where this search has
no significant sensitivity. For these lifetimes the impact on analysis sensitivity is negligible due to the exponential nature of the particle lifetime distribution, and consequently small acceptance in the available 2017–2018 live time for potential signal production pre 2017.
The expected number of signal events falling in the signal regions (SRs) for this search can be calculated as
𝑁SR
events= 𝐿int× 𝜎𝑔˜𝑔˜× 2 × 𝜖SR× 𝑓stopping× (live fraction)
where 𝐿intcorresponds to the total integrated luminosity delivered, 𝜎𝑔˜𝑔˜ is the gluino production
cross-section and 𝜖SR is the signal selection efficiency for the signal regions. For a signal model with
𝑚( ˜𝑔, ˜𝜒0
1) = (1400, 100) GeV, 𝜖
SRranges between 25% and 34% for the signal regions considered in this
search. The stopping fraction 𝑓stoppingcorresponds to the fraction of produced 𝑅-hadrons that are expected
to come to a stop within the detector. For gluino 𝑅-hadrons this fraction varies from 4% to 8% for gluino masses between 0.6 and 2.6 TeV, with the stopping fraction increasing as a function of gluino mass. There is a factor of two to account for the fact that the gluinos are pair-produced. The gluino decays are unlikely to happen simultaneously, hence there are potentially two chances to detect the decay per produced gluino pair. The signal models used in the interpretation of the search results are normalised following this procedure.
5 Event selection
Events used in this analysis must pass the following preselection requirements. In each event the jet with the
highest 𝑝Tmust satisfy a set of cleaning criteria to reject events triggered by detector noise or non-collision
backgrounds. Additionally, this leading jet is required to have 𝑝T >90 GeV and to reside within |𝜂| < 2.4
to be within the geometric acceptance of the search sample trigger.
To avoid selecting events where most of the energy associated with a jet could be produced by localised noise, events are rejected if the leading jet has >90% of its energy associated with a single constituent
cluster or layer within the LAr calorimeter. Potential background from noise bursts [38] in the LAr
calorimeter is rejected via a veto on events where the leading jet’s largest energy deposit is located in the EM endcap calorimeter, where noise bursts originate. Noise-induced jets in the HEC are removed
by imposing the HEC-specific cleaning of the BadLoose selection criteria described in Ref. [39]. These
cleaning requirements reject approximately 20% of events in the signal samples used in this analysis. To effectively remove collision backgrounds from the data used in this analysis, events selected in the search sample, BIB sample and cosmic sample are required to contain no primary vertex. A primary vertex is defined as a reconstructed vertex that is associated with two or more tracks of transverse momentum 𝑝
T >500 MeV. In empty BXs in 2018 (2017), less than 0.0005% (0.00002%) of events passing the search
sample trigger and standard data-quality requirements were found to contain a primary vertex. In contrast, over 80% of events passing the BIB sample triggers contained a primary vertex, which are mostly due to ‘ghost’ collisions (where protons in the filled bunch in one beam collide with de-bunched protons – or
ghost charge – in the nominally empty bunch [40]). There are no events containing a reconstructed primary
vertex in the cosmic sample.
Events that enter the signal regions (SRs) are selected from the search sample, and the leading jet in the
event is required to have 𝑝T > 150 GeV. Two SRs, each divided into three leading-jet 𝑝T ranges, are
defined:
• The central SR (SRC) has an additional requirement that the leading jet reside within |𝜂| < 0.8. These SRs are optimised for the split-SUSY-inspired scenarios targeted by this search, which tend to contain central decays.
• The inclusive SR (SRIncl) accepts all events in which the leading jet resides within |𝜂| < 2.4, corresponding to the acceptance dictated by the trigger. These SRs are included to preserve
acceptance for potential signal scenarios with more forward topologies [41–43].
Events containing a reconstructed muon are rejected from the signal regions to remove events seeded by cosmic-ray-induced jets. Further cosmics rejection is provided by vetoing events in which the leading jet overlaps with a trajectory between two reconstructed muon segments – an indication that the jet is likely induced by a cosmic ray. This is achieved via the use of the 𝛼 variable, which represents the minimum 𝜂–𝜙 distance between the leading jet and a putative cosmic-ray muon (inferred from a combination of upper-and lower-hemisphere muon segments) as it passes through the calorimeter. For cosmic-ray-induced jets, 𝛼 takes on small values, and events are required to have 𝛼 > 0.2 to enter the SRs. In cases where 𝛼 cannot be
defined, events are accepted into the SRs. The construction of 𝛼 is described in detail in Section6.1.
To reject BIB the narrow BIB-jet width in the 𝜙-plane, resulting from the relatively narrow showers
expected from BIB traversing the detector parallel to the beam, is exploited via the use of the 𝑤𝜙variable.
This is defined as 𝑤𝜙= Í 𝑖𝑝T(𝑖) · |Δ𝜙(jet, 𝑖)| Í 𝑖𝑝T(𝑖) ,
where, in the sums, 𝑖 runs over the constituents of the jet and Δ𝜙(jet, 𝑖) is the distance in the 𝜙 dimension between a constituent energy cluster associated with the leading jet in the event and the reconstructed centroid of that jet. While signal events tend to have an isotropic topology, the parallel-to-the-beam jets
from BIB tend to have small 𝑤𝜙values, and events entering the SRs are required to have 𝑤𝜙>0.02. The
characteristics and estimation of BIB are described in detail Section6.2.
The SRs are binned by leading jet 𝑝T, with bin boundaries defining the ranges 150 < 𝑝T < 300 GeV,
300 < 𝑝T < 500 GeV and 𝑝T > 500 GeV. Each jet 𝑝T bin offers sensitivity to signal scenarios with
different Δ𝑚. The lowest 𝑝Tbin offers sensitivity to scenarios with Δ𝑚 = 100 GeV, while the higher jet-𝑝T
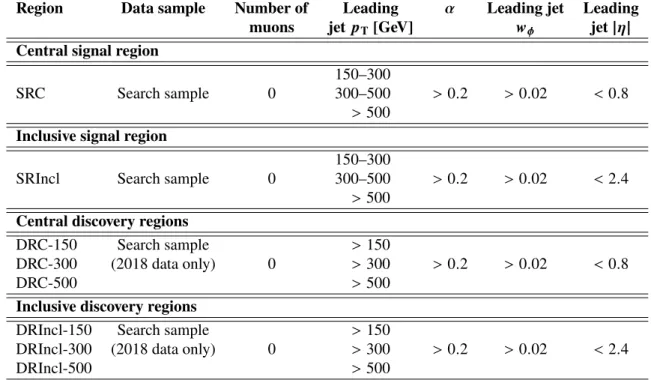
bins offer coverage for scenarios with larger mass splittings. An overview of the signal regions, separated
by jet 𝑝Tbin boundaries, is given in Table2. In order to provide production cross-section upper limits for
the signal models described in Section4, all bins in leading jet 𝑝Tare included in a profile-likelihood [44]
fit. To form six discovery regions (DRs), each SR 𝑝T-bin is made inclusive of larger leading jet 𝑝T These˙
DRs are used individually to probe the existence of BSM physics or to assess model-independent upper limits on the number of possible signal events. Because the sensitivity of the 2018 dataset to generic signal models is expected to dominate, the discovery regions comprise 2018 data only. The six DRs are also
Table 2: Overview of the signal and discovery regions. These regions are divided into two sets; one set imposes an |𝜂| < 0.8 requirement on the leading jet in the event, while the other set accepts leading jets within |𝜂| < 2.4. Events for which 𝛼 cannot be determined are included in the SRs and DRs.
Region Data sample Number of Leading 𝜶 Leading jet Leading
muons jet 𝒑T[GeV] 𝒘𝝓 jet |𝜼|
Central signal region
SRC Search sample 0
150–300
>0.2 >0.02 <0.8 300–500
>500 Inclusive signal region
SRIncl Search sample 0
150–300
>0.2 >0.02 <2.4 300–500
>500 Central discovery regions
DRC-150 Search sample 0 >150 >0.2 >0.02 <0.8 DRC-300 (2018 data only) >300 DRC-500 >500
Inclusive discovery regions DRIncl-150 Search sample
0
>150
>0.2 >0.02 <2.4
DRIncl-300 (2018 data only) >300
DRIncl-500 >500
6 Background estimation
The main backgrounds considered in this analysis are as follows:
• Cosmic rays: Muons from cosmic rays can induce energetic jets in the calorimeter while traversing the detector. The methods used to minimise this background and predict the remaining contribution
to the SRs are discussed in Section6.1.
• Beam-induced backgrounds: Beam protons can interact with upstream collimators, residual gas within the beam pipe, or the beam pipe itself, resulting in energetic muons traversing the detector in the horizontal plane. The methods used to reduce and estimate the extent of these backgrounds are
detailed in Section6.2.
In both the cosmic-ray- and beam-induced backgrounds, the 𝑝Tdistribution of the leading jet falls steeply,
and the background estimation strategy relies on the modelling of the shapes of these distributions. Jet 𝑝T
templates are extracted for both cosmics and BIB in dedicated control regions (CRs). The background
estimation strategy and validation is described in detail in Sections 6.1and 6.2, but the control and
validation regions are outlined below.
To model the cosmics background in the SRs, a ‘cosmic-tag’ selection is applied to data collected in both the search and the BIB samples to construct cosmics-enriched control regions. The BIB and search samples are combined to provide the highest possible number of events in the template construction. A cosmic-tag is enforced by the requirement that events contain at least one central muon (|𝜂| < 1.4) and have 𝛼 < 0.2.
Although the cosmic sample provides a pure sample of cosmic-ray-induced events, the sample size is not
sufficiently large to extract a statistically robust jet-𝑝Ttemplate. Instead, a cosmics CR is defined for each
of the SRs, with a selection otherwise matching that of the SR as closely as possible. These CRs are denoted CRC-cos, corresponding to SRC, and CRIncl-cos, corresponding to SRIncl. The shape of the jet 𝑝
Tdistribution is taken from each cosmics CR and is extrapolated to the SR of interest via a transfer factor
obtained from a cosmic sample, as described in detail in Section6.1. The level of signal contamination in
the 2016 cosmic sample from potential 𝑅-hadron production in earlier 𝑝 𝑝 collision data-taking was found to be negligible.
For BIB, the jet 𝑝Ttemplate is derived from the BIB sample. BIB CRs are constructed with a selection
closely matching that of SRC (to form CRC-bib) and SRCIncl (to form CRIncl-bib), but with the 𝑤𝜙
requirement lowered to 𝑤𝜙> 0.01 to accept more background events. The level of signal contamination in
the BIB CRs for a 1 TeV gluino is found to be negligible. The BIB-jet 𝑝Ttemplates are then normalised in
dedicated normalisation regions (NRs) using search sample data. Each normalisation region has a selection
identical to that of the SR of interest, but requires a leading jet 𝑝Tbetween 90 and 150 GeV. The control
and normalisation region definitions are given in Table3.
Table 3: Overview of the control and normalisation regions used to estimate the contribution of background processes to the SRs. The main requirements that distinguish the control and normalisation regions from the signal regions are indicated in boldface. Events for which 𝛼 cannot be determined are included in the 𝛼 > 0.2 selection CR(Incl/C)-bib and NR(Incl/C)-bib.
Region Data sample Number of Leading 𝜶 Leading jet Leading
muons jet 𝒑T[GeV] 𝒘𝝓 jet |𝜼|
Central control and normalisation regions
CRC-cos Search sample & BIB sample ≥ 1 (|𝜼| < 1.4) >90 < 0.2 >0.02
<0.8
CRC-bib BIB sample 0 >90 >0.2 >0.01
NRC-bib Search sample 0 90–150 >0.2 >0.02
Inclusive control and normalisation regions
CRIncl-cos Search sample & BIB sample ≥ 1 (|𝜼| < 1.4) >90 < 0.2 >0.02
<2.4
CRIncl-bib BIB sample 0 >90 >0.2 >0.01
NRIncl-bib Search sample 0 90–150 >0.2 >0.02
6.1 Cosmic-ray muon background
Events containing cosmic-ray muons can enter into the event selection of this analysis when a traversing muon induces an energetic jet in the calorimeter. This background is dominated by the emission of a highly
energetic bremsstrahlung photon from a high-momentum muon. The 𝑝Tdistribution of cosmic-ray-induced
jets has a longer high-𝑝Ttail than the corresponding distribution of jets from beam-induced backgrounds,
making it the dominant background process in the highest jet-𝑝Trange targeted by this search.
As a cosmic-ray muon traverses the detector from top to bottom it passes through the MS. The presence of reconstructed muon segments in opposite hemispheres of the detector can be an indication of a cosmic-ray muon event, although energetic jets produced in gluino decays could punch through from the calorimeter into the MS, also resulting in reconstructed segments. Spurious muon segments can also occur independently of potential signal decays as a result of cavern background, contributing muon segment activity to potential signal events that is uncorrelated with the signal decays. This makes relying on muon segment information
Figure 3: Example illustration of the construction of the 𝛼 variable. Left: Longitudinal view demonstrating the assumed cosmic-ray muon trajectory for a given pair of muon segments and a leading jet. The location of the calorimeter energy deposition forming this jet is shown as a blue sphere. Middle: Transverse view demonstrating the assumed cosmic-ray muon trajectory for a given pair of muon segments and a leading jet. Right: An 𝜂–𝜙 plane view of the assumed cosmic-ray muon trajectory between a pair of muon segments, and the Δ𝑅 that corresponds to the 𝛼 variable in this example. In this case the 𝛼 value is greater than the size of the jet radius parameter (𝑅 = 0.4).
alone impractical, as it results in decreased signal selection efficiency. The 𝛼 variable uses the relative geometric location of a pair of reconstructed muon segments combined with the location of the leading jet in the event (assumed to be seeded by the same traversing cosmic-ray muon as the muon segments).
This concept is illustrated in Figure3. Here the left and middle panels show a jet positioned within the
calorimeter, near the path of a traversing cosmic-ray muon. The right panel shows how the 𝛼 variable is defined, based on geometric information associated with these objects.
To calculate 𝛼, reconstructed muon segments in an event are grouped into pairs. A pair is formed if the trajectory measured in at least one of the two muon segments points in the direction of the other, with each pair containing one upper- and one lower-hemisphere muon segment. In order to recover inefficiencies due to the MS gap at 𝜂 = 0, the direction vector of each segment is also extrapolated to the opposite side of the detector in 𝜙 to determine whether it crosses the 𝜂 = 0 plane within the radial range otherwise instrumented by the MS. Should this be the case, a ‘dummy’ segment is inserted at that position and used in the calculation of 𝛼, to acknowledge that a traversing cosmic-ray muon could escape through the gap without seeding a muon segment.
For each pair of muon segments in an event, a Δ𝑅 value is calculated for the pair of points where the axis of the leading jet and the 3D straight line connecting the muon segment pair are closest to each other. The
𝛼variable is defined as the minimum of these ‘points of closest approach’ Δ𝑅 values in the event. This is
illustrated in the right panel of Figure3in the 𝜂–𝜙 plane. The points of closest approach must correspond
to a location consistent with being within the volume of the calorimeter. If this is not the case, or if no suitable pair of muon segments is identified, 𝛼 is undefined and the event is not rejected. For events where
the leading jet is induced by a cosmic-ray muon, 𝛼 takes on small values, as shown in Figure4, and events
are rejected from the SRs if they satisfy 𝛼 < 0.2. For signal events, a value of 𝛼 may be defined due to the leakage of hadronic activity out of the calorimeter and the cavern background effects described above.
To estimate the remaining cosmics background expected in the SRs, 𝑝Ttemplates for cosmic-ray-induced
0 0.5 1 1.5 2 2.5 3 α 4 − 10 3 − 10 2 − 10 1 − 10 1 10 Fraction of events Cosmic sample )=(1400,100) GeV 1 0 χ∼ , g ~ m( )=(1400,1300) GeV 1 0 χ∼ , g ~ m( defined un-α ATLAS Data 2016 (11 hours)
Figure 4: The 𝛼 distribution is shown for events passing preselection requirements in the cosmic sample. Example signal models with a gluino mass of 1.4 TeV and mass differences Δ𝑚 = 100 GeV and 1300 GeV are overlaid. In cases where all eligible muon segments reside in one hemisphere of the detector, or where no segments have been reconstructed in the event, 𝛼 cannot be calculated. This is the case for 8% of the events in the cosmic sample, 56% of the events in the signal model with Δ𝑚 = 1300 GeV, and 78% of the events in the signal model with Δ𝑚 = 100 GeV. The first bin represents the events for which 𝛼 cannot be calculated because the imposed requirements are not met. The last bin contains the overflow.
provides a highly pure sample of cosmic-ray events in data, with negligible contamination from BIB
processes and potential signal decays. The shape of the resulting jet 𝑝Ttemplate is validated by comparison
with the same distribution taken directly from the cosmic sample. The shapes of the distributions are consistent within statistical uncertainties.
The cosmic sample is used to derive a transfer factor between the control and signal regions. The same transfer factor is used to extrapolate between the CR and SR for both the inclusive and central SRs, as the differing 𝜂 requirements have no significant impact on the transfer factor. The transfer factor is derived from the |𝜂| < 2.4 selection as follows:
𝐹 transfer = 𝑁cosmic sample events (SRIncl) 𝑁cosmic sample events (CRIncl-cos)
where 𝑁events (SRIncl)cosmic sample and 𝑁events (CRIncl-cos)cosmic sample correspond to the total number of events passing SR- and CR-like
selections, respectively, in the cosmic sample. The 𝑝T template for cosmic-ray-induced jets is first
normalised to the total number of events entering the CR from the search sample. A transfer factor of
0.018 ± 0.006 is then applied to the leading-jet 𝑝T template extracted from the corresponding cosmics
CR. To account for differences in the shape of the jet 𝑝Tdistribution when extrapolating from 𝛼 < 0.2 to
𝛼 >0.2, a loose selection is applied to the cosmic sample used to derive per-jet 𝑝
Tbin weights that can
be used to reweight the jet 𝑝Ttemplate taken from the cosmics CRs when extrapolating to the SRs. The
bin. The normalisation of the template remains constant upon applying these weights, so as to preserve the total expected event counts in the SR. Following this procedure, the expected contribution from cosmics in the relevant SR is obtained.
6.2 Beam-induced background
The primary component of BIB is beam halo, which occurs as a result of beam protons interacting with upstream collimators, residual gas inside the beam pipe, or the beam pipe itself, resulting in energetic muons traversing the detector in the horizontal plane. The contribution from beam–gas interactions inside the length of beam pipe within the detector volume is particularly small in empty BXs, and these events are further reduced by the requirement that there be no reconstructed vertex in selected events. In order for beam halo to contribute to this search, the interactions must take place sufficiently far upstream from the IP to allow such muons to reach relatively large radii in the ATLAS detector, reaching the calorimeters and seeding energetic jets. Owing to bending via the dipole magnets of the LHC, beam-halo muons tend
to arrive in ATLAS in the horizontal plane [45], with the resulting jets being of larger width in 𝜂 than
in 𝜙. The width of BIB-jets in the 𝜙 direction tends to be small, due to the trajectory of the traversing muons being approximately constant in 𝜙 and the fact that the resulting energy deposition is primarily
electromagnetic (yielding narrow showers). This is illustrated in Figure5. A requirement of 𝑤𝜙> 0.02 is
applied to reject BIB in the SRs.
Events from unpaired BXs, where only one of the two counter-rotating beams has a filled bunch, provide a BIB-enriched data sample in which the contribution from cosmic rays is small compared to that in empty-BX data. The relative intensity of BIB as a function of time within the 25 ns BCID time window differs between unpaired- and empty-BX data. In unpaired-BX data the dominant BIB contribution comes from BIB that is in-time with the ‘nominal’ RF bucket, i.e. the 2.5 ns bucket within the filled BCID that
0 0.05 0.1 0.15 0.2 φ Leading jet w 4 − 10 3 − 10 2 − 10 1 − 10 1 10 Fraction of events ATLAS Data 2017-2018 BIB sample )=(1400,100) GeV 1 0 χ∼ , g ~ m( )=(1400,1300) GeV 1 0 χ∼ , g ~ m(
Figure 5: Leading-jet 𝑤𝜙distribution for events passing preselection requirements in the BIB sample. Example
signal models with a gluino mass of 1.4 TeV and a mass difference Δ𝑚 = 100 GeV and 1300 GeV are overlaid. The last bin contains the overflow.
contains the proton bunch. In contrast, BIB in empty-BX data tends to be evenly distributed across all RF buckets, although the production mechanism remains the same. A dedicated systematic uncertainty is applied to the BIB prediction to account for differences in BIB characteristics between empty- and
unpaired-BX data, as described in Section7.
To estimate the contribution from BIB to the SRs, a leading-jet 𝑝Ttemplate is taken from the corresponding
BIB CR, which is constructed using the BIB sample. To facilitate this, the leading-jet 𝑤𝜙requirement
is loosened to >0.01, since the SR 𝑤𝜙 >0.02 cut significantly reduces the size of the BIB sample. The
BIB template obtained in this region is consistent with the distribution obtained using a tighter 𝑤𝜙> 0.02
selection within statistical uncertainties. In order to remove contamination from cosmic-ray-induced events the cosmics background contribution must be estimated and removed from the BIB CRs. This is done
by taking the cosmics template from a cosmics CR-like region, but with a lowered 𝑤𝜙threshold of 0.01,
and following the steps outlined in Section6.1to estimate the cosmics background in the corresponding
BIB CR. The resulting cosmics template is then subtracted from the BIB template to yield a BIB-only
jet-𝑝Ttemplate, which is then normalised in the BIB NR corresponding to the SR of interest. The cosmics
contribution to this normalisation region is first subtracted using the 90–150 GeV jet-𝑝T bins of the
SR cosmics template, derived as described in Section6.1. Since BIB rates and characteristics depend
on machine and beam conditions, and LHC operating conditions differed between 2017 and 2018, this procedure is performed separately for 2017 and 2018 data. The BIB normalisation factors for 2017 data are 0.70 ± 0.06 (SRIncl) and 0.65 ± 0.10 (SRC), while for 2018 data they are 0.55 ± 0.03 (SRIncl) and 0.61 ± 0.06 (SRC).
6.3 Background estimate validation
The background estimation procedures outlined in Sections6.1and 6.2are tested using dedicated validation
regions (VRs). A summary of the kinematic selections used in the validation regions is given in Table4. In
each of these validation regions, the BIB templates are normalised in the 90–150 GeV leading-jet 𝑝Trange.
The BIB normalisation regions used for each VR are also summarised in Table4. Validation regions are
defined for both the leading-jet 𝜂-central and 𝜂-inclusive event selections, and the background estimates are validated separately for 2017 and 2018 data, owing to the different BIB characteristics year-to-year. For brevity, the 2017 and 2018 VRs are combined in the following description.
The 𝛼 VRs (VRIncl-𝛼 and VRC-𝛼) are designed to test the extrapolation and reweighting of the cosmics 𝑝
Ttemplate from the cosmics CRs to 𝛼 > 0.2. The central-muon requirement ensures a region dominated
by cosmic-ray-induced events in order to test this. The BIB VRs (VRIncl-bib and VRC-bib) have an
𝛼requirement identical to that of the SR, but a lower 𝑤𝜙 requirement in order to obtain a data sample
dominated by BIB events to validate the BIB modelling at high 𝛼. The 𝑤𝜙VRs (VRIncl-𝑤𝜙and VRC-𝑤𝜙)
are constructed with the same leading-jet 𝑤𝜙requirement as the SR, but with the 𝛼 requirement inverted.
This results in a region where the modelling of both the cosmics and the BIB can be checked at high
𝑤𝜙. In this region, no reweighting is applied to the cosmics template, as there is no extrapolation over 𝛼.
For VRIncl-𝛼 and VRIncl-𝑤𝜙(VRC-𝛼 and VRC-𝑤𝜙) the cosmics template is extracted from CRIncl-cos
(CRC-cos). For VRIncl-bib (VRC-bib) the 𝑤𝜙selection of CRIncl-cos (CRC-cos) is modified to match
that of the BIB VRs (0.01 < 𝑤𝜙 <0.02). The BIB templates for VRIncl-𝛼 and VRIncl-bib (VRC-𝛼 and
VRC-bib) are taken from CRIncl-bib (CRC-bib), but for VRIncl-𝑤𝜙(VRC-𝑤𝜙) the CRIncl-bib (CRC-bib)
𝛼 requirement is inverted to match that of the 𝑤𝜙 VRs (𝛼 < 0.2). For a 1 TeV gluino the level of
signal contamination in the VRs is <10%. The exceptions to this are the single bins above 500 GeV in VR-𝛼 (<20% for all gluino masses) and VR-bib. In the bin above 500 GeV in VR-bib, potential signal
contamination is <25% for models with a 1.4 TeV gluino and a 100 GeV neutralino, with the signal population decreasing significantly for 1.4 TeV gluino models with smaller mass-splittings. The signal contamination can be up to 100% for models with lower gluino masses and large mass-splittings.
Table 4: Overview of the validation regions and the low-𝑝Tregions used to normalise the BIB templates for the
corresponding validation region. A central set and an inclusive set of these regions are defined to test the background modelling in both SRC and SRIncl. The VRs are also checked separately using data from 2017 and from 2018 to ensure consistent background modelling in both years. The main requirements that distinguish the validation regions from the signal regions, and the normalisation regions from the validation regions, are indicated in boldface. Events for which 𝛼 cannot be determined are included in the 𝛼 > 0.2 selection in VR(Incl/C)-𝛼, VR(Incl/C)-bib and the corresponding NRs.
Region Data Number of Leading 𝜶 Leading jet Leading
sample muons jet 𝒑T[GeV] 𝒘𝝓 jet |𝜼|
Central validation regions VRC-𝛼 Search sample ≥ 1 (|𝜼| < 1.4) >150 >0.2 >0.02 <0.8 VRC-bib 0 >0.2 0.01–0.02 VRC-𝑤𝜙 0 < 0.2 >0.02
Inclusive validation regions VRIncl-𝛼 Search sample ≥ 1 (|𝜼| < 1.4) >150 >0.2 >0.02 <2.4 VRIncl-bib 0 >0.2 0.01–0.02 VRIncl-𝑤𝜙 0 < 0.2 >0.02
Central BIB normalisation regions NRC-𝛼 Search sample ≥ 1 (|𝜂| < 1.4) 90–150 >0.2 >0.02 <0.8 NRC-bib 0 >0.2 0.01–0.02 NRC-𝑤𝜙 0 <0.2 >0.02
Inclusive BIB normalisation regions NRIncl-𝛼 Search sample ≥ 1 (|𝜂| < 1.4) 90–150 >0.2 >0.02 <2.4 NRIncl-bib 0 >0.2 0.01–0.02 NRIncl-𝑤𝜙 0 <0.2 >0.02
The resulting background predictions are compared with the observed data in each of the VRs in Figure6.
0 200 400 600 800 1000 Events / 1 GeV 1 − 10 1 10 2 10 Data Total Background Cosmics BIB Data 2017-2018 (579 hours) φ w VRIncl-ATLAS [GeV] T Leading jet p 0 200 400 600 800 1000 Data / Background 0 0.5 1 1.5 2 0 200 400 600 800 1000 Events / 1 GeV 1 − 10 1 10 2 10 Data Total Background Cosmics BIB Data 2017-2018 (579 hours) φ w VR-ATLAS [GeV] T Leading jet p 0 200 400 600 800 1000 Data / Background 0 0.5 1 1.5 2 0 200 400 600 800 1000 2 − 10 1 − 10 1 10 2 10
Events / 1 GeV Data Total Background Cosmics BIB Data 2017-2018 (579 hours) VRIncl-bib ATLAS 0 200 400 600 800 1000 [GeV] T Leading jet p 0 0.5 1 1.5 2 Data / Background 0 200 400 600 800 1000 2 − 10 1 − 10 1 10 2 10
Events / 1 GeV Data Total Background Cosmics BIB Data 2017-2018 (579 hours) VR-bib ATLAS 0 200 400 600 800 1000 [GeV] T Leading jet p 0 0.5 1 1.5 2 Data / Background 0 200 400 600 800 1000 Events / 1 GeV 1 − 10 1 10 2 10 Data Total Background Cosmics BIB Data 2017-2018 (579 hours) α VRIncl-ATLAS [GeV] T Leading jet p 0 200 400 600 800 1000 Data / Background 0 0.5 1 1.5 2 0 200 400 600 800 1000 Events / 1 GeV 1 − 10 1 10 Data Total Background Cosmics BIB Data 2017-2018 (579 hours) α VR-ATLAS [GeV] T Leading jet p 0 200 400 600 800 1000 Data / Background 0 0.5 1 1.5 2
Figure 6: The predicted leading-jet 𝑝Tdistributions in VR-𝑤𝜙(top), VR-bib (middle) and VR-𝛼 (bottom), with the
data from the 2017–2018 search sample overlaid. Each distribution includes the low-𝑝Tbins corresponding to the
BIB NR associated with the VR. Distributions are shown both for an 𝜂-inclusive selection (left) and for a central (right) selection. The hatched band includes the statistical and systematic uncertainty of the background prediction.
7 Systematic uncertainties
The systematic uncertainties applied to the background estimates and the simulated signal samples are summarised in this section.
For the cosmics background, an uncertainty is assigned to the cosmics transfer factor to account for the limited number of events in the relevant regions in the cosmic sample. An uncertainty is applied to the
reweighting of the 𝑝Tdistribution for the cosmics template, corresponding to 100% of the impact of the
reweighting. An additional 20% uncertainty is applied to account for differences between the shapes of the
leading-jet 𝑝Tdistribution in the cosmic sample and the cosmics CRs.
For the BIB prediction, an uncertainty is assigned to the BIB normalisation factor to account for the limited number of events in the relevant NR. The uncertainties in the cosmics background template used to subtract the cosmics contribution from the BIB template are propagated to the BIB estimation. In order to take into
account differences between the leading-jet 𝑝Tdistributions of BIB-jets in unpaired- and empty-BX data, a
shape uncertainty is derived using the observed shape difference in an inclusive region with 𝛼 > 0.2. This shape uncertainty is treated as uncorrelated between 2017 and 2018 data, owing to the different bunch schemes and sample sizes in the comparison.
The magnitude of each uncertainty contribution relative to the total predicted background in each jet 𝑝T
bin of SRC for 2017 and 2018 data is illustrated in Figure7. The 𝑝T > 500 GeV jet bin in each region
dominates the analysis sensitivity, and the largest uncertainty contribution in this region is due to the shape uncertainties of the cosmics background prediction. This includes the uncertainty due to both the reweighting procedure and the shape comparison with the cosmic sample. Of these contributions, the
reweighting uncertainty is the dominant contributor in this jet 𝑝Trange. Uncertainties associated with
the BIB prediction become more important in the lower jet-𝑝Tbins, where the relative contribution from
BIB to the total background estimate is more significant. For 2017 data, differences in the shape of the
BIB-jet 𝑝Tdistribution when comparing empty- and unpaired-BX data are the largest (second largest)
source of uncertainty for the 300 < 𝑝T <500 GeV (150 < 𝑝T < 300 GeV) jet bin. This is partly due to
beam instabilities within the LHC, which necessitated frequent changes to the LHC filling scheme (and therefore the bunch configuration) during 2017 data-taking operations. The magnitude of the differences
observed between BIB-jet 𝑝Tdistributions in the search and BIB samples in 2017 are consequently larger
than those observed in 2018 data.
For simulated signal samples, uncertainties are applied in order to take into account the non-projective and out-of-time nature of jets resulting from 𝑅-hadron decays. To account for the impact on jet energy
reconstruction of jets arriving out-of-time, an uncertainty is derived from variations in the jet 𝑝Tspectrum
of cosmic-ray-induced jets as a function of jet time-of-arrival. Since the 𝑝T spectrum for these jets should
be independent of time-of-arrival, the variation in 𝑝T as a function of time is taken as a 𝑝T-dependent
uncertainty to account for biases as a result of late or early arrival of the jets relative to the LHC clock.
This procedure results in a 𝑝T-dependent uncertainty, with an impact ranging from 5% to 50% in the
highest jet-𝑝T bin. To account for the impact of jet non-projectivity on the jet energy reconstruction,
the variation in the leading-jet 𝑝T distribution for cosmic-ray events as a function of 𝜙 is used. Since
cosmic-ray muons approach the detector in a downwards direction, by looking at the full detector 𝜙 range all projective possibilities are considered. This results in an uncertainty of up to 12% in the highest
jet-𝑝T bin. For both the timing and the projection uncertainty, the maximum deviation upwards and
downwards from the mean in each 𝑝T bin is taken as an upwards and downwards uncertainty in the jet
200 300 400 500 600 700 800 900 1000 [GeV] T Leading jet p 0 0.2 0.4 0.6 0.8 1 1.2 1.4 Relative uncertainty Total uncertainty BIB normalisation BIB shape Cosmic normalisation Cosmic shape Cosmic subtraction Statistical ATLAS =13 TeV s Data 2017, 298 hours 200 300 400 500 600 700 800 900 1000 [GeV] T Leading jet p 0 0.2 0.4 0.6 0.8 1 1.2 1.4 Relative uncertainty Total uncertainty BIB normalisation BIB shape Cosmic normalisation Cosmic shape Cosmic subtraction Statistical ATLAS =13 TeV s Data 2018, 281 hours
Figure 7: Summary of the relative uncertainties in the total expected background prediction in each jet 𝑝Tbin of SRC
for 2017 (left) and 2018 (right) data.
yields. Signal cross-sections are calculated to approximate next-to-next-to-leading order in the strong coupling constant, adding the resummation of soft gluon emission at next-to-next-to-leading-logarithm
accuracy (approximate NNLO+NNLL) [46–53]. The nominal cross-section and its uncertainty are derived
using the PDF4LHC15_mc PDF set, following the recommendations of Ref. [54].
8 Results
The integrated yields in the central and inclusive signal regions are compared with the expected background
in Tables5and6, respectively, for 2017 and 2018 data. The binned jet-𝑝Tdistributions are shown for these
regions in Figure8. The central control and normalisation regions are used to provide the background
estimates in SRC, and the inclusive control and normalisation regions are used to provide the predicted yields in SRIncl.
Assumptions about the mass difference Δ𝑚 impact the point at which the jet 𝑝Tdistributions of various
signal models are expected to peak. Any potential excess of events must therefore be searched for across
Table 5: Breakdown of the expected and observed data yields in SRC in 2017 and 2018, integrated over the jet 𝑝T
spectrum. The quoted uncertainties include statistical and systematic contributions. The expected event yields from two example signal models with a gluino mass of 1.4 TeV and neutralino masses of 100 GeV and 900 GeV are also included, where the yields are calculated assuming a gluino lifetime within the range of the live-fraction plateau.
Central signal regions SRC (2017 data) SRC (2018 data)
Observed events 92 100
Total expected background events 88 ± 28 119 ± 32
Beam-induced background events 37 ± 23 72 ± 29
Cosmic-ray-induced background events 51 ± 21 47 ± 19
𝑚( ˜𝑔, ˜𝜒0
1) = (1400, 100) GeV 5 6
𝑚( ˜𝑔, ˜𝜒0
200 400 600 800 1000 Events / 50 GeV 1 − 10 1 10 2 10 Data Total Background Cosmics BIB )=(1400, 100) GeV 0 1 χ ∼ , g ~ m( )=(1400, 900) GeV 0 1 χ ∼ , g ~ m( SRC, Data 2017 (298 hours) -1 =13 TeV, 49.0 fb s ATLAS [GeV] T Leading jet p 200 400 600 800 1000 Data / Background 0 0.5 1 1.5 2 200 400 600 800 1000 Events / 50 GeV 1 − 10 1 10 2 10 Data Total Background Cosmics BIB )=(1400, 100) GeV 0 1 χ ∼ , g ~ m( )=(1400, 900) GeV 0 1 χ ∼ , g ~ m( SRC, Data 2018 (281 hours) -1 =13 TeV, 62.1 fb s ATLAS [GeV] T Leading jet p 200 400 600 800 1000 Data / Background 0 0.5 1 1.5 2 200 400 600 800 1000 Events / 50 GeV 1 − 10 1 10 2 10 Data Total Background Cosmics BIB )=(1400, 100) GeV 0 1 χ ∼ , g ~ m( )=(1400, 900) GeV 0 1 χ ∼ , g ~ m(
SRIncl, Data 2017 (298 hours)
-1 =13 TeV, 49.0 fb s ATLAS [GeV] T Leading jet p 200 400 600 800 1000 Data / Background 0 0.5 1 1.5 2 200 400 600 800 1000 Events / 50 GeV 1 − 10 1 10 2 10 Data Total Background Cosmics BIB )=(1400, 100) GeV 0 1 χ ∼ , g ~ m( )=(1400, 900) GeV 0 1 χ ∼ , g ~ m(
SRIncl, Data 2018 (281 hours)
-1 =13 TeV, 62.1 fb s ATLAS [GeV] T Leading jet p 200 400 600 800 1000 Data / Background 0 0.5 1 1.5 2
Figure 8: Observed and expected leading-jet 𝑝Tdistributions, with the bin boundaries considered for the interpretation,
in 2017 data (left) and 2018 data (right) in SRC (top) and SRIncl (bottom). All statistical and systematic uncertainties of the expected background are included in the hatched band. The last bin contains the overflow. Two example signal models with a gluino mass of 1.4 TeV and neutralino masses of 100 GeV and 900 GeV are overlaid, where the yields are calculated assuming a gluino lifetime within the range of the live-fraction plateau.
Table 6: Breakdown of the expected and observed data yields in SRIncl in 2017 and 2018, integrated over the jet 𝑝T
spectrum. The quoted uncertainties include statistical and systematic contributions. The expected event yields from two example signal models with a gluino mass of 1.4 TeV and neutralino masses of 100 GeV and 900 GeV are also included, where the yields are calculated assuming a gluino lifetime within the range of the live-fraction plateau.
Inclusive signal regions SRIncl (2017 data) SRIncl (2018 data)
Observed events 239 221
Total expected background events 167 ± 48 208 ± 50
Beam-induced background events 93 ± 42 139 ± 45
Cosmic-ray-induced background events 74 ± 30 69 ± 28
𝑚( ˜𝑔, ˜𝜒0
1) = (1400, 100) GeV 7 9
𝑚( ˜𝑔, ˜𝜒0
1) = (1400, 900) GeV 7 8
Table 7: Central (jet |𝜂| < 0.8) discovery regions in 2018 data. The lower lines of the table show the 95% CL upper limits on the number of signal events (𝑆95obs), the 95% CL upper limit on the number of signal events given the expected number (and ±1𝜎 excursions of the expectation) of background events (𝑆95exp), the 𝐶 𝐿𝐵value, i.e. the
confidence level observed for the background-only hypothesis, and the discovery 𝑝-value (𝑝 (𝑠 = 0)). The 𝑝-value is reported as 0.5 if the observed yield is smaller than the predicted.
Central discovery regions Jet 𝑝T>150 GeV Jet 𝑝T>300 GeV Jet 𝑝T>500 GeV
Observed events 100 11 4
Total expected background events 119 ± 32 12.5 ± 5.3 4.1 ± 2.3
Beam-induced background events 72 ± 29 2.2 ± 2.1 0.00+0.05−0.00
Cosmic-ray-induced background events 47 ± 19 10.3 ± 5.0 4.1 ± 2.3
𝑆95 exp 52.8+14.6−13.7 14.3+1.4−2.9 7.8+4.6−0.2 𝑆95 obs 45.3 14.1 7.9 𝐶 𝐿𝐵 0.30 0.45 0.56 𝑝(𝑠 = 0) (𝑍) 0.5 (0) 0.5 (0) 0.5 (0)
the range of the leading-jet 𝑝Tdistribution. To do this the three exclusive jet 𝑝Tbins in each SR are made
inclusive to form the discovery regions, used to make model-independent statements about the possible presence of new physics. Because the signal cross-section sensitivity of the 2018 dataset is expected to be roughly 20% larger than the 2017 dataset, only 2018 data is used to make these model-independent
statements. The results in the central and inclusive DRs are summarised in Tables7and8, respectively.
The data are consistent with the expected background across the full jet 𝑝Trange.
Model-independent upper limits at 95% confidence level (CL) on the number of events (𝑆95) that could
be attributed to BSM physics processes are derived using the CLSprescription [55], implemented using
HistFitter [56]. This procedure is carried out using the DRs summarised in Table2, and neglects potential
signal contamination in the CRs. Pseudo-experiments are used to set these upper limits. The expected
(𝑆95exp) and observed (𝑆95obs) upper limits on the number of possible BSM events are provided in Tables7
and8. The 𝑝-values, which represent the probability of cosmic-ray- or beam-induced backgrounds alone
to fluctuate to the observed number of events or higher, are also provided.