Publisher’s version / Version de l'éditeur:
Proceedings. International Energy Agency 32nd Task Leaders Meeting on Energy
Conservation and Emissions Reduction in Combustion, 2010
READ THESE TERMS AND CONDITIONS CAREFULLY BEFORE USING THIS WEBSITE.
https://nrc-publications.canada.ca/eng/copyright
Vous avez des questions? Nous pouvons vous aider. Pour communiquer directement avec un auteur, consultez la
première page de la revue dans laquelle son article a été publié afin de trouver ses coordonnées. Si vous n’arrivez pas à les repérer, communiquez avec nous à PublicationsArchive-ArchivesPublications@nrc-cnrc.gc.ca.
Questions? Contact the NRC Publications Archive team at
PublicationsArchive-ArchivesPublications@nrc-cnrc.gc.ca. If you wish to email the authors directly, please see the first page of the publication for their contact information.
NRC Publications Archive
Archives des publications du CNRC
This publication could be one of several versions: author’s original, accepted manuscript or the publisher’s version. / La version de cette publication peut être l’une des suivantes : la version prépublication de l’auteur, la version acceptée du manuscrit ou la version de l’éditeur.
Access and use of this website and the material on it are subject to the Terms and Conditions set forth at
Mass Concentration of Nonvolatile Nanoparticle Emissions:
Comparison of Autocompensating Laser-Induced Incandescence
(AC-LII) to Other Techniques
Smallwood, Greg; Thomson, Kevin; Snelling, David; Greenhalgh, Doug
https://publications-cnrc.canada.ca/fra/droits
L’accès à ce site Web et l’utilisation de son contenu sont assujettis aux conditions présentées dans le site LISEZ CES CONDITIONS ATTENTIVEMENT AVANT D’UTILISER CE SITE WEB.
NRC Publications Record / Notice d'Archives des publications de CNRC:
https://nrc-publications.canada.ca/eng/view/object/?id=cdc5bd11-1bd3-44c7-9e68-fed417767f5a https://publications-cnrc.canada.ca/fra/voir/objet/?id=cdc5bd11-1bd3-44c7-9e68-fed417767f5aMass Concentration of Nonvolatile Nanoparticle Emissions: Comparison of
Autocompensating Laser-Induced Incandescence (AC-LII) to Other Techniques
Greg Smallwood*1, Kevin Thomson1, David Snelling1, and Doug Greenhalgh2
1ICPET, National Research Council Canada, Ottawa, Ontario, Canada
2School of Engineering and Physical Sciences, Heriot-Watt University, Edinburgh, Scotland
A number of LII instruments were compared against a range of other instruments and techniques for de-termining the mass concentration of nonvolatile particulate matter (nvPM). LII was found to correlate well with most methods that claim to be specific to nvPM, but there was variability in the systematic uncertain-ty between the techniques. Applications included a laboratory soot generator, a gas flare, atmospheric black carbon, a diesel engine, and gas turbine emissions.
Introduction
Laser-based measuring techniques are important tools for understanding soot formation and oxidation in flames and for the quantification and characterization of particulate emissions from energy generation, industrial, and mobile sources. The drive to lower soot concentrations is produced by evermore stringent particulate matter (PM) emissions regulations. These regulations are in response to health and environmental concerns about air quality and nanoparticles in the atmosphere.
As a result, there is a need to measure black carbon levels in the atmosphere at microgram per cubic metre or lower mass concentrations. At the same time, emission standards for Diesel particulate matter (PM) are being lowered dramatically, resulting in the adoption of Diesel particulate filters (DPFs) by manufacturers, and there is a need to measure solid carbon levels in the exhaust and in dilution tunnels at microgram per cubic metre or lower mass concentrations.
Advances in optical diagnostics of nanoparticles have led to the recent emergence of techniques such as laser-induced incandescence to measure the concentration and size of nonvolatile aggregated nanoparticles emitted into the atmosphere during the production of energy through fossil fuel combustion. There has been significant progress in the understanding of the physics and chemistry related to the nanoscale processes that occur as a result of the rapid heating and cooling of soot nanoparticles due to laser irradiation during the laser-induced incandescence (LII) process for measuring soot nanoparticles (Schulz et al., 2006).
Laser-induced incandescence (LII) offers many advantages and unique capabilities over existing measurement technologies, including specificity to measuring refractory carbon (RC), the primary constituent of nonvolatile particulate matter (nvPM) emitted from combustion. LII has been identified as a leading candidate for the measurement of mass concentration of nvPM from aviation engines (SAE, 2010). A detailed comparison of LII instruments
against existing measurement technologies was required to demonstrate its capabilities for potential standardized measurements of nvPM. Measurement comparisons were performed and evaluated.
Experimental
The Artium Technologies LII 200 and LII 300 (Figure 1) instruments are commercial instruments based upon the autocompensating laser-induced incandescence (AC-LII) technique developed at the National Research Council Canada (Snelling et al., 2005; Smallwood, 2009). While most comparisons are performed with these commercial instruments, suitability for ambient measurements of atmospheric black carbon required application of a high sensitivity laser-induced incandescence (HS-LII) system (Smallwood, 2009).
The HS-LII system consisted of a Big Sky CFR 200 multimode pulsed Nd:YAG laser, operating with 200 mJ/pulse at 20 Hz and 1064 nm as the excitation source. The laser was equipped with an electro-optic q-switch to produce a laser light pulse with a smooth profile of 7 ns FWHM (full-width at half of maximum) duration. A half-wave plate (to rotate the plane of polarization) in combination with a thin film polarizer (angle-tuned to transmit horizontally polarized radiation) was used to adjust the laser energy as required. A second half-wave plate was used to return the plane of polarization of the transmitted laser light beam to vertical. To optimize the uniformity of the laser beam at the probe volume, the laser beam was expanded into a vertical light sheet and a rectangular aperture was placed in the beam prior to the probe volume. Low fluence LII, 0.15 J/cm2 was typically employed to limit the peak
temperatures to <4000 K, ensuring that negligible soot sublimation occurred.
The instruments were calibrated using an integrating sphere with a NIST-traceable spectrometer to monitor its output. This determined the absolute spectral radiance sensitivity of the LII systems.
Figure 1 Artium Technologies LII 300 instrument.
These systems were applied to measure the mass concentration of particulates from a Mini-CAST soot generator (LII 200), a turbulent gas flare (LII 200), atmospheric black carbon (HS-LII), Diesel exhaust (LII 300), and gas turbine emissions (LII 300). All instruments and techniques applied in each comparison were operated simultaneously so that any variations in concentration were accounted for.
Results
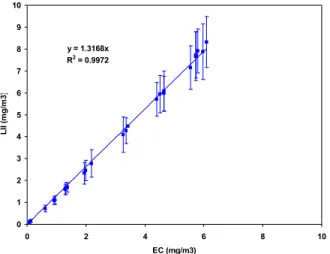
The LII 200 instrument was applied to measure the mass concentration of soot emitted by a mini-CAST soot generator. The concentration of soot that was measured was varied by varying the flame conditions in the soot generator and by diluting the output of the soot generator. The comparison was to a Sunset Laboratories EC/OC analyzer, a thermo-optical technique compatible with the NIOSH 5040 standard for measuring the elemental carbon (EC and organic carbon (OC) mass concentrations in particulate matter. y = 1.3168x R2 = 0.9972 0 1 2 3 4 5 6 7 8 9 10 0 2 4 6 8 10 EC (mg/m3) L II ( m g /m 3 )
Figure 2 LII 200 measurements of soot
concentra-tion from miniCAST soot generator compared to ele-mental carbon concentration determined by the NIOSH 5040 method.
The LII 200 results correlated extremely well with the NIOSH 5040 determination of EC, as shown in Figure 2, with a correlation coefficient of 0.997 holding over two orders of magnitude variation in concentration. There was a discrepancy in mass concentration, with the LII values about 1.3 times greater than those determined by NIOSH 5040. This could be due to a calibration issue with one or the other instrument, with both instruments, or due to the fact that EC is not the same as RC.
The soot emissions produced by a turbulent gas flare with a variety of fuels representing typical mixtures found in the oil and gas industry were measured with the LII 200 and by the gravimetric filter method. The results (Figure 3) demonstrated a weaker correlation and the LII results were less than the gravimetric results by a factor of 0.8. The weaker correlation may be due to the range of fuels studied, as each fuel may produce a different level of volatile particulates, which are measured by the gravimetric method but not detected by the LII 200. These volatile particles may also explain the fact that the LII results were lower than the gravimetric results.
0 0.0002 0.0004 0.0006 0.0008 0.001
Soot Yield, Ys, GRAV (kg soot/kg fuel)
0 0.0002 0.0004 0.0006 0.0008 0.001 S oo t Yi el d, Ys, L II ( kg so ot /k g f uel
) Fuel Mixture - BurnerH-6-Mix - 12.7 mm
H-6-Mix - 25.4 mm H-6-Mix - 38.1 mm H-6-Mix - 50.8 mm AVG-6-Mix - 12.7 mm AVG-6-Mix - 25.4 mm AVG-6-Mix - 38.1 mm AVG-6-Mix - 50.8 mm L-6-Mix - 25.4 mm L-6-Mix - 38.1 mm L-6-Mix - 50.8 mm 1:1 Line Linear Fit
Ys,LII = 0.8041•Ys,GRAV - 2.5743E-5
Figure 3 Measurements of emissions from a soot
flare comparing the LII 200 and gravimetric results.
The photoacoustic instrument was studied as it claims to measure black carbon directly, and thus should perform similarly to the LII technique. A study of emissions from the hot section of a gas turbine where the emissions were expected to be predominantly nvPM resulted in a high correlation of 0.991 between the LII 300 and photoacoustic instruments, and almost identical values (a slope of nearly 1.0), as shown in Figure 4. This level of agreement was likely due to the absence of volatile particles and the low uncertainty associated with the calibration of the instruments.
y = 0.9839x - 103.97 R² = 0.9906 0 2000 4000 6000 8000 10000 0 2000 4000 6000 8000 10000 A v e rag e LI I B la c k C a rbon M a s s C onc e n tr at ion ( μ g/ m 3)
Average AVL PA Black Carbon Mass Concentration (μg/m3)
LII Black Carbon vs AVL PA Black Carbon (All Data)
LII 300 vs AVL 483
Figure 4 Measurements of emissions from a gas
turbine comparing the LII 200 and photoacoustic instruments.
The same instruments were applied to the exhaust of a modern diesel engine operating without a diesel particulate filter, and compared to the concentration of total particulate matter as determined by the gravimetric filter method. As shown in Figure 5, both the LII 300 and the photoacoustic instrument demonstrate results significantly lower than the total particulate matter determined gravimetrically. Both have a correlation well above 0.9, but are only a factor of about 0.5 the value of the gravimetric data. This is likely due to the significant presence of non-refractory carbon species in the particulates, including volatiles, sulphates, nitrates, and ash.
y = 0.4894x + 0.0065 R² = 0.9493 y = 0.5652x + 0.0044 R² = 0.981 0.00 0.02 0.04 0.06 0.08 0.10 0.12 0.14 0.00 0.02 0.04 0.06 0.08 0.10 0.12 0.14 A v e rag e LI I & A V L B la c k C a rbon ( g /b hp-h r)
Gravimetric Total Particulate Matter (g/bhp-hr) LII & AVL PA Black Carbon vs Gravimetric TPM
Artium LII 300 AVL PA 483
Figure 5 Measurements of emissions from a diesel
engine comparing the LII 200 and photoacoustic in-struments against gravimetric results.
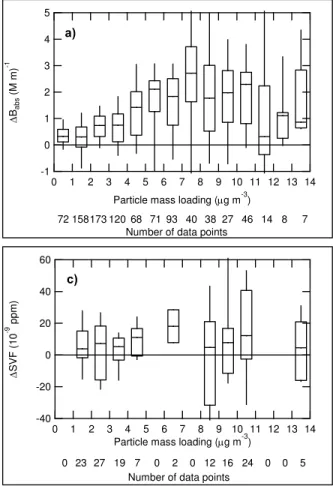
In a series of experiments studying ambient levels of atmospheric black carbon, HS-LII, photoacoustic, and aerosol mass spectrometer (AMS) instruments were simultaneously applied in a range or urban and suburban environments. The AMS was able to
matter, which was used to assess the mass loading of volatile coatings on the black carbon particulate matter. As shown in Figure 6, as the mass loading of the volatile coating increased, the photoacoustic instrument demonstrated a significant change in its response, whereas the HS-LII showed no significant effect. While these coating levels were higher than would be normally expected when monitoring emissions from combustion systems, the results indicate that LII instruments were not affected by the presence of volatiles whereas the photoacoustic instrument was significantly affected.
5 4 3 2 1 0 -1 Δ Babs (M m) -1 14 13 12 11 10 9 8 7 6 5 4 3 2 1 0
Particle mass loading (μg m-3)
a)
Number of data points
72 158173 120 68 71 93 40 38 27 46 14 8 7 60 40 20 0 -20 -40 Δ SV F ( 10 -9 ppm) 14 13 12 11 10 9 8 7 6 5 4 3 2 1 0
Particle mass loading (μg m-3)
c)
Number of data points
0 23 27 19 7 0 2 0 12 16 24 0 0 5
Figure 6 Measurements of atmospheric black
car-bon comparing the HS-LII and photoacoustic instru-ments. The variations of (a) the particle light absorp-tion (photoacoustic) and (c) the soot volume frac-tion (HS-LII) as a funcfrac-tion of particle volatile coating mass are shown (Chan et al., 2010).
Summary
A range of LII instruments were demonstrated to be highly correlated, repeatable, precise, selective, and linear with respect to some other particle mea-surement techniques. Real-time meamea-surements and high sensitivity also achievable.
However, the LII instruments have shown differ-ences in the absolute concentration when compared to some other methods. Comparisons to total particu-late matter are difficult due to the presence of vola-tiles and other non-carbon substances, and to large particles if a PM1.0 cutoff cyclone is not used.
PM mass measurements are highly sensitive to sampling conditions, including dilution, and instru-ment operation. Care must be exercised when com-paring measurement techniques, as the principles of operation and the measurands vary greatly.
Acknowledgements
Research supported in part by PERD Particles and Related Emissions Project C11.008 and PERD AFTER Project C23.006.
References
Chan et al., (2010), Atmospheric Chemistry and Physics (submitted).
McEwen, J., (2010), M.Sc. Thesis, Carleton University. Canada
SAE (2010), Aerospace Information Report AIR6037.
Schulz, C. et al., (2006), Applied Physics B: Lasers and Optics, 83, 333-354.
Smallwood, G.J., (2009), Ph.D. Thesis, Cranfield University, UK.
Snelling, D. R., Smallwood, G. J., Liu, F., Gülder, Ö. L., and Bachalo, W. D., (2005), Applied Optics, 44, 6773-6785.