ORIGINAL ARTICLE
Protein expression parallels thermal tolerance and ecologic
changes in the diversi
fication of a diving beetle species
complex
A Hidalgo-Galiana
1, M Monge
2, D G Biron
3, F Canals
2, I Ribera
1and A Cieslak
1Physiological changes associated with evolutionary and ecological processes such as diversification, range expansion or
speciation are still incompletely understood, especially for non-model species. Here we study differences in protein expression in response to temperature in a western Mediterranean diving beetle species complex, using two-dimensional differential gel
electrophoresis with one Moroccan and one Iberian population each of Agabus ramblae and Agabus brunneus. We identified
proteins with significant expression differences after thermal treatments comparing them with a reference EST library generated from one of the species of the complex (A. ramblae). The colonisation during the Middle Pleistocene of the Iberian peninsula by A. ramblae, where maximum temperatures and seasonality are lower than in the ancestral north African range, was associated with changes in the response to 27 °C in proteins related to energy metabolism. The subsequent speciation of A. brunneus from within populations of Iberian A. ramblae was associated with changes in the expression of several stress-related proteins (mostly chaperons) when exposed to 4 °C. These changes are in agreement with the known tolerance to lower temperatures of A. brunneus, which occupies a larger geographical area with a wider range of climatic conditions. In both cases, protein expression changes paralleled the evolution of thermal tolerance and the climatic conditions experienced by the species. However, although the colonisation of the Iberian peninsula did not result in morphological change, the speciation process of A. brunneus within Iberia involved genetic isolation and substantial differences in male genitalia and body size and shape. Heredity (2016) 116, 114–123; doi:10.1038/hdy.2015.80; published online 2 September 2015
INTRODUCTION
The development of high-throughput genomic and proteomic tools has allowed an exponential increase in our knowledge of speciation mechanisms (for example, Alcaide et al., 2014; Soria-Carrasco et al., 2014; see van Dijk et al., 2014 for an overview), but the relationships between phenotype and the underlying gene- and protein expression changes, and how these changes developed during the speciation processes resulting in the extant taxa, remain poorly understood. Standard phylogenetic methods can trace phenotypic changes asso-ciated with speciation events during the evolutionary history of a lineage (for example, Adams and Collyer, 2009; Rabosky et al., 2014), but the study of the underlying genetic changes have so far been addressed only in a handful of model systems (for example, Brawand et al., 2014; Carbone et al., 2014; Mallarino et al., 2012).
Changes in gene expression are known to have a role in speciation, although genetic differences have been rarely identified (Tautz, 2000; Wolf et al., 2010; Butlin et al., 2012). The role of temperature tolerance in establishing biogeographical ranges has also been recognised for long, but the physiological and molecular mechanisms responsible for establishing these patterns are not well known (Pörtner, 2001) and their study is just emerging (Pörtner and Knust, 2007).
The quantification of gene expression is methodologically complex; there are different quantitative methods available to study RNA or the
whole proteome, but they may not give consistent results, and some do not measure total amount of protein present in the cells (Wolf et al., 2010; Diz et al., 2012). A relatively simple alternative is the direct quantification of the amount of protein with two-dimensional differential gel electrophoresis (2D-DIGE; Thiellement et al., 1999; Krogh et al., 2007). The study of changes in protein abundances has become a powerful tool for generating hypotheses on how the environment affects the biology of organisms (Diz et al., 2012). Proteomics has the potential to discover unknown cellular effects to environmental stressors, such as changes in temperature (Cravatt et al., 2007).
The use of these methods should be extended to non-model species if they are to become standard tools in evolutionary biology (Wolf et al., 2010; Butlin et al., 2012). The use of non-model species suffers from two major drawbacks:first, the lack of genomic data (which is, however, of increasingly less concern, van Dijk et al., 2014), and second, and more important, the difficulty of studying wild popula-tions. These methodologies are necessary for species that cannot be bred in the laboratory, but also to address questions that can only be answered by looking at the response to natural conditions, or that require comparisons of a wide representation of intraspecific variation. The unknown and uncontrolled variation in natural populations is often thought to render the study of global protein expression
1Animal Biodiversity and Evolution, Institute of Evolutionary Biology (CSIC-Universitat Pompeu Fabra), Barcelona, Spain;2Vall d'Hebron Institute of Oncology (VHIO), Barcelona,
Spain and3Laboratoire
‘Microorganismes: Génome et Environnement’, UMR CNRS 6023, Equipe Interactions hôtes-parasites, Université Blaise Pascal, Aubière Cedex, France Correspondence: Dr A Hidalgo-Galiana or Dr I Ribera, Animal Biodiversity and Evolution, Institute of Evolutionary Biology (CSIC-Universitat Pompeu Fabra), Passeig Maritim de la Barceloneta 37-49, Barcelona, 08003, Spain.
E-mail: hg.amparo@gmail.com or ignacio.ribera@ibe.upf-csic.es
unfeasible (Wolf et al., 2010). However, we could recently show that in a western Mediterranean diving beetle, variation of protein expression, as determined by 2D-DIGE, was lower between replicated samples of different populations than variation between different temperature treatments (Hidalgo-Galiana et al., 2014a). Our results showed that specimens collected in the wild were suitable for proteomic analyses, as the additional sources of variation were far below the expected range and did not mask the consistency and reproducibility of the response to the temperature treatments (Hidalgo-Galiana et al., 2014a).
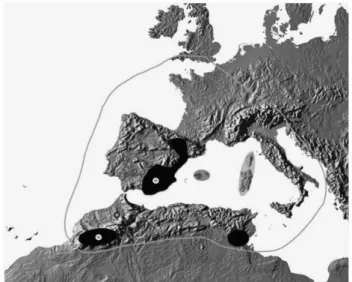
In this work, we use the same diving beetle species as in Hidalgo-Galiana et al. (2014a) (Agabus ramblae), together with its sibling species Agabus brunneus, to study changes in protein expression through the speciation process in relation to other changes in morphology, geographic distribution, ecology and thermal tolerance data. The A. brunneus complex is a phylogenetically isolated group of three closely related species of diving beetle with a western Mediter-ranean distribution (Figure 1; Millán and Ribera, 2001). In a recent study, the species complex was reconstructed to havefirst diversified during the Middle Pleistocene in Morocco, where the oldest haplo-types of A. ramblae were found (Hidalgo-Galiana et al., 2014b). Between 0.6 and 0.25 Ma they colonised the Iberian peninsula and subsequently the Balearic islands, Corsica and Sardinia, in the latter two giving rise to the species A. rufulus. Within the Iberian peninsula, A. brunneus likely arose from populations of A. ramblae, although the geographical setting of this speciation process could not be established with certainty (Hidalgo-Galiana et al., 2014b). The colonisation of Iberia by A. ramblae did not result in substantial morphological change, as shown by the comparison of the size of adults and the size and shape of the male genitalia between Iberian and Moroccan populations. These are characters normally used to characterise closely related species in the genus Agabus and other diving beetles (Millán and Ribera, 2001; Hidalgo-Galiana et al., 2014b). Similarly, no differences were found between the upper and lower experimentally measured short-term thermal tolerances of one Moroccan and one Iberian population (Hidalgo-Galiana et al., 2014b).
The species A. brunneus was reconstructed to have most likely originated from Iberian populations of A. ramblae ca 0.35 Ma, and
subsequently (mostly during the Last Glacial Maximum, 0.03– 0.01 Ma) dispersed to occupy its current range, through North Africa and Western Europe including some Mediterranean islands and the extreme south of Great Britain. The speciation of A. brunneus was associated with a significant increase in body size and change in the shape of the male genitalia, as well as an increased cold tolerance. The current climatic niche differs significantly between the two species: A. brunneus occupies less arid and seasonal areas, with a lower minimum temperature in the coldest month, than A. ramblae (Hidalgo-Galiana et al., 2014b).
Here we use Moroccan and Iberian populations of both A. ramblae and A. brunneus to compare their physiological response with extreme temperatures within their natural range, as measured with 2D-DIGE electrophoresis. We specifically aim to investigate (1) whether there were changes in protein expression associated with the colonisation and speciation processes within the complex; and (2) how these changes related to the evolution of phenotypic traits known to differ between species (morphology, climatic niche and thermal tolerance). Our results will also contribute to the understanding of the origin of differences in size of geographical ranges of closely related species, and the factors that allow geographic expansion to new areas under different climatic regimes.
MATERIALS AND METHODS Species and populations
For the experiments, we selected two populations of A. brunneus and A. ramblae, one from Morocco and one from the Iberian peninsula for each of the species (Figure 1). Populations were selected to include a wide range of genetic and environmental variability within each species (Hidalgo-Galiana et al., 2014b). For A. brunneus, we used one population from the Moroccan Middle Atlas (Tizi-n'Rechou, Kerrouchèn, 32º47'34.9’N 5º14'33.4’W, 1810 m a.s.l., 8.4.2007 P. Aguilera, C. Hernando and I. Ribera leg.); and another from NE Spain (Girona, river Ser ca. Santa Pau, 42º08'48’N 2º34'48’E, 445 m a.s.l. 13.10.2010 A. Hidalgo-Galiana, A. Rudoy, R. Alonso and I. Ribera leg.). For A. ramblae, we used one population from the south side of the Haut Atlas in Morocco (Tinghir, Toudgha river, 31º33'25.1’N 5º34'49.5’W, 1370 m a.s.l., 26.5.2011 A. Hidalgo-Galiana and N. Bennas leg.); and another from SE Spain (Murcia, Lorca, 37º42'10.7’N 1º55'33.8’W, 550 m a.s.l., 15.9.2007 P. Abellán, A. Cieslak, A. Millán and I. Ribera leg.). Of each population, ca 30 specimens were collected in thefield and transported to the laboratory in small plastic containers with vegetation and water from the place, in portable cooling boxes. Some specimens of the Iberian population of the two species were snap frozen in thefield in liquid nitrogen, serving as a field control.
Thermal treatments
Once in the laboratory, individuals were acclimated for 1 week in aquaria containing mineral water and vegetation taken from the natural habitat. Specimens were kept at room temperature (RT, always below 25 °C) with a natural day–night cycle. These conditions represented the control for the experiments. Specimens were fed ad-libitum on frozen red Chironomidae larva from commercial sources. After a week, an equal number of specimens were randomly allocated to each of three treatments for 12 h: 4 °C, RT and 27 °C. These are extreme temperatures within the range the species are likely to experience in their natural habitat (Hidalgo-Galiana et al., 2014b). After the treatment, specimens were snap frozen in liquid nitrogen, separated into three samples of 2–3 specimens (considered as a ‘biological replica’, Hidalgo-Galiana et al., 2014a) for each temperature treatment and stored at − 80 °C. The number of specimens per biological replica was limited by the total number of specimens available and the need of having at least three replicas per treatment for the statistical analyses. This protocol was shown to be appropriate to guarantee reproducibility and consistency of data generation in a preliminary study on the A. ramblae populations (Hidalgo-Galiana et al., 2014a). Figure 1 Distribution of the A. brunneus species complex. Outline:
A. brunneus; black areas plus Balearic Islands: A. ramblae; Corsica and Sardinia: A. rufulus. Circles mark the location of the populations used for proteomic analyses.
2D-DIGE experiments and image analysis
Proteins of whole specimens were extracted with a standard protocol under denaturing conditions as described in Hidalgo-Galiana et al. (2014a). Total protein yield of each sample was determined using Bio-Rad RCDC Protein Assay (Bio-Rad, Hercules, CA, USA) according to the manufacturer’s instructions.
The 2D-DIGE experiments were performed as described in Hidalgo-Galiana et al. (2014a). An internal standard for each experiment was generated by pooling equal amounts of protein from each extraction and labelled with Cy2-dye (Amersham cyanine DIGE Fluor minimal Cy2-dyes, GE Healthcare, Little Chalfont, UK). Five gels per experiment were run, each loaded with two samples derived from different biological replicas and treatments and with different labelling combinations of Cy3- and Cy5-dye (Amersham cyanine DIGE Fluor minimal dyes) and the internal standard. 2D-DIGE image analysis and statistical quantification of relative protein abundance were performed with Progenesis SameSpots v4.0 (Nonlinear Dynamics, Newcastle, UK). This soft-ware allows detecting, quantifying and matching of spots between gels after normalisation to the internal standard.
Analyses of expression patterns
All protein spots identified by SameSpots v4.0 (Nonlinear Dynamics) were verified using the scanned gels images. The intensity of the protein spot reflects the amount of protein present in the sample, and it is used as a surrogate of the protein expression level. Statistically significant differences in protein expression between groups (temperature treatments) were tested with one-way analysis of variance.
We tested for significant differences in protein expression in response to the thermal treatments between the populations according to the three key events of the reconstructed evolutionary history of the group (Figure 2; Hidalgo-Galiana et al., 2014b): node (1) Moroccan A. ramblae vs the other three populations (A. ramblae from the Iberian peninsula and A. brunneus from both localities); node (2) Iberian A. ramblae vs A. brunneus; and node (3) Moroccan vs NE Iberian A. brunneus. We also compared the combined data of populations of A. ramblae vs populations of A. brunneus.
For the comparison between populations, wefirst obtained the normalised spot volumes and then standardised them following the SameSpots recom-mended protocol (Supplementary Table S1). We visualised the global expres-sion patterns of the spots with significantly different expression levels for the different comparisons with principal component analysis (PCA). We selected spots with differences at a significance level of P-value o0.001, which for the number of points used (o600, see below) gave an overall number of expected false positives (type I error) of ca 0.6 per comparison. In addition, we used a
hierarchical cluster analyses to relate the proteins with similar expression patterns across samples in the form of a heat map using PermutMatrix V (Caraux and Pinloche, 2005), with Euclidean distances and UPGMA amalga-mation method (Biron et al., 2006).
Protein selection and identification
We selected the protein spots to be extracted and identified those that showed significant differences at a P-value o0.001 level in any of the comparisons. The final selection was based on the reconstructed SameSpots three-dimensional images of the spots in each gel, to ensure they had consistent and uniform spot formation.
To obtain a sufficient amount of protein for identification of the selected spots, a total of 300μg of a mix of protein extracts from representative samples were labelled, run on a preparative gel and scanned. The gel images were matched against the spots from the list previously generated in SameSpots v4.0 (see above). The selected spots were excised from the gel using an automated Spot Picker (GE Healthcare) and digested within the gel with trypsin (Promega, Madison, WI, USA) as described in Shevchenko et al. (1996). Extracted samples were analysed on a Maxis high-resolution Q-TOF spectrometer (Bruker, Bremen, Germany), coupled to a nano-HPLC system (Proxeon, Odense, Denmark). Proteins were initially identified using Mascot (Matrix Science, London, UK), searching the NCBI database, limiting the search to ‘Other Metazoa’ (for details, see Hidalgo-Galiana et al., 2014a).
EST reference library construction and sequencing
We constructed a transcriptome library using RNA from whole-body extrac-tions of adults of a total of 26 specimens of A. ramblae subjected to the same experimental treatment described above for the proteomic analysis. Specimens were collected from the same Iberian population (Murcia, river Vélez, 18.11.2008, P. Abellan leg.). After the temperature treatments, nine specimens each of the 4 °C and 27 °C treatments and eight RT controls were measured and weighed, and the total RNA of each individual was extracted separately as described by Sambrook et al. (1989). The yield of total RNA was measured photometrically and the amount extracted per mg calculated before pooling the RNA with proportionally the same amount from each temperature treatment. An aliquot of 200μg total RNA was sent to an external service (LGC-genomics, Berlin, Germany) for mRNA-isolation, cDNA-library construction, amplification, normalisation and high-throughput sequencing using the 454 FLX-technology of Roche (Roche/454 life sciences, Branford, CT, USA). With the assembled sequence contigs, we built a custom database in Geneious v.6 (Drummond et al., 2010) and used the amino-acid sequence of the identified protein fragments to identify matching transcript sequences. Biosample metadata are available in the NCBI biosample database under accession number SAMN03938328.
RESULTS
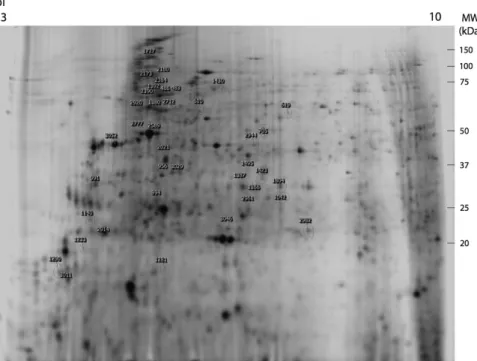
The 2D-DIGE map derived from all four experiments corresponding to two populations each of A. brunneus and A. ramblae contained a total of 2114 protein spots, with molecular masses ranging from 10 to 150 kDa and isoelectric points between pH 3 and 10 (Figure 3).
The protein samples of the Moroccan population of A. brunneus
contained substantially less spots than their Iberian sister
(Supplementary Tables S2), but when analysed following the protocol described in Hidalgo-Galiana et al. (2014a) the intra- and interpopula-tion variainterpopula-tion of the two A. brunneus populainterpopula-tions were similar to those found for A. ramblae. The variation between the RT andfield control replicas was larger than that between the replicas of the treatments (Supplementary Figure S1), as was the case in A. ramblae (Hidalgo-Galiana et al., 2014a). However, contrary to what was observed in A. ramblae, the comparison between the RT and 4 °C treatments showed less variation than between RT and 27 °C (Supplementary Figure S2). For the two populations of A. brunneus, the cluster analyses of the protein spots with a significant difference at a P-value o0.01 showed a good discrimination of the treatments, with the RT replicas
Figure 2 Summary phylogenetic relationships of the A. brunneus complex (adapted from Figures 3 and 4 in Hidalgo-Galiana et al., 2014b). Above branches, number of protein spots with significantly higher expression levels at a P-valueo0.001 for the comparison of populations at the two branches of the node for each treatment. With dashed lines, comparisons between populations not corresponding to nodes in the phylogeny. IBE, Iberian peninsula; MOR, Morocco.
closer to the 27 °C treatment for the Moroccan population and to the 4 °C for the Iberian population (with one misclassified replica) (Supplementary Figures S3). Thefield control was also closer to the RT and 4 °C treatments (Supplementary Figure S3).
For all four populations, we found a common set of 563 protein spots included in the following analyses. The number of spots up- or downregulated at 4 °C varied from 11.3% for the Iberian A. brunneus to 47.9% for the Iberian A. ramblae, whereas at 27 °C it ranged from 45.7% for Iberian A. ramblae to 60.8% for the Iberian A. brunneus (Table 1,Supplementary Table S5; see Supplementary Table S6 for the fold-change values of all 563 common spots).
Expression changes through the evolution of the group
Approximately 35% of the common spots (196 of 563) showed significant differences in at least one of the comparisons with a P-value o0.001 (Supplementary Table S1). In the comparison between the
Moroccan A. ramblae and the other three populations, corresponding to thefirst diversification event of the lineage by the colonisation of the Iberian peninsula (node 1 in Figure 2), almost 12% of the 563 spots showed significant differences, most of them in response to the 27 °C treatment (Figure 2; Table 1,Supplementary Table S5). In the subsequent major event in the evolution of the complex, that is, the separation between the Iberian A. ramblae and the two A. brunneus populations (node 2 in Figure 2), a similar number of protein spots showed significant differences (10%). However, in this case the main changes were in the response to the 4 °C treatment, with almost four times more varying spots than observed in response to the 27 °C treatment (Figure 2; Table 1,Supplementary Table S5).
In the intraspecific comparison of the two populations of
A. brunneus (Iberian and Moroccan, node 3 in Figure 2), o1% of
the spots had significantly different expression levels (Figure 2; Table 1, Supplementary Table S5), with equal number of changes
Figure 3 Image of the extraction gel (that is, with pooled aliquots of all experiments) with the location of the spots selected for identification (see Tables 2 and 3). Vertical axis, molecular weight; horizontal axis, isoelectric point.
Table 1 Number of spots with significant differences between treatments for each of the comparisons at a P-value o0.001 level (see Supplementary Table S5 for results using otherP levels for comparison)
Comparison Treatment Spot no. % Spots fold41.3 Upregulated 1st group % Upregulated 2nd group % Moroccan A. ramblae vs other populations 4 °C 19 100 17 89.5 2 10.5
27 °C 47 100 17 36.2 30 63.8 Iberian A. ramblae vs A. brunneus 4 °C 47 100 37 78.7 10 21.3
27 °C 12 100 11 91.7 1 8.3
Moroccan A. brunneus vs Iberian A. brunneus 4 °C 2 — — —
27 °C 2 — — —
A. ramblae vs A. brunneus 4 °C 33 100 23 69.7 10 30.3 27 °C 19 100 9 47.4 10 52.6 Moroccan A. ramblae vs Iberian A. ramblae 4 °C 20 100 7 35 13 65
27 °C 18 100 10 55.6 8 44.4
after the 4° or 27 °C treatment. On the contrary, between the two populations of the paraphyletic A. ramblae almost 7% of the spots were significantly different, also equally distributed between the 4 and 27 °C treatments. When both populations of each of the two species were combined and compared, the number of spots with significant changes (ca 9%) was twice as high for the 4 °C (6%) than for the 27 °C (3%) treatment.
Global expression patterns
The PCA using fold-change values of all 563 common spots showed a good discrimination of species in the first axis, and temperature treatment in the second (Figure 4a; Supplementary Figure S5A). RT controls had always intermediate scores between the 4 and 27 °C treatments for each of the populations (Supplementary Figures S5B and C), and were not included in some of the following analyses for simplicity. In the first axis (with 76.8% of the total variance, Supplementary Table S7), A. ramblae populations had the lowest
scores, with the only exception of the 4 °C treatment in Iberian A. ramblae, which had a higher score than the 27 °C Iberian A. brunneus. For the second axis (with 10.4% of the total variance, Supplementary Table S7), the situation was more complex, with the 4 °C treatments of A. ramblae and A. brunneus having the extreme positive and negative values, respectively, with intermediate positions occupied by 27 °C treatments, again with a single exception (27 °C Moroccan A. ramblae) (Figure 4a).
In the PCA of the spots with significant differences in the comparison with Moroccan A. ramblae vs all other populations, there
was also a good separation between species in the first two axes
(Figures 4b and c), but, as expected, differences were larger between Moroccan and Iberian A. ramblae than between Iberian A. ramblae and A. brunneus. In the comparison between Iberian A. ramblae with A. brunneus, the second axis perfectly separated the two species (with positive values for A. ramblae and negative for A. brunneus in both cases, Figures 4d and e). On the contrary, thefirst axis discriminated
Figure 4 Plots of the twofirst axes of the PCA analyses of the fold values of the 563 spots common to all experiments. (a) all spots, comparison between treatments (without RT); (b to e) only points with significantly different expression levels (P-value o0.001) in the comparison of b: Moroccan A. ramblae vs other populations (node 1 in Figure 2), 4 °C treatment; (c) Moroccan A. ramblae vs other populations, 27 °C treatment; (d) Iberian A. ramblae vs A. brunneus (node 2), 4 °C treatment; (e) Iberian A. ramblae vs A. brunneus, 27 °C treatment. Squares: A. ramblae, circles: A. brunneus;filled symbols: 4 °C, empty symbols: 27 °C, grey symbols: RT; IP, Iberian; M, Moroccan. Lines group the samples used to define the comparisons. See Supplementary Table S7 for details on the PCA results, and Supplementary Figure S5 for additional comparisons.
Iberian A. ramblae only for the 4 °C treatment, but not for the 27 °C, for which the score was similar but slightly lower than that of Iberian A. brunneus, and much larger than that of Moroccan populations of both species (Figure 4e).
In the PCA of the spots significantly different between the pooled populations of the two species, they were perfectly separated by the second axis, but the separation of the different samples along thefirst axis was less clear (Supplementary Figure S5B and C).
The cluster analyses gave similar results to the ordination obtained with PCA, with a clear separation between species and, to a lesser extent, between treatments when the spots with overall significant differences were selected (Supplementary Figure S6, differences at a P-valueo0.001 for A. ramblae (MOR) vs rest; Supplementary Figure S7, differences at a P-valueo0.0001 for A. ramblae vs A. brunneus). In the PermutMatrix analysis, expression levels of the selected spots could be associated with the different clusters, showing a primary separation between species and a secondary separation between temperature treatments, with no clear geographical structure (Supplementary Figures S3, see Supplementary Figure S8 for a representation of the volumes).
Identification of proteins
We sequenced and identified the protein spots best matching the selection criteria, most importantly a significantly different expression between treatments (at a P-value o0.001 level), but also sufficient protein material on the preparative gel and a well-defined spot in the images (Table 2; see Supplementary Table S8 for details of the proteins). In some of the spots, the targeted proteins could not be identified because of the abundance of highly expressed structural
proteins (mostly Actines or Myosines), and were not further con-sidered (Supplementary Table S8). Several proteins were also identified in multiple distant spots, suggesting they were residual fragments or
contaminations and were discarded from further analyses
(Supplementary Table S8). Two identified proteins best matched a ciliate (which are common ectoparasites of Dytiscidae) and were likewise discarded.
Of thefinal selection of 19 spots with identified proteins, 10 were differentially expressed in Moroccan A. ramblae with respect to all other populations (first node in Figure 2), two of them with clear signals for two proteins of similar size and isoelectric point (Tables 2 and 3). Most of the significant changes (six) were in response to the 27 °C treatment, and most of them were in proteins that could be related to energy metabolism (Tables 2 and 3). The only stress-related proteins (mostly chaperons) differently expressed in node 1 (Figure 2) were from two spots that also contained a protein related to energy metabolism (Tables 2 and 3), one of them in a spot also differently expressed between A. ramblae and A. brunneus (that is, with a significant expression change in node 2 in Figure 2) (Tables 2 and 3). On the contrary, in the second node (Figure 2) four out of nine proteins with expression changes between A. ramblae and A. brunneus were related to stress response andfive involved in energy metabolism (Table 2). Of these four stress-related proteins, one (HSP70, spot no. 2589) had a higher level of expression in A. ramblae than A. brunneus only after the 4 °C treatment, but the other three showed overall different levels of expression between species for both temperature treatments (Table 3).
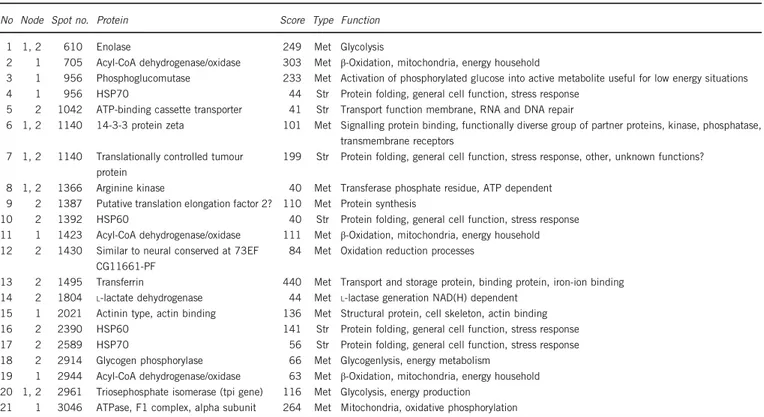
In the third node, between the two populations of A. brunneus (Figure 2), the only identified spot (2944) contained a metabolic-Table 2 Proteins identified in the selected spots according to the Mascot and EST library identifications (see Supplementary Table S8 for full details, including references for the functional interpretation of the proteins)
No Node Spot no. Protein Score Type Function 1 1, 2 610 Enolase 249 Met Glycolysis
2 1 705 Acyl-CoA dehydrogenase/oxidase 303 Met β-Oxidation, mitochondria, energy household
3 1 956 Phosphoglucomutase 233 Met Activation of phosphorylated glucose into active metabolite useful for low energy situations 4 1 956 HSP70 44 Str Protein folding, general cell function, stress response
5 2 1042 ATP-binding cassette transporter 41 Str Transport function membrane, RNA and DNA repair
6 1, 2 1140 14-3-3 protein zeta 101 Met Signalling protein binding, functionally diverse group of partner proteins, kinase, phosphatase, transmembrane receptors
7 1, 2 1140 Translationally controlled tumour protein
199 Str Protein folding, general cell function, stress response, other, unknown functions? 8 1, 2 1366 Arginine kinase 40 Met Transferase phosphate residue, ATP dependent
9 2 1387 Putative translation elongation factor 2? 110 Met Protein synthesis
10 2 1392 HSP60 40 Str Protein folding, general cell function, stress response 11 1 1423 Acyl-CoA dehydrogenase/oxidase 111 Met β-Oxidation, mitochondria, energy household 12 2 1430 Similar to neural conserved at 73EF
CG11661-PF
84 Met Oxidation reduction processes
13 2 1495 Transferrin 440 Met Transport and storage protein, binding protein, iron-ion binding 14 2 1804 L-lactate dehydrogenase 44 Met L-lactase generation NAD(H) dependent
15 1 2021 Actinin type, actin binding 136 Met Structural protein, cell skeleton, actin binding 16 2 2390 HSP60 141 Str Protein folding, general cell function, stress response 17 2 2589 HSP70 56 Str Protein folding, general cell function, stress response 18 2 2914 Glycogen phosphorylase 66 Met Glycogenlysis, energy metabolism
19 1 2944 Acyl-CoA dehydrogenase/oxidase 63 Met β-Oxidation, mitochondria, energy household 20 1, 2 2961 Triosephosphate isomerase (tpi gene) 116 Met Glycolysis, energy production
21 1 3046 ATPase, F1 complex, alpha subunit 264 Met Mitochondria, oxidative phosphorylation
Nodes (see Figure 2): (1) Moroccan A. ramblae vs rest of populations; (2) A. ramblae vs A. brunneus. score: mascot score value. type: met, metabolic-related protein; str, stress-related protein. See Supplementary Table S8 for details and references.
related protein (Acyl-CoA dehydrogenase/oxidase, Table 2) that was also differently expressed in the comparison of Moroccan A. ramblae to the other three populations (Table 3).
DISCUSSION
Protein expression changes associated with the speciation process The diversification of the A. brunneus complex most likely started in the Middle Pleistocene with the colonisation of the Iberian peninsula from North Africa by A. ramblae, but this range expansion did not result in appreciable changes in morphology (Hidalgo-Galiana et al., 2014b). Contrary to this lack of morphological variation, we found a substantial amount of proteins differently expressed between the Moroccan A. ramblae and the rest of Iberian populations, mostly in response to the 27 °C treatment and mostly proteins related to energy metabolism. The number of known localities of A. ramblae in North Africa (three in Morocco and two in Tunisia) is too low to allow a reliable estimation of their climatic niche, but their conditions may fall outside the main range of the Iberian A. ramblae, with stronger seasonality (that is, larger differences between the coldest and warmest months) and higher temperatures in the warmest month (Hidalgo-Galiana et al., 2014b). In Hidalgo-(Hidalgo-Galiana et al. (2014b), no significant differences in the thermal limits between the Moroccan and Iberian populations of A. ramblae were found, but it must be noted that upper thermal limits were estimated with standard short-term ramping experiments, in which both populations of A. ramblae (and also those of A. brunneus) tolerated temperatures above 40 °C (Calosi et al., 2008; Hidalgo-Galiana et al., 2014b), close to the common limit of most eukaryotes imposed by the denaturation of proteins (Somero, 1995). The observed differences in the response to the 27 °C treatment may be related to differences in the long-term capability to sustain temperatures not high enough to induce stress responses but sufficient
to significantly alter metabolic processes (through, for example, a systemic response to temperature, Hill et al., 2008), affecting long-termfitness.
The speciation process at the origin of A. brunneus was estimated to have taken place within the Iberian peninsula from within populations of A. ramblae (Hidalgo-Galiana et al., 2014b). This process was associated with significant changes in morphology, both in body size and size and shape of male genitalia, but also with an enhanced cold tolerance and significant changes in the estimated climatic niche (Calosi et al., 2008; Hidalgo-Galiana et al., 2014b). It is likely that these changes allowed the geographical expansion of A. brunneus during the Last Glacial Maximum to its current range, completely overlapping that of A. ramblae and extending beyond it to occupy much of the western Mediterranean (Figure 1). The proportion of proteins with significantly different expression levels related to the origin of A. brunneus was similar to that associated with the colonisation of the Iberian Peninsula by A. ramblae. However, in this case they were mostly proteins responding differently to the 4 °C treatment, and included several proteins known to be associated with thermal stress. The different response of the Moroccan and Iberian populations of A. ramblae was clearly seen in the results of the PCA analyses. The overall expression pattern of the Iberian A. ramblae after the 27 °C treatment was more similar to that of A. brunneus than to the Moroccan A. ramblae, but the contrary was observed in the expression pattern after the 4 °C treatment.
The subsequent geographic expansion of A. brunneus apparently did not result in further physiological changes, with o1% of proteins differently expressed between the two populations tested, suggesting the lack of differentiation within A. brunneus. This uniformity is also in agreement with the general incapability of acclimation in the group and in other species of Dytiscidae (Calosi et al., 2008, 2010), although Table 3 Summary of significant changes in expression of the identified protein spots
No Spot Node Function 27 °C 4 °C
A. ramblae A. brunneus A. ramblae A. brunneus Mor Ibe Mor Ibe Mor Ibe Mor Ibe 1 2021 1 Met 5.50 4.91 7.63 11.49 21.71 5.96 7.87 7.47 2 3046 1 Met 4.68 2.97 0.67 1.81 14.59 3.00 1.45 1.84 3 956 1 Met, str 1.23 6.85 10.87 8.11 4.41 1.21 18.46 15.06 4 705 1 Met 8.28 1.74 3.32 2.32 1.96 6.23 2.17 1.23 5 1423 1 Met 5.50 1.45 1.38 2.01 5.39 2.12 1.68 0.71 6 2944 1 Met 5.61 2.06 1.45 0.96 6.38 2.60 1.56 0.72 7 610 1, 2 Met 3.94 1.70 1.33 1.05 2.79 3.81 0.93 0.75 8 1140 1, 2 Met, str 0.76 2.20 3.42 3.40 0.86 1.19 4.44 6.96 9 1366 1, 2 Met 4.72 2.94 0.72 1.06 4.81 1.93 0.98 0.98 10 2961 1, 2 Met 9.86 6.70 3.32 5.00 12.59 5.96 4.34 5.63 11 2914 2 Met 17.07 46.14 39.46 41.17 19.75 8.52 60.85 67.70 12 2589 2 Str 4.93 2.54 12.58 6.86 9.11 11.90 4.55 2.22 13 1042 2 Str 7.35 5.28 2.23 3.86 7.20 5.81 3.19 4.29 14 1387 2 Met 8.90 3.88 1.12 1.74 6.44 7.81 1.45 1.60 15 1430 2 Met 1.18 0.49 0.14 0.34 3.22 1.35 0.21 0.23 16 1495 2 Met 9.82 5.38 3.07 4.57 9.74 6.28 3.13 1.49 17 1804 2 Met 3.89 2.75 1.47 2.31 2.99 3.03 1.40 1.50 18 1392 2 Str 0.49 1.25 2.43 4.30 0.24 0.72 2.14 1.69 19 2390 2 Str 0.71 0.78 1.60 1.34 0.14 0.37 0.70 0.58
Values are the average of the three replicas for each population and treatment (RT excluded for clarity, see Supplementary Table S5 for all values). See Table 2 for the identification of the proteins in each of the spots. Only significant differences (analysis of variance, P-value o0.001) are highlighted (italic, lower value; bold, higher value). Function: met, metabolic-related protein; str, stress-related protein (see Table 2 for details on the proteins, in spots 956 and 1140 two proteins were identified). Nodes: (1) Moroccan A. ramblae vs rest of populations; (2) A. ramblae vs A. brunneus. Abbreviations: Ibe, Iberia; Mor, Morocco.
there may be interactions with other environmental factors (for example, salinity, Sánchez-Fernández et al., 2010). It may also be simply due to insufficient time since colonisation, given that the geographic and demographic expansion of A. brunneus is estimated to have taken place during the Last Glacial Maximum,o30 000 years ago (Hidalgo-Galiana et al., 2014b). The amount of genetic variation for the studied proteins within the A. brunneus complex is, however, unknown, as the reference RNA library was constructed from a single population (Iberian A. ramblae).
Differences in the lower thermal limit between A. ramblae (includ-ing Moroccan and Iberian populations) and A. brunneus were also measured with short-term ramping experiments, and all were able to sustain temperatures below− 4 °C (Calosi et al., 2008; Hidalgo-Galiana et al., 2014b), well below the temperature used for the treatments (4 °C). However, and contrary to what happened with the upper thermal limit, 4 °C is likely to be at the extreme of what the species can tolerate when submerged in water (the physiological experiments were conducted in air, not water), and thus were more likely to induce a stress response.
Protein identification
We identified only a small proportion of proteins with significantly different expression levels, but we can assume that this sample is representative and not affected by any functional bias. The proteins to be identified were selected irrespective of the node in which they were differently expressed, and it was not possible to know in advance the functional type of the protein being selected. The proportion of metabolic or stress-related proteins in the different comparisons should thus not be affected by the low proportion of identified proteins other than by stochastic effects. The agreement of our results with known ecological and physiological differences reinforces our interpretation of the contrasting role that metabolic and stress-related proteins have had in the diversification process of the A. brunneus complex. But it should be noted that 2D-DIGE experiments can only identify targets for further functional studies (Rifai et al., 2006; Hamelin et al., 2011), and the risk of overinterpreting data should always be considered (Pavlidis et al., 2012; Welch and Jiggins, 2014). There are few proteomic studies on non-model insects (but see, for example, Biron et al., 2005 with grasshoppers, Francis et al., 2006 with aphids or Shevchenko et al., 2005 with moths), and it is thus difficult tofind common patterns of expression to compare with our results. The response to cellular stress is perhaps one of the most studied of these common patterns, as it is known to involve a common set of proteins in diverse taxa (Kültz, 2005). These include, among others, molecular chaperons that stabilise denaturing proteins, most notably heat shock proteins (HSP, Krebs and Feder, 1997). HSPs are a group of evolutionary highly conserved stress-inducible or constitutive proteins that maintain homeostasis in eukaryotic and prokaryotic cells (Rassow et al., 1997). We found several HSPs among the stress-related proteins with significant expression differences, for example,
HSP70 and HSP60, with two fingerprints for each. Although the
fingerprint fragments of the two HSP60 were different, both corre-sponded to the Tribolium HSP60 sequence and were localised very close to each other on the gel (numbers 1392 and 2390 in Figure 3), suggesting the presence of some small post-transcriptional modifica-tion. HSP60 and similar proteins have been shown to interact with HSP70 in bacteria to modulate the heat shock response (Mogk et al., 1997). However, no temperature-related function has been found for HSP60 in Drosophila melanogaster (Colinet et al., 2010). In our case, the expression of the two forms of HSP60 did not change significantly with the temperature treatments, but the expression level
was always higher in A. brunneus, suggesting a species-specific response.
In the case of the HSP70, the two proteins revealed a different response: one showed a lower level of expression in the Moroccan A. ramblae when compared with the other populations after the 27 °C treatment (spot 956 in Table 3), and the other showed a higher expression level at 4 °C in both populations of A. ramblae when compared with the two populations of A. brunneus (spot 2589 in Table 3). In other beetle species (Leptinotarsa), it has been shown that in populations exposed to temperatures lower than what they usually experience the HSP70 expression level was higher than in other populations that experience these low temperatures regularly, even when the populations had only recently diverged (Lyytinen et al., 2012).
Although the fingerprint fragments of the two identified HSP70s (numbers 956 and 2589 in Figure 3) were also different, they matched the same HSP70 reference sequence of Tribolium, but in this case their respective spots had a different molecular weight (32 and 43 kDa, respectively). Proteins originated from the same transcript can be modified in the cell compartment and change their chemical and/or physical properties (Schlüter et al., 2009; Diz et al., 2012), which can be easily identified and characterised using 2D-DIGE (unlike other methods that directly analyse RNA or protein fragments). HSP70 prevents aggregation or premature folding, and it is known to interact with other HSPs. It is the most commonly studied stress protein in cold-related studies (for example, Sørensen and Loeschcke, 2007; Clark and Worland, 2008). In addition to their general stabilising function, HSPs are also known to have key roles in the origin of phenotypic novelties, suggesting that they may mediate adaptation and speciation in addition to the protective homeostatic effects of the cellular stress response (Rutherford and Lindquist, 1998; Williams et al., 2009; Rohner et al., 2013).
Other stress-related proteins were the translationally controlled tumour protein (TCTP) and an ATP-binding transporter protein (Sukhai and Piquette-Miller, 2000), more highly expressed in both populations of A. ramblae that in A. brunneus in all treatments. For the former (TCTP), the same spot contained also a protein related to different metabolic functions (14-3-3 protein zeta, Zhang et al., 1998). This protein had a significantly different level of expression in two comparisons: Moroccan A. ramblae vs the other populations for the 27 °C treatment, and A. ramblae vs A. brunneus for both treatments. Without additional data, it is impossible to know which of the two proteins were responding to which treatment, but it is interesting to note that there is the possibility that the metabolic-related protein was responsible for the differences between the Moroccan A. ramblae vs the rest (node 1 in the tree of Figure 2), and the stress-related protein for the differences between species (node 2), in agreement with the general pattern. The situation for the only other spot in which two proteins were considered (956, Tables 2 and 3) was similar, with one stress-related and one metabolic-related protein and with significant response to nodes 1 and 2.
CONCLUDING REMARKS
We have shown that the protein expression patterns of a complex of closely related species can be associated with parallel changes in their ecology and thermal tolerance, contributing to the understanding of their evolutionary history and their geographical distributions. The colonisation of the Iberian peninsula by North African populations of A. ramblae during the Middle Pleistocene was accompanied by a change in the response to high temperatures in many proteins related to energy metabolism. It is likely that the new environment on the
Iberian peninsula had different climatic conditions, with lower maximum temperatures and seasonality, but whether these physiolo-gical changes were previous to the colonisation, possibly facilitating it, or posterior, as the result of an adaptation to the local conditions, is unknown. According to our most likely scenario, once on the Iberian peninsula, a speciation process gave rise to A. brunneus, with an increased tolerance to cold temperatures that likely allowed its range expansion during the Last Glacial Maximum to a much wider geographical area.
These phenotypic changes were paralleled by changes in the protein expression of several stress-related proteins when exposed to low temperatures. Again, whether differences evolved previously or after the geographic expansion is unknown, but the genetic and ecologic uniformity of A. brunneus through its known range and its estimated temporal origin (Hidalgo-Galiana et al., 2014b) point toward thefirst possibility.
The first of these transitions (Moroccan to Iberian A. ramblae) implied the crossing of a geological barrier, the Strait of Gibraltar, and the colonisation of a new territory. This likely resulted in isolated allopatric populations, but was not accompanied by substantial morphological change or differences in the lower thermal limit (Hidalgo-Galiana et al., 2014b). The markers used in this study did not allow a detailed geographical resolution, so the precise origin of the Moroccan populations and that of A. brunneus within the Iberian peninsula are not known. There was also some uncertainty in the branching pattern of the Corso-Sardinian species (A. rufulus) and the populations of A. ramblae in the Balearic Islands, but the main events in the evolutionary history of the group, as reflected in the three nodes used here for the comparison of the expression patterns, were resolved with confidence (Hidalgo-Galiana et al., 2014b).
The origin of A. brunneus did involve substantial morphological change in body size and male genitalia, as well as genetic isolation (except for some secondary contact zones: Tunisia, some areas in SE Iberia and some Mediterranean islands, Hidalgo-Galiana et al., 2014b). It may be hypothesised that the Moroccan and Iberian populations of A. ramblae did not evolve morphological differences, despite the physiological and ecological changes between them, because they likely developed in geographic isolation. On the contrary, ecological and physiological changes between A. brunneus and Iberian A. ramblae may have evolved in close geographical proximity, resulting in the accelerated modification of the male genitalia and the formation of two genetically isolated species through a process of reinforcement (for example, Pannell, 2012; Orsini et al., 2013).
Testing the model in future experiments will ideally include more populations for both species to perform the proteomic analysis and obtain their transcriptome. This information, together with climatic and ecologic data from the localities, may be very informative about the variability among populations in their responses to thermal stress at the proteome level and how this variability relates to the conditions they experience in thefield.
DATA ARCHIVING
Raw data of the fold values of the analysed 563 spots and details of the peptide sequence of the identified proteins are given in the Supporting information (Supplementary Table S1), and has been deposited in the Dryad repository (http://dx.doi.org/10.5061/dryad.15237). Transcrip-tome data are available in the NCBI biosample database under accession number SAMN03938328; a fastafile with the sequences of the 6569 contigs has been deposited in Dryad (http://dx.doi.org/ 10.5061/dryad.15237).
CONFLICT OF INTEREST
The authors declare no conflict of interest. ACKNOWLEDGEMENTS
We thank Nard Bennas and Sumia Fahd for assistance on thefield trip in Morocco, Pedro Abellán, Andrés Millán and Josefa Velasco for help in collecting the Iberian specimens of A. ramblae, and Piero Calosi for help to obtain the thermal tolerance data. Pedro Abellán also provided invaluable advice with R. We also thank Núria Colomé and Joan-Josep Bech (Proteomics Laboratory at VHIO) for assistance in the preparation and analyses of the DIGE experiments, and four Referees for comments to earlier versions of the manuscript. The Proteomics Laboratory at VHIO is a member of the ProteoRed-ISCIII network of the Instituto de Salud Carlos III. This work was funded by the Spanish government through the I+D+i programme, grants CGL2007-61665 and CGL2010-15755.
Adams DC, Collyer ML (2009). A general framework for the analysis of phenotypic trajectories in evolutionary studies. Evolution 63: 1143–1154.
Alcaide M, Scordato ESC, Price TD, Irwin DE (2014). Genomic divergence in a ring species complex. Nature 511: 83–85.
Biron DG, Loxdale HD, Ponton D, Moura H, Marché L, Brugidou C, Thomas F (2006). Population proteomics: and emerging discipline to study metapopulation ecology. Proteomics 6: 1712–1715.
Biron DG, Marché L, Ponton F, Loxdale HD, Galéotti N, Renault L, Joly C, Thomas F (2005). Behavioural manipulation in a grasshopper harbouring hairworm: a proteomics approach. Proc R Soc 272: 2117–2126.
Brawand D, Wagner CE, Li YI, Malinsky M, Keller I, Fan S et al. (2014). The genomic substrate for adaptive radiation in African cichlidfish. Nature 513: 375–381. Butlin R, Debelle A, Kerth C, Snook RR, Beukeboom LW, Castillo Cajas RF et al. [The Marie
Curie SPECIATION Network] (2012). What do we need to know about speciation?Trends Ecol Evol 27: 27–39.
Calosi P, Bilton DT, Spicer JI, Atfield A (2008). Thermal tolerance and geographical range size in the Agabus brunneus group of European diving beetles (Coleoptera: Dytiscidae). J Biogeogr 35: 295–305.
Calosi P, Bilton DT, Spicer JI, Votier SC, Atfield A (2010). What determines a species’ geographical range? Thermal biology and latitudinal range size relationships in European diving beetles (Coleoptera: Dytiscidae). J Anim Ecol 79: 194–204.
Caraux G, Pinloche S (2005). PermutMatrix: a graphical environment to arrange gene expression profiles in optimal linear order. Bioinformatics 21: 1280–1281. Carbone L, Harris RA, Gnerre S, Veeramah KR, Lorente–Galdos B, Huddleston J et al.
(2014). Gibbon genome and the fast karyotype evolution of small apes. Nature 513: 195–201.
Clark MS, Worland MR (2008). How insects survive the cold: molecular mechanisms– a review. J Comp Physiol B 178: 917–933.
Colinet H, Lee SF, Hoffmann A (2010). Temporal expression of heat shock genes during cold stress and recovery from chill coma in adult Drosophila melanogaster. FEBS J 277: 174–185.
Cravatt BF, Simon GM, Yates JR3rd (2007). The biological impact of mass-spectrometry-based proteomics. Nature 450: 991–1000.
van Dijk EL, Auger H, Jaszczyszyn Y, Thermes C (2014). Ten years of next-generation sequencing technology. Trends Gen 30: 418–426.
Diz AP, Martínez-Fernández M, Rolán-Álvarez E (2012). Proteomics in evolutionary ecology: linking the genotype with the phenotype. Mol Ecol 21: 1060–1080.
Drummond A, Ashton B, Buxton S, Cheung M, Cooper A, Duran C et al. (2010). Geneious v5.3. Available from http://www.geneious.com.
Francis F, Gerkens P, Harmel N, Mazzucchelli G, De Pauw E, Haubruge E (2006). Proteomics in Myzus persicae: effect of aphid host plant switch. Insect Biochem Mol Biol 36: 219–227.
Hamelin C, Cornut E, Poirier F, Pons S, Beaulieu C, Charrier J-P et al. (2011). Identification and verification of heat shock protein 60 as a potential serum marker for colorectal cancer. FEBS J 278: 4845–4859.
Hidalgo-Galiana A, Monge M, Biron DG, Canals F, Ribera I, Cieslak A (2014a). Reproducibility and consistency of proteomic experiments on natural populations of a non-model aquatic insect. PLoS One 9: e104734.
Hidalgo-Galiana A, Sánchez-Fernández D, Bilton DT, Cieslak A, Ribera I. (2014b). Thermal niche evolution and geographical range expansion in a species complex of western Mediterranean diving beetles. BMC Evol Biol 14: 187.
Hill RW, Wyse GA, Anderson M (2008). Animal Physiology, 2nd edn. Sinauer: Sunderland, MA, USA.
Krebs RA, Feder ME (1997). Tissue-specific variation in Hsp70 expression and thermal damage in Drosophila melanogaster larvae. J Exp Biol 200: 2007–2015. Krogh M, Liu Y, Waldemarson S, Valastro B, James P (2007). Analysis of DIGE data using a linear mixed model allowing for protein-specific dye effects. Proteomics 7: 4235–4244. Kültz D (2005). Molecular and evolutionary basis of the cellular stress response. Annu Rev
Lyytinen A, Mappes J, Lindström L (2012). Variation in Hsp70 levels after cold shock: signs of evolutionary responses to thermal selection among Leptinotarsa decemlineata populations. PLoS One 7: e31446.
Mallarino R, Campàs O, Fritz JA, Burns KJ, Weeks OG, Brenner MP, Abzhanov A (2012). Closely related bird species demonstrate flexibility between beak morphology and underlying developmental programs. Proc Natl Acad Sci USA 109: 16222–16227.
Millán A, Ribera I (2001). The Agabus (Gaurodytes) brunneus group, with description of a new species from the western Mediterranean (Coleoptera: Dytiscidae). Coleop Bull 55: 107–112.
Mogk A, Homuth G, Scholz C, Kim L, Schmid FX, Schumann W (1997). The GroE chaperonin machine is a major modulator of the CIRCE heat shock regulation of Bacillus subtilis. EMBO J 16: 4579–4590.
Orsini L, Vanoverbeke J, Swillen I, Mergeay J, Meester L (2013). Drivers of population genetic differentiation in the wild: isolation by dispersal limitation, isolation by adaptation and isolation by colonization. Mol Ecol 22: 5983–5999.
Pannell JR (2012). Speciation genetics: reinforcement by shades and hues. Curr Biol 22: R299–R302.
Pavlidis P, Jensen JD, Stephan W, Stamatakis A (2012). A critical assessment of storytelling: gene ontology categories and the importance of validating genomic scans. Mol Biol Evol 29: 3237–3248.
Pörtner HO (2001). Climate change and temperature dependent biogeography: oxygen limitation of thermal tolerance in animals. Naturwissenschaften 88: 137–146. Pörtner HO, Knust R (2007). Climate change affects marinefishes through the oxygen
limitation of thermal tolerance. Science 315: 95–97.
Rabosky DL, Grundler M, Anderson C, Title P, Shi JJ, Brown JW, Huang H, Larson JG (2014). BAMMtools: an R package for the analysis of evolutionary dynamics on phylogenetic trees. Meth Ecol Evol 5: 701–707.
Rassow J, von Ahsen O, Boamer U, Pfanner N (1997). Molecular chaperones: towards a characterization of the heat-shock protein 70 family. Trends Cell Biol 7: 129–133. Rifai N, Gillette MA, Carr SA (2006). Protein biomarker discovery and validation: the long
and uncertain path to clinical utility. Nat Biotech 24: 971–983.
Rohner R, Jarosz DF, Kowalko JE, Yoshizawa M, Jeffery WR, Borosky RL et al. (2013). Cryptic variation in morphological evolution: HSP90 as a capacitor for loss of eyes in cavefish. Science 342: 1372–1375.
Rutherford SL, Lindquist S (1998). Hsp90 as capacitor for morphological evolution. Nature 396: 336–342.
Sambrook J, Fritsch EF, Maniatis T (1989). Molecular Cloning: A Laboratory Manual, 2nd edn. Cold Spring Harbor Laboratory: Cold Spring Harbor, NY, USA.
Sánchez-Fernández D, Calosi P, Atfield A, Aribas P, Velasco J, Millán A, Bilton DT (2010). Reduced salinities compromise the thermal tolerance of hypersaline specialist diving beetles. Physiol Entom 35: 265–273.
Schlüter H, Apweiler R, Holzhütter HG, Jungblut PR (2009). Finding one's way in proteomics: a protein species nomenclature. Chem Cent J 3: 11.
Shevchenko A, Mittelstedt Leal de Sousa M, Waridel P, Tolfo Bittencourt S, Valle de Sousa M, Shevchenko A (2005). Sequence similarity-based proteomics in insects: character-ization of the larvae venom of the Brazilian moth Cerodirphia speciosa. J Proteome Res 4: 862–869.
Shevchenko A, Wilm M, Vorm O, Mann M (1996). Mass spectrometric sequencing of proteins silver-stained polyacrylamide gels. Anal Chem 68: 850–858.
Somero GN (1995). Proteins and temperature. Annu Rev Physiol 57: 43–68. Sørensen JG, Loeschcke V (2007). Studying stress responses in the post-genomic era: its
ecological and evolutionary role. J Biosc 32: 447–456.
Soria-Carrasco V, Gompert Z, Comeault AA, Farkas TE, Parchman TL, Johnston JS et al. (2014). Stick insect genomes reveal natural selection's role in parallel speciation. Science 344: 738–742.
Sukhai M, Piquette-Miller M (2000). Regulation of the multidrug resistance genes by stress signals. J Pharm Pharm Sci 3: 268–280.
Tautz D (2000). Evolution of transcriptional regulation. Curr Opin Genetics Dev 10: 575–579.
Thiellement H, Bahrman N, Damerval C, Plomion C, Rossignol M, Santoni V et al. (1999). Proteomics for genetic and physiological studies in plants. Electrophoresis 20: 2013–2026.
Welch JJ, Jiggins CD (2014). Standing andflowing: the complex origins of adaptive variation. Mol Ecol 23: 3935–3937.
Williams JB, Roberts SP, Elekonich MM (2009)Heat shock proteins and their role in generating, maintaining and even preventing alternative insect phenotypes. In: Whitman DW, Ananthakrishnan TN (eds). Phenotypic Plasticity of Insects: Mechanisms and Consequences. CRC Press: Boca Raton, FL, pp 741–766.
Wolf JBW, Lindell J, Backström N (2010). Speciation genetics: current status and evolving approaches. Philos T Roy Soc B 365: 1717–1733.
Zhang Y, Ohashi N, Rikihisa Y (1998). Cloning of the heat shock protein 70 (HSP70) gene of Ehrlichia sennetsu and differential expression of HSP70 and HSP60 mRNA after temperature upshift. Infect Immun 66: 3106–3112.