The Assessment of Using SI Engines for Medium-Duty
Applications
by
Gong Tang
B.S. Building Technology and Energy Engineering
Tsinghua University, China (2015)
Submitted to the Department of Mechanical Engineering
in partial fulfillment of the requirements for the degree of
Master of Science in Mechanical Engineering
at the
MASSACHUSETTS INSTITUTE OF TECHNOLOGY
June 2017Massachusetts Institute of Technology 2017. All rights reserved.
Author...
Signature redacted
...
Department of Mechanical Engineering
Certified by....
Signature redacted
May 12, 2017
Wai K. Cheng
Professor of Mechanical Engineering
Thesis Supervisor
77 Massachusetts Avenue Cambridge, MA 02139 http://Iibraries.mit.edu/ask
DISCLAIMER NOTICE
Due to the condition of the original material, there are unavoidable
flaws in this reproduction. We have made every effort possible to
provide you with the best copy available.
Thank you.
The images contained in this document are of the
best quality available.
The Assessment of Using SI Engines for Medium-Duty
Applications
by Gong Tang
Submitted to the Department of Mechanical Engineering on May 1 2th, 2017 in partial fulfillment of the
Requirements for the degree of Master of Science in Mechanical Engineering
ABSTACT
The price of diesel is projected to go up due to increasing demand. The price differential of diesel and gasoline is accordingly projected to increase. As a consequence of the diesel fuel price premium, a diesel engine must be significantly more efficient in terms of gallon/mile or liter/km, just to make up for the higher fuel cost in the US market.
In the truck market, the sales of diesel engine share has been going down continuously for class 4 trucks. The decrease may be driven by high diesel fuel prices. This study is to investigate the applicability and economics of replacing a diesel engine with an SI engine in medium duty class 5 applications, where such a switch may have already began.
The Ford F550 is offered with both diesel engine and gasoline engine option. From the Ford website, the price difference between the V-10 gasoline engine and the V-8 turbo diesel engine is more than $15,000, although with different performance (gasoline engine with more power, while diesel engine with more torque). The combination of high diesel fuel price relative to gasoline, and high diesel engine and aftertreatment prices opens an opportunity for a cost-effective, fuel-efficient gasoline medium truck engine.
There are two main tools that were used in this study - ADVISOR and GEM (Greenhouse Gas Emissions Model). ADVISOR is a set of model, data, and script text files for use with MATLAB and Simulink. GEM is a vehicle simulation tool developed by EPA for compliance with the proposed greenhouse gas emissions standards and fuel efficiency standards for medium and heavy-duty engines and vehicles.
The results from the engine simulations provide insight into the comparison of the usability and economy of using an SI engine and a diesel engine in medium duty trucks.After acquiring fuel consumption through various simulation, analysis of total cost of ownership was conducted for different cases.
Thesis Superv isor: Wai K. Cheng
ACKNOWLEDGMENT
I
would like to thank my thesis advisor Professor Wai Cheng, for his guidance and support. I have learned a great deal from him in the lab and in the classroom.Special thanks to Leslie Bromberg, for the effort and expertise, for insightful suggestions and ideas he shared during the execution of the project. The work would not have been possible without his help. Thanks for the time and input you shared during all phases of the project.
My time at MIT has been short but nonetheless immensely fulfilling. I have learned a lot about my academic field of study and also about myself and others. I appreciate the opportunity to have met so many amazing people at MIT.
Last, but most certainly not least, my family. I was blessed with wonderful, caring parents. Thank you, Mom, Dad, for always being so supportive with unconditional love.
TABLE OF CONTENTS
ABSTACT ... 3
ACKNOW LEDGM ENT ... 5
TABLE OF CONTENTS ... 7
LIST OF FIGURES ... 9
LIST OF TABLES ... 11
1 INTRODUCTION ... 12
1.1 Truck M arket and Engine M arket ... 12
1 .2 F u e ls ... 1 3 1.3 Vehicles ... 15
2 SIM ULATION SETTINGS ... 15
2.1 Advanced Vehicle Sim ulator (ADVISOR) ... 15
2.2 Greenhouse Gas Em issions M odel (GEM ) ... 17
2.3 Vehicle ... 18 2.4 Engines ... 20 2.5 Transm ission ... 23 2.6 Drive Cycles ... 24 2.6.1 Com m uter ... 24 2.6.2 HW FET ... 25 2.6.3 NYC truck ... 26 2.6.4 UDDS ... 28
3 SIM ULATION DATA ANALYSIS ... 29
3.1 Com m uter ... 29
3.2 HW FET ... 30
3.3 NYC Truck ... 31
3.4 UDDS ... 32
4 SIM ULATION RESULTS ... 33
4.1 Full Payload ... 33
4.1.1 M iles Per Gallon - Gasoline Equivalent (M PG-GE) ... 33
4.1.2 Fuel Consum ption- Gallons Per Hundred M iles (GPHM ) ... 34
4. 22 Half LPayloau- I ... j 4.2.1 M iles Per Gallon - Gasoline Equivalent (M PG-GE) ... 35
4.3 Zero Payload ... 37
4.3.1 M iles Per Gallon - Gasoline Equivalent (M PG-GE)... 37
4.3.2 Cycle-averagedFuel Consumption- Gallons Per Hundred Miles (GPHM)... 38
5 COST OF OW NERSHIP ... 41
5.1 Assum ptions ... 41
5.1.1 Depreciation ... 41
5.1.2 Insurance ... 41
5.1.3 Financing... 42
5.1.4 Taxes & Fees ... 42
5.1.5 Fuel ... 42
5.1.6 M aintenance... 42
5.1.7 Repairs ... 42
5.2 Cost of Ownership Breakdown... 43
5.2.1 Diesel Engine ... 43
5.2.2 SI Engine ... 44
5.3 Effect of Annual vehicle m ileage ... 46
5.4 Effect of fuel price ... 47
5.5 Effect of new technologies ... 49
5.6 C02 Em issions ... 54
6 CONCLUSIONS ... 56
LIST OF FIGURES
Figure 1-1 Truck sales by manufacturer from 2011 to 2015 [1]... 12
Figure 1-2 Share of Diesel Truck Sales by Class, 2011 and 2014 [1]... 12
Figure 1-3 Fuel Price History [2]... 13
Figure 1-4 Com parison of Diesel Price and Gasoline Price [2]... 13
Figure 1-5 Price differential of diesel and gasoline ... 14
Figure 1-6 Historic and projected price Prem ium of Diesel ... 14
Figure 1-7 Exam ples of Trucks in 8 Truck Classes ... 15
Figure 2-1 ADVISOR Start Interface... 16
Figure 2-2 ADVISOR W orking Interface ... 17
Figure 2-3 ADVISOR Simulation Interface ... 17
Figure 2-4 GEM Start Interface... 18
Figure 2-5 GEM W orking Interface... 18
Figure 2-6 Ford F550... 19
Figure 2-7 Diesel Engine Efficiency M ap ... 22
Figure 2-8 SI Engine Efficiency M ap ... 22
Figure 2-9 Torque - Speed ... 22
Figure 2-10 Old Shifting Schedules... 23
Figure 2-11 New Shifting Schedules ... 23
Figure 2-12 Speed - Time of Commuter Cycle ... 24
Figure 2-13 Speed - Time of HW FET ... 24
Figure 2-14 Speed - Time of NYC Truck ... 24
Figure 2-15 Speed - Time of UDDS ... 24
Figure 2-16 Speed - Time of Commuter Cycle ... 25
Figure 2-17 Histogram of Speed Spread in Com m uter Cycle ... 25
Figure 2-18 Speed - Time of HW FET Cycle... 26
Figure 2-19 Histogram of Speed Spread in HW FET Cycle... 26
Figure 2-20 Speed - Time of NYC Truck Cycle ... 27
Figure 2-21 Histogram of Speed Spread in NYC Truck Cycle ... 27
Figure 2-22 Speed - Time of UDDS Cycle ... 28
Figure 2-23 Histogram of Speed Spread in UDDS Cycle ... 28
Figure 3-1 Ford F550 Diesel Engine - Comm uter... 29
Figure 3-2 Ford F550 SI Engine - Commuter... 29
Figure 3-3 Ford F550 6-Cylinder Engine -Com m uter... 29
Figure 3-4 Ford F550 6-Cylinder SI Engine W ith M odified transm ission... 29
Figure 3-5 Ford F550 Diesel Engine - HW FET ... 30
Figure 3-6 Ford F550 12-Cylinder SI Engine - HW FET... 30
Figure 3-7 Ford F550 6-Cylinder Engine - HW FET ... 30
Figure 3-8 Ford F550 6-Cylinder with M odified Transm ission ... 30
Figure 3-9 Ford F550 Diesel Engine - NYC Truck... 31
Figure 3-11 Ford F550 6-cylinder SI Engine -NYC Truck ... 31
Figure 3-12 Ford F550 6-cylinder SI Engine with modified transmission ... 31
Figure 3-13 D iesel Engine - UDDS... 32
Figure 3-14 12-Cylinder SI Engine - UDDS ... 32
Figure 3-15 6-Cylinder SI Engine - UDDS ... 32
Figure 3-16 Ford F550 6 Cylinder SI Engine with modified transmission ... 32
Figure 4-1 Simulation Results - MPG-GE (Full Payload)... 33
Figure 4-2 Comparison of GPHM at Full Payload ... 34
Figure 4-3 Comparison of MPG-GE at Half Payload ... 36
Figure 4-4 Comparison of GPHM at Half Payload ... 37
Figure 4-5 Comparison of MPG-GE at Zero Payload ... 38
Figure 4-6 Comparison of GPHM at Zero Payload... 39
Figure 5-1 Diesel Engine Cost of Ownership Breakdown ... 44
Figure 5-2 SI Engine Cost of Ownership Breakdown ... 46
Figure 5-3 Average Annual Vehicle Miles Traveled of Major Vehicle Categories ... 46
Figure 5-4 Influence of Increasing Annual Mileage: the bars are the total cost, the lines are the co st p e r m ile ... 4 7 Figure 5-5 Five Years Fuel Cost... 48
Figure 5-6 Five Years Total Cost ... 48
Figure 5-7 Cost of Improvement of SI engine Efficiency ... 52
Figure 5-8 Fuel cost in different cases... 53
Figure 5-9 Five Years Total Cost ... 53
Figure 5-10 C ost Per M ile ... 54
Figure 5-12 C02 emission comparison of the diesel engine against the baseline SI engine and the SI engine added on different techonologies ... 55
LIST OF TABLES
Table 2-1 Specifications of Ford F550 ... 19
Table 2-2 Comparison of F550 With SI Engine and Diesel Engine... 20
Table 2-3 SI Engines Used in Sim ulation... 21
Table 2-4 Sum m ary of the Com m uter Drive Cycle ... 25
Table 2-5 Sum m ary of HW FET Drive Cycle ... 26
Table 2-6 Sum m ary of the NYC Truck Drive Cycle ... 27
Table 2-7 Sum m ary of the UDDS Drive Cycle ... 28
Table 4-1 M PG-GE of Different Engine Options ... 34
Table 4-2 MPG-GE of Different Engine Options at Full Payload... 35
Table 4-3 MPG-GE of Different Engine Options at Half Payload ... 36
Table 4-4 GPHM of Different Engine Options at Half Payload ... 37
Table 4-5 MPG-GE of Different Engine Options at Zero Payload ... 38
Table 4-6 GPHM of Different Engine Options at Zero Payload ... 40
Table 5-1 Breakdown of the Cost of Ownership of the Diesel Engine ... 43
Table 5-2 Breakdown of the Cost of Ownership of the SI Engine ... 45
Table 5-3 Comparison of Estimated Efficiency from Rulemaking and Suppliers [10]... 50
1 INTRODUCTION
1.1 Truck Market and Engine Market
From 2011 to 2015, class 4- 7 truck sales have increased by 49%. Many of the manufacturers
even doubled their sales of class 4-7 [1], as shown in Figure 1-1. Despite the increasing sale
number in the truck market, diesel engine use in class 4 and class 5 have both declined by a large proportion. *FCA 200 1 0 ...--- ---- ---120 -- - .... -0 aFerd 2011 2012 2013 2014 2015
Figure 1-1 Truck sales by manufacturer from 2011 to 2015 [1]
0o - 21
l2GY4
20%
In Figure 1-2, the yellow column represents the diesel vehicle share in 2010 and the green column represents that number in 2014. Diesel engine share declined 66% for class 4 trucks, and class 5 share also fell from more than 90% to 80%. Meanwhile, Class 6-8 didn't show the same
decreasing trend for diesel engine share. But why? What are the advantages of not using diesel engine in class 4 and class 5 trucks? We will probe into this question later.
1.2 Fuels
Prices of different fuels always fluctuate over time. Figure 1-3 and Figure 1-4 are two figures showing the price (in gasoline-equivalent, compensated by different heating values between
diesel and gasoline) and price difference of diesel and gasoline in different years. In Figure 1-3, you can also see the price of E85, which is a high-octane fuel, and could be another alternative fuel option.
Figure 1-3 shows the US average monthly fuel price. There is a predictable seasonal pattern in the fuel price during last few years. In winter, when demand for home heating oil peaks and
gasoline demand is lower, the diesel price premium is large. While in summer, when there is little demand for heating oil and gasoline demand is
smaller or even negative, as shown in Figure 1-5.
higher, the diesel price premium is much
T $6.W ... - o"OwmP~ - E85 - olt"
'5$5.00 $ 4.00...
$2.00
$1.00
Figure 1-3 Fuel Price History [2]
-Gm~w -0~e 4 3 2.5 2 i's 0.5 0
Figure 1-4 Comparison of Diesel Price and Gasoline Price [2]
The prices in Figure 1-4 are yearly averages. We don't see as much fluctuations as in Figure 1-3.
Projections from EPA website [2] of future demand indicate that diesel demand will continue to
grow, as gasoline demand levels off. This effect is expected to increase the price pressure on diesel, as shown in Figure 1-4.
---- --- -
---,1
---Veor
$0.50 - - - -$0.40 - - - -- - - - - $0.30--$0.00 - ----$0.10 -$0.20 -$0.50 C N1 A .$ ")
wq
Figure 1-5 Price differential of diesel and gasaline
year -010
0
-01 1 -p i $ .1s#-0
Figure 1-6 Historic and projected price Premium of Diesel
Price premium has been greater than zero since 2004, and is projected to continue to increase in the future. The higher price of diesel may be part of the reason that diesel share in class 4 and class 5 declined so drastically.
In -41 1 0-8 S0.8 .U 0.5 0.4 0.2 0 -0.2
1.3 Vehicles
There are eight truck classes, categorized by the gross vehicle weight rating (GVWR) that the vehicle is assigned when it is manufactured. Some examples of the 8 truck classes are shown
below.
Class 1 -6,000 & Less
IP4
41
% o~
iLiass D - i t)'uui To il 'uu
Figure 1-7 Examples of Trucks in 8 Truck Classes [3]
For heavy-duty vehicles, SI engine may not be able to produce enough torque. As a result, we
put our focus on medium-duty vehicles. In the following chapters, we will use a class 5 vehicle as
an example for this study.
2 SIMULATION SETTINGS
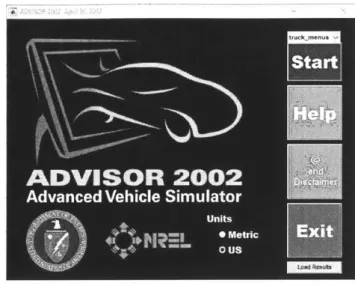
2.1 Advanced Vehicle Simulator (ADVISOR)
The Advanced Vehicle Simulator (ADVISOR) 2002 was used as the main simulation tool in the
study. ADVISOR is a set of model, data, and script text files for use with MATLAB and Simulink. It
Ai
vehicles with conventional (gasoline/diesel), hybrid-electric, full-electric, and fuel cell powertrains [4].
Figure 2-1 ADVISOR Start Interface
A vehicle model in ADVISOR 2002 is defined by 7 MATLAB files, which are able to modify the parameters of the vehicle, the fuel converter, the exhaust aftertreatment, the transmission, the
wheel/axle, the accessories, and the powertrain control.
The user needs to take two steps to do the simulation:
1. 2.
Define a vehicle using measured or estimated component and overall vehicle data. Prescribe a speed versus time trace, along with road grade, that the vehicle must follow.
There are 32 built-in drive cycles included in ADVISOR, which cover a wide range of driving conditions. Four of the built-in drive cycles were utilized in the simulation.
800 . 2 0 84
1000 10 1400 1600 1880 2000 OMOtPnsn '.8
Figure 2-2 ADVISOR Working Interface
Mit EdO Unit. Help
1 0 18.50.0 Input0. S 2 400 800 800 1000 1200 1400 time (see) = !a..sewU-2. 2 rr.-. e Eg g ...--. en iss 2 CYCUDOS 400 0300 20 - - -1 0 0 2 00 00 1"0 2 2% Speed (p) 88g.. %
Figure 2-3 ADVISOR Simulation Interface
2.2 Greenhouse Gas Emissions Model (GEM)
Greenhouse Gas Emissions Model (GEM) is a free, desktop computer application that estimates the greenhouse gas (GHG) emissions and fuel efficiency performance of specific aspects of
heavy-duty (HD) vehicles
[51.
GEM was first created by EPA as part of the "Heavy-DutyGreenhouse Gas Emissions Standards and Fuel Efficiency Standards for Medium and Heavy-Duty Engines and Vehicles: Phase 1" rulemaking finalized in 2011. The model was developed to serve
as a means for determining compliance with EPA's GHG emissions and NHTSA's fuel
consumption Phase 1 vehicle standards for Class 7 and 8 combination tractors and Class 2b-8 vocational vehicles [5].
Diesel vehicles have higher fuel economy and lower C02 emissions than their gasoline
counterparts [6]. As a result, it's also worthwhile to look into the C02 emission benefit of the diesel engine option with GEM.
&
GREENHOUSE GSEMISSIONS MODEL, GEM P2Vl,0
Figure 2-4 GEM Start Interface
*EPA Phase 2 GEM v 1. GEMk VOCATIONALcsv -x
U~oS bhiMeav9WC3t~
Figure 2-5 GEM Working Interface
2.3 Vehicle
Ford F-550 was chosen as the prototype of our vehicle model, as Ford offers both diesel version
and gasoline version of this truck in the US market. The engine offered in these trucks is a conventional port-injected, naturally aspirated 6.8 liter V-10 which was derived from a pickup truck engine. Some specifications of Ford F550 is shown in Table 2-1 [7], which was referred to
A
Figure 2-6 Ford F550
Table 2-1 Specifications of Ford F550
SPECIFICATIONS FORD F550 CURB WEIGHT/KG 3103 MAX PAYLOAD/KG 5742 MAXIMUM POWER/KW 224 FRONTAL AREA/M2 5.57 DRAG COEFFICIENT 0.8 WHEEL THEORETICAL 0.495 RADIUS/M WHEEL RADIUS 0.95 CORRECTION FACTOR ACTUAL RADIUS/M 0.47025
There are one SI engine and one diesel engine provided by Ford on their website. The SI engine is a 6.8-liter V10 engine and the diesel engine is a 6.7-liter engine. Diesel engine can achieve a
higher maximum torque of 895 Nm at 1600 rpm, while the maximum torque of the SI engine is
about 30% lower, which is 620 Nm at 3250 rpm. The maximum power of the SI engine is 362 hp and that of the diesel engine is 300 hp. The diesel version will cost customers $15,000 more
Table 2-2 Comparison of F550 With SI Engine and Diesel Engine
Vehicle Model 2016 Ford F-550
GASOLINE DIESEL
Price $41,160 $56,365
Base Curb Weight 6700 lbs 7491 lbs
Maximum Payload 12,660 lbs 12,660 lbs
Engine Displacement Volume and 6.8 L, V10 6.7 L, diesel
Configuration
Maximum Torque 620 Nm (at 3250 rpm) 895 Nm (at 1600 rpm)
Maximum Power 362 hp (at 4750rpm) 300 hp (at 2800 rpm)
BMIEP 11.5 bar 16.8 bar
In the simulation, the vehicle's empty weight was left constant, but the maximum payload amounts were increased. All simulations were run with 3 payloads: 0% (empty), 50%, and 100% (full GVW).
2.4 Engines
The SI engine provided by Ford is a V-10 SI engine with a maximum torque of 620 Nm at
medium engine speed, which is significantly lower than the diesel version. Therefore, in order to make the comparison fair in terms of engine's performance. The original SI
engine was replaced with a 12-cylinder SI engine which was scaled from a 4-cylinder(2L) modern Audi engine. The 12-cylinder SI engine has a maximum torque of 930 Nm, which
is even higher than the maximum torque of 895 Nm of the diesel engine. The cost of the
boosted 6L V12 SI engine would add about $1000 to the engine cost compared to the
6.8L V10 SI engine currently used in the SI version of F550. The cost to the customer would be $2000 with a typical factor of 2 mark up. The peak power is very high because
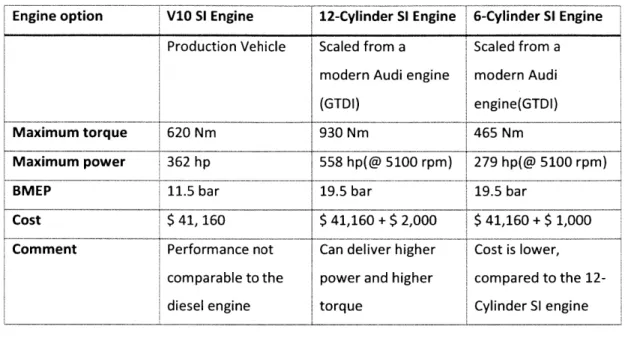
Table 2-3 SI Engines Used in Simulation
Engine option
V1O
SIl Engine 12-Cylinder SlI Engine 6-Cylinder SlI EngineProduction Vehicle Scaled from a Scaled from a
modern Audi engine modern Audi
(GTDI) engine(GTDI)
Maximum torque 620 Nm 930 Nm 465 Nm
Maximum power 362 hp 558 hp(@ 5100 rpm) 279 hp(@ 5100 rpm)
BMEP 11.5 bar 19.5 bar 19.5 bar
Cost $ 41, 160 $ 41,160 + $2,000 $ 41,160 +$ 1,000
Comment Performance not Can deliver higher Cost is lower,
comparable to the power and higher compared to the
12-diesel engine torque Cylinder SI engine
Figure 2-7 and Figure 2-8 show the fuel map of the diesel engine and SI engine used in the simulation. The peak efficiency of the diesel engine is about 44%, and the peak efficiency of the large SI engine is about 36%. In Figure 2-8, the left vertical axis represents the torque of the 12-cylinder SI engine and the right axis represents that of the 6-12-cylinder engine. Engine fuel maps were loaded into ADVISOR in the form of fuel rate in g/s corresponding to an engine speed and torque. ADVISOR can provide miles per gallon averaged over a given drive cycle. The total fuel used in gallons per hundred miles over the cycle was then converted from mpg.
Figure 2-9 is a comparison of the maximum torque curves. The SI engine can achieve an even higher maximum torque and it also operates in a wider range of engine speed. However, notice that the torque delivered at low engine rpm is substantially lower for even the larger SI engine than for the diesel engine. It was investigated if the difference low-engine torque could be compensated by using different transmission gearing, as will be described below.
42
800 1000 1200 1400 1600 1800 2000 Speed (rpm)
Figure 2-7 Diesel Engine Efficiency Map
12-cylinde r 6-cylinder 400 1300 200 100 1000 2000 3000 4000 5000 6000 Speed (rpm)
Figure 2-8 S Engine Efficiency Map
---- -12-cylinder SI engine - - 6-cylinder SI engine
800 E600 o400 200 800 C Cr400 0 200 36 35 esel Engine - Di 1000 900 800 700 3 600 L 500 0 .c 300 Lr5 200 -- ---
----2.5 Transmission
Shifting schedules in ADVISOR are defined by boundaries, as shown in Figure 2-10 and Figure
2-11. The red lines represent downshifting schedules and the blue lines represent upshifting
schedules. Each line schedule is defined by two points on the plot, which are specified by the corresponding engine speed and engine torque. Whenever an operating point exceeds the blue
line, it will upshift and whenever it exceeds the red line, it will downshift. The shifting schedules were changed in order to make the small 6-cylinder SI engine achieve comparable performance
and meet the torque requirements of drive cycles.
z
-400
800 1000 1200 1400 1800 1800 2000
Speed (rpm) Figure 2-10 Old Shifting Schedules
Ft 800
2.6 Drive Cycles
CYCCOMMUTER
0 50 100 150 200 250 300 350
time (sac)
Figure 2-12 Speed - Time of Commuter Cycle
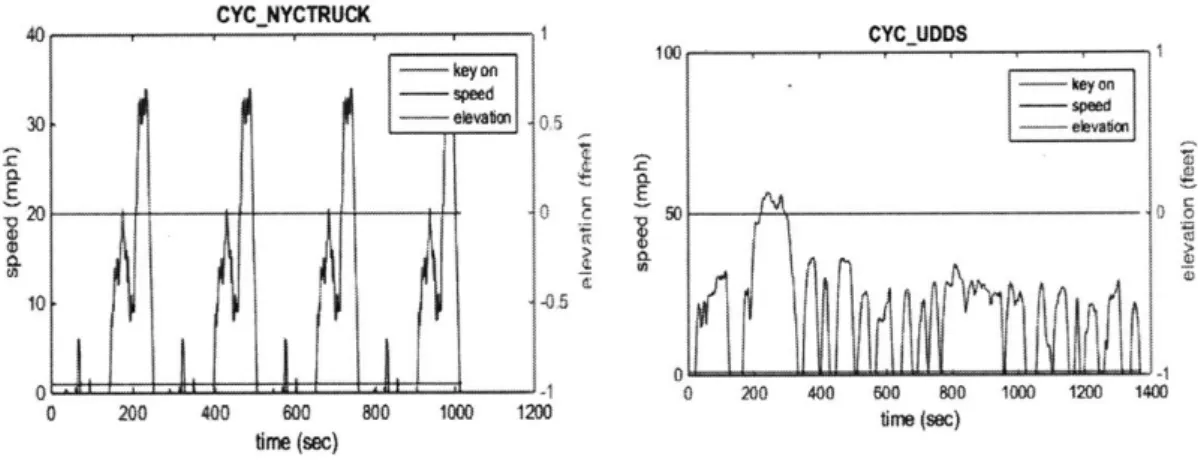
CYC NYCTRUCK
0 200 400 600 800 1000
time (sac)
Figure 2-14 Speed - Time of NYC Truck
CYCHWFET
0 100 200 300 400 500 600 700 800 tim (sac)
Figure 2-13 Speed - Time of H WFET
100 C a
CL
1200 CYCUDDS 0 200 400 600 800 1000 1 ftm (sac)Figure 2-15 Speed - Time of UDDS
200 1400
The vehicle model was exercised over four drive cycles - Commuter, HWFET, NYC TRUCK, and UDDS in the study. Figure 2-12 to Figure 2-15 shows how speed varies as a function of time for the four drive cycles respectively. The commuter cycle is the most moderate drive cycle, and the
other ones have more fluctuations in speed.
2.6.1 Commuter
There are no vehicle stops in the commuter cycle. The vehicle needs to drive 4 miles in 329s
a aL
E
30 20 4.10
'0 50 I I 1CYC CoraWUTER
a
0 0
time (sec)
Figure 2-16 Speed - Time of Commuter Cycle
CYCCOMMUTER 80
*60
40 -w 20 0 20 40 60 80 100 Speed (mph)Figure 2-17 Histogram of Speed Spread in Commuter Cycle
Table 2-4 Summary of the Commuter Drive Cycle
Time Distance Max speed Average speed Max acceleration Max deceleration Average Acceleration Average deceleration Idle time No. of stops Max up grade Average up grade Max down grade Average down grade
329s 4 miles 55 mph 43.67 mph 3.37 ft/s2 -6.6 ft/s2 0.92 ft/s2 -6.32 ft/s2 40s 1 0% 0% 0% 0% 2.6.2 HWFET
HWFET has more fluctuations in speed compared to the commuter drive cycle. It requires the
vehicle to drive 10.26 miles in 765s with an average speed of 48.2 mph. The acceleration is higher than that of the commuter cycle.
Sc / / / C 0 50 100 150 200 250 300 350
CYCHWFET
100 .
bir(sec)
Figure 2-18 Speed - Time of HWFET Cycle
Q 0 0 0 30 '~20 10 00 00 CYCHWFET 50 100 Speed (mph)
Figure 2-19 Histogram of Speed Spread in HWFET Cycle
Table 2-5 Summary of HWFET Drive Cycle
765s 10.26 miles 59.9 mph 48.2mph 4.69 ft/s2 -4.84 ft/s2 0.64 ft/s2 -0.72 ft/s2 6s 1 0% 0% 0% 0% 2.6.3 NYC truck E V 0 0 0. 0 100 200 300 400 508 600 700 8 Time Distance Max speed Average speed Max acceleration Max deceleration Average Acceleration Average deceleration Idle time No. of stops Max up grade Average up grade
Max down grade Average down grade
200 400 60 0 oo 1000 120 60 040 01 0~ CYCNYCTRUCK
02l
SO Speed (mph)Table 2-6 Summary of the NYC Truck Drive Cycle
Time Distance Max speed Average speed Max acceleration Max deceleration Average Acceleration Average deceleration Idle time No. of stops Max up grade Average up grade Max down grade Average down grade
1016s 2.13 miles 34 mph 7.55 mph 6.42 ft/s2 -6.13 ft/s2 1.82 ft/s2 -2.13 ft/s2 529 s 20 0% 0% 0% CYC.NYCTRUCK 30 04 0 lime (sec)
Figure 2-20 Speed - Time of NYC Truck Cycle
100
Figure 2-21 Histogram of Speed Spread in NYC Truck Cycle
2.6.4 UDDS
The UDDS drive cycle is an aggressive cycle. It requires the vehicle to drive 7.45 miles in 1369 miles with an average speed of 19.58 mph. There are 17 stops in this cycle. The maximum
acceleration and the maximum deceleration are the same, both of which are 4.84 ft/s2
. CYCJUDDS CYCUDDS 100
~25
CCUD S20 CMU 0 50 100 o 200 400 600 800 1000 1200 1400 Speed (mph) fime (sec)Figure 2-22 Speed - Time of UDDS Cycle Figure 2-23 Histogram of Speed Spread in UDDS Cycle
Table 2-7 Summary of the UDDS Drive Cycle
Time 1369s Distance 7.45 miles Max speed 56.7 mph Average speed 19.58 mph Max acceleration 4.84 ft/s2 Max deceleration -4.84 ft/s2 Average Acceleration 1.66 ft/s2 Average deceleration -1.9 ft/s2 Idle time 259 s No. of stops 17 Max up grade 0% Average up grade 0%
3 SIMULATION DATA ANALYSIS
3.1 Commuter
Ford F550 w/ Diesel Engine - Commuter
43
.... . . *... *
800 100 1200 1400 Im law0 2M0
Speed (rpm)
Figure 3-1 Ford F550 Diesel Engine - Commuter
Ford F550 wl Downsized SI Engine -Commuter
3W4
0*
1)t
...
Speed (rpm)
Figure 3-3 Ford F550 6-Cylinder Engine -Commuter
00 0 20 00 0 4280
Ford F550 wI SI Engine - Commuter
0 0 0
w0
Speed (rpm)
Figure 3-2 Ford F550 S1 Engine - Commuter
Ford F550 w/ Si Engine and changed transmission
Figure 3-4 Ford F550 6-Cylinder SI Engine with Modified transmission
Figure 3-1 to Figure 3-4 show the operating points of Ford F550 with different engines,
the conventional diesel engine, as well as the 12-cylinder SI engine, the 6-cylinder SI engine, and the 6-cylinder SI engine with changed transmission. The different symbols
represent the operating points at different gears: blue cross- 1st gear, pink circle - 2nd
gear, red diamond - 3rd gear, green triangle - th gear and yellow plus - 5th gear.
Commuter cycle is a rather mild drive cycle, and all the three engines are operating with high efficiency. Most of the operating points are in the upper part of the plots. Only the plot of the 6-cylinder SI engine with the original transmission shows a few points hitting the maximum torque curve. But in Figure 3-4, there are no points on the maximum
am0 600
z (D
torque curve, which shows that the changed transmission and shifting schedules did improve the small SI engine's performance.
3.2 HWFET
Ford F550 Diesel Engine -HWFET
00
P1 4D
.. 0... ..
m lo0 120 140 "M 1a0
A-Speed (rpm)
Figure 3-5 Ford F550 Diesel Engine -HWFET
Ford F550 w/ downsized SI Engine -HWFET
0 / 00 *~ 0 0>0 1000 1000 200 30 300 200 40.. . .. .. Speed (rpm)
Figure 3-7 Ford F550 6-Cylinder Engine - HWFET
700 0 E300 20D 100 0 4106
Ford F550 w/ SI Engine -HWFET
-<
I
00m 1ow0 120 1400 1000 1a8 2M0
Speed (rpm)
Figure 3-6 Ford F550 12-Cylinder SI Engine - HWFET
Ford F550 w/ SI Engine and changed transmission
A*
'
Figure 3-8 Ford F550 6-Cylinder with Modified Transmission
In the HWFET cycle, all the four plots have operating points on the maximum torque curve, although the vehicle is capable to meet the speed requirement. The average speed of HWFET
cycle is the highest among these four cycles, and the vehicle needs to operate at high speed
almost during the entire drive cycle. So the engines had to operate at a higher rpm compared
z40 200 40 400 30 -200
~2W
00 03.3 NYC Truck
Ford F550 Diesel Engine -NYC Truck
K 8
ID 0
t! o
WO 100 1200 1A0 100 1000 2M0
Speed (rpm)
Figure 3-9 Ford F550 Diesel Engine -NYC Truck
Ford F550 w/ Downsized SI Engine -NYC TRUCK
400, 350.
~300.
00 200 - 0 33 IM * 10 1000 ism 2=0 2*10 3=0 3000 400 Speed (rpm)Figure 3-11 Ford F550 6-cylinder SI Engine -NYC Truck
00 E son z S400 0* 1300 0
Ford F550 wI SI Engine - NYC TRUCK
0
... A
... ... ...
~i
WOow 1 12 M 14M0 Iwo law 2M0
Speed (rpm)
Figure 3-10 Ford F550 12- cylinder SI Engine - NYE
Truck
Ford F550 w/ SI Engine and changed transmission
4*
4K 0 1c
Figure 3-12 Ford F550 6-cylinder SI Engine with
modified transmission
The NYC truck cycle requires the most on and off 's of the vehicle. From the four figures above, it is apparent that all the four engines operate frequently at low efficiency points due to the high
number of starts and stops. The majority of the operating points concentrate in the lower left
part of the engine map, which is a low-efficiency region.
00
Ford F550 Diesel Engine -UDDS * 0o 0
~
0 00~ 00 00 x00 10 Speed (rpm)Figure 3-13 Diesel Engine - UDD
1a0 20S
Ford F550 w/ downsized SI Engine -UDDS
0 0 0 00
00 ' O0D
00
1OD0 1Iwo 2000 250D 3000 3WO0 40DO
Speed (rpm)
Figure 3-15 6-Cylinder SI Engine - UDDS
90
1m
700
Ford
Vr
Ford F550 w/ SI Engine - UDDS
0 0 0
-
4
Speed (rpm)
Figure 3-14 12-Cylinder SI Engine - UDDS
F550 w/ Si Engine and cbanged transmission
0 .01 '
~~31
**
Fiur 3-4 2CyideQl nin U
F55 W/ -I Engin mnd ched trm m its
Figure 3-16 Ford F550 6 Cylinder SI Engine with modified transmission
Similar to the NYC Truck cycle, the four plots all have operating points on the maximum torque
curve. The operating points are spread out in the map and there are a lot of low efficiency operating points in the right corner and left corner.
3.4 UDDS
00 am 460 -400 E~25D
00 10 604 SIMULATION RESULTS
Although all the simulation results are included in the following chapters. It needs to be noted that the 6-cylinder engine in this study was not able to follow the speed trace required by the selected drive cycles, and only results where the different engines missed the test cycle by the same amount are comparable. Otherwise, comparisons won't be valid if the engines didn't do the same amount of work over the cycle.
In this study, the 12-cylinder SI engine and the 6-cylinder SI engine with the changed
transmission provided essentially identical performance to the baseline diesel, so their results were comparable.
4.1 Full Payload
4.1.1 Miles Per Gallon - Gasoline Equivalent (MPG-GE)
Figure 4-1 shows a histogram of the MPG-GE values of the four engines in the four drive cycles. In all the four drive cycles, the diesel engine's fuel economy was always the best, and was able to meet all the requirements of the drive cycles. The big SI engine' s mpg is a little lower than that of the diesel engine, but is the highest among the other SI engines.
12 10 8.6 8 7.72 7 6 4 2 0 Commuter a Diesel a 10.1 8.8 8.3 8.1 HWFET SI Engine 930Nm NYC TRUCK a SI Engine 465 Nm 8 7.9 7.1 6.5 6.5
~;6j
6.56.66.1 6 UDDS Average-465Nm with changed transmission
DRIVE CYCLE COMMUTER
Table 4-1 MPG-GE of Different Engine Options
HWFET NYC TRUCK DIESEL SI ENGINE 930 NM SI ENGINE 465 NM CHANGED TRANSMISSION 8.6 7.6 10.1 -11.6% 8.8 4.6 -12.9% 4.3 7.2 -16.3% 8.3 -17.8% 4.2 -8.7% 6.5 -18.8% 7 -18.6% 8.1 -19.8% 4 -13.0% 6.5 -18.8%
4.1.2 Fuel Consumption- Gallons Per Hundred Miles (GPHM)
On average, the diesel engine consumed 13.8 gallons fuel per hundred miles. The fuel consumed by the 12-cylinder SI engine increased by 11.3% from 13.8 GPHM to 15.5 GPHM. The 6-cylinder SI engine with changed transmission and modified shifting schedules has the worst fuel
economy. It consumed 20.3% more than what consumed by the diesel engine.
30 -25 20 15 13213' 914 11.6 10 5 0 Commuter a Diesel 11.4 12 12.3 HWFET U SI Engine 930Nm 25 23.323.8 NYC TRUCK a SI Engine 465Nm 15.415.4 15.516.316.8 14.1 UDDS Average
W 465Nm with changed transmission
Figure 4-2 Comparison of GPHM at Full Payload
UDDS
8
Table 4-2 MPG-GE of Different Engine Options at Full Payload DRIVE COMM CYCLE DIESEL 11.6 SI ENGINE 13.2 930 NM SI ENGINE 13.9 465 NM CHANGED 14.3 TRANSMI-SSION LUTER HWFET 0 9.9 NYC TRUCK 0 21.7 UDD S AVER -AGE 0 12.5 0 13.8 0 13.8% 11.4 15.2% 23.3 7.4% 14.1 12.8% 15.5 11.3% 19.8% 12.0 21.2% 23.8 9.7% 15.4 23.2% 16.3 16.9% 23.3% 12.3 24.2% 25.0 15.2% 15.4 23.2% 16.8 20.3% 4.2 Half Payload
4.2.1 Miles Per Gallon - Gasoline Equivalent (MPG-GE)
With the payload decreased by half, the average fuel economy of the three engines all improved. But the trend stays the same. Diesel engine still has the best fuel economy, and the
small SI engine with modified transmission consumed the most fuel in most of the drive cycles
except the UDDS drive cycle. In the UDDS drive cycle, changing the transmission improved the 6-cylinder engine's fuel efficiency from 7.6 mpg to 7.9 mpg.
12 106 10 8.6 8.17. 8 4 2 0 Commuter 0 Diesel 9.9 9.4 HWFET a SI Engine 930Nm 5'5 NYC TRUCK 3 S Engine 465Nm 9.7 87 9.1 .8.1 7.6 7. 8.1 UDDS Average
. 465Nm with changed transmission
Figure 4-3 Comparison of MPG-GE at Half Payload
Table 4-3 MPG-GE of Different Engine Options at Half Payload
COMMUTER HWFET NYC
TRUCK DIESEL SI ENGINE 930 NM SI ENGINE 465 NM CHANGED TRANSMISSION 9.7 8.6 8.1 7.8 0 11.4 -11.3% 9.9 -16.5% 9.4 -19.6% 9 0 5.5 0 9.7 0 -13.2% 5.1 -17.5% 5 -21.1% 4.7 -7.3% 8.7 -10.3% -9.1% 7.6 -21.6% -14.5% 7.9 -18.6%
4.2.2 Cycle-averaged Fuel Consumption- Gallons Per Hundred Miles (GPHM)
On average over the 4 cycles (with equal weighting factors), it takes the diesel engine 11 gallons
fuel to go 100 miles. The 12-cylinder SI engine consumed 10.9% more, the 6 - cylinder engine consumed 17.9% more and after changing the transmission consumed 21.6% more.
25 21.3 19.6 20 20 15 3 12 8 15 0
Commuter HWFET NYC TRUCK
a Diesel H SI Engine 930Nm ESI Engine 465Nm
13.212 7 13.214014.5
11.5
1-10.3
UDDS Average
N 465Nm with changed transmission
Figure 4-4 Comparison of GPHM at Half Payload Table 4-4 GPHM of Different Engine Options at Half Payload
COMM -UTER HWFET NYC TRUCK UDDS 10.3 0 8.8 0 18.2 0 10.3 0 11.0 SI ENGINE 930 NM SI ENGINE 465 NM CHANGED TRANSMI-SSION 11.6 12.3 12.8 12.6% 10.1 14.8% 19.6 7.7% 11.5 11.7% 12.3 10.9% 19.4% 10.6 20.5% 20 9.9% 13.2 28.2% 13.3 17.9% 24.3% 11.1 26.1% 21.3 17.0% 12.7 23.3% 13.5 21.6% 4.3 Zero Payload
4.3.1 Miles Per Gallon - Gasoline Equivalent (MPG-GE)
Each engine's performance is similar to the previous cases. The diesel engine's fuel economy is the best and the small 6-cylinder SI engine's fuel economy is the worst. Changing the
transmission and shifting schedules not only make the small SI engine able to follow the required traces of the drive cycles but also make Its fuel consumption lower in the UDDS drive cycle. DRIVE CYCLE DIESEL AVER-AGE 0
41 9.7 9.28.7 Commuter U Diesel 351 12.9 11.3 10 HWFET Engine 930Nm 14 12 10 8 6 4 2 0 12.1 11 1. 9.8 9.6 UDDS Average
Q 465Nm with changed transmission
Figure 4-5 Comparison of MPG-GE at Zero Payload
Table 4-5 MPG-GE of Different Engine Options at Zero Payload
HWFET 12.9 NYC TRUCK 6.8 SI ENGINE 930 NM SI ENGINE 465 NM CHANGED TRANSMISSION 9.7 9.2 8.7 -11.8% 11.3 -12.4% 6.5 -4.4% 11 -9.10% -16.4% 10.7 -17.1% 5.9 -13.2% 9.2 -24.00% -20.9% 10 -22.5% 5.7 -16.2% 9.8 -19.0%
4.3.2 Cycle-averaged Fuel Consumption- Gallons Per Hundred Miles (GPHM)
Figure 4-6 also shows the increasing trend of cycle averaged fuel consumption of the SI engines compared to the base diesel engine, for the case of no payload. The average fuel consumption
of the diesel engine is 10 gallons per hundred miles. The 12-cylinder SI engine consumed about
665
5.9 5.7
NYC TRUCK
a SI Engine 465Nm
DRIVE CYCLE COMMUTER
DIESEL 11
UDDS
20 18 16 14 12 10 8 6 4 2 0 Commuter 10 H E.8 . HWFET NY-T917.5 14. NYC TRUCK 8U3 UDS 12.612.3 1Aea Average * Diesel MSI Engine 930Nm U SI Engine 465Nm S1465Nm with changed transmission
CHANGED SI ENGINE 465 SI ENGINE 930 DIESEL TRANSMISSION NM NM 11.5 10.9 10.3 9.1 COMMUTER +26.4% +19.8% +13.2% 10 9.3 8.8 7.8 HWFET +28.2% +19.2% +12.8% 17.5 16.9 15.4 14.7 NYC TRUCK +19.0% +15.0% +4.8% 10.2 10.9 9.1 8.3 UDDS N +22.9% +31.3% +9.6% 0 .. 11.6 11.4 10.4 9.3
IAVERAGE
+23.3% +20.3% +9.3% DRIVE CYCLE5 COST OF OWNERSHIP
5.1 Assumptions
The cost of ownership calculation is based on Edmunds True Cost to Own® (TCO*) [8]with customized changes. Edmunds True Cost to Own® (TCO*) is proprietary data that helps customer estimate the total five-year cost of buying and owning a vehicle. At the end of the 5 year period, the vehicles is sold.
Ownership expenses are estimated for a five-year period. The factors taken into account are:
- Depreciation: how much value the car loses each year.
- Insurance premiums: the average cost of insuring the car.
- Interest on financing: the amount of interest paid over five years.
- Taxes and fees: the total of all sales tax, fees and registry costs each year.
- Fuel: how much you have to pay for the type of fuel that the car requires: regular or premium gasoline or diesel fuel.
- Maintenance: the total cost of performing all the scheduled maintenance found in the
vehicle's owner's manual.
- Repairs: the projected cost of fixing common mechanical problems for this vehicle.
5.1.1 Depreciation
The depreciation is the amount by which the value of a vehicle declines from its purchase price to its estimated resale value. The purchase price employed is the vehicle's total cash price, minus any taxes and fees include in that amount. The resale value is estimated assuming the vehicle will be in "clean" condition, will be driven 12,000 miles per year (on average, medium duty cars drive about 12,000 miles per year, as shown in Figure 5-3 [9]) and will be sold to a private party.
5.1.2 Insurance
Estimated average annual insurance premium. The premium has been determined based on annual premium data for defined driver profiles and coverages (liability, comprehensive and
collision) from a major national insurer, for a vehicle operate in MA. Personal information not taken into consideration.
5.1.3 Financing
This is the interest expense on a loan in the amount of the Total Cash Price, assuming a 10% down payment and a loan term of 60 months. The interest rate used is the prevailing rate that banks and other direct automotive lenders are currently charging consumers in MA who have above average credit scores.
5.1.4 Taxes & Fees
This consists of the base sales (or use) taxes, license and registration fees MA, and gas guzzler tax if applicable. These taxes and fees are based on a percentage of the purchase price, and
decrease as the vehicle ages and loses its value.
5.1.5 Fuel
The fuel cost is calculated by using the average fuel consumption value for each engine from simulation results with the average 2016 fuel price, assuming driving 12,000 miles per year. Same price for the 5 years.
5.1.6 Maintenance
Estimated expense of the two types of maintenance: scheduled and unscheduled.
Scheduled maintenance is the performance of factory-recommended items at periodic mileage and/or calendar intervals.
Unscheduled maintenance includes wheel alignment and the replacement of items such as the battery, brakes, headlamps, hoses, exhaust system parts, taillight/turn signal bulbs, tires, and wiper blades/inserts.
0l -a cn U 5 YR YEARS5 YEAR 4 YEAR 3 YEAR 2 YEAR 1
2
0 TOA C 0 TTL0 Lfl n V :3 w -$20,790 $2,498 $2,784 $3,143 $3,568 $8,796 DEPRECI- ,L. m 0" 0-~
-0 w =r D a-$4,149 $200 $53 $89 $1,249 $1,576 TX FINACIN rD80
CL0 0 0 _0 0 -0 D 0 3 0~
LA 0. $6,489 $1294 $1,51 $120 $1,167 $1,128 INUANCE 0 0 -L r C D 0 0 i 0 CD =r :E 0.) rD NJ c 0 n 0~
ti 0~~
0 5r 0 0 r+ r 33.1 45.% 4.4% 8.6 34.% 193% UEL/OTAMaintenance Repairs insurance 4% 1% 10% Depreciation 33% Fuel 33%
Taxes & Fees
12% -.. Financing
7%
Figure 5-1 Diesel Engine Cost of Ownership Breakdown
5.2.2 SI Engine
Compared with the cost of the diesel engine, the fuel cost constitutes a higher portion of the
total cost, and the depreciation is less. The fuel cost of the 12-cylinder SI engine is 1,407 dollars higher, the maintenance cost is 2,026 dollars higher, and the repair cost is also 104 dollars
higher, as shown in Table 5-2. However, because of the higher initial purchase cost of the vehicle with the diesel engine, the total cost of ownership of the diesel option is still
CHANGE 5YR TOTAL YEAR5 FROM DIESEL $1,305 $1,453 $1,638 $1,864 $9,585 DEPRECIA-TION $5,514 $3,439 $21,956 $6,048 $4,408 $801 $58,010 $141 $153 $4,654 $1,294 $1,020 $407 $8,974 $306 $430 $4,519 $1,251 $1,905 $278 $683 $697 $4,387 $1,208 $445 $117 -$1,628 -$1,060 $1,407 $0 $2,026 $104 -$4,096 $1,009 $955 $4,260 $1,167 $699 $0 $9,954 $3,375 $1,205 $4,135 $1,128 $338 $0 $19,767 54.6% 47.2% 50.5% 45.5% TAXES & FEES
FINANC-ING FUEL INSURAN-CE MAINTENANCE REPAI-RS TOTAL
2016
$
FUEL/TOTAL -$4,945 $15,845 $10,141 $9,175 U, 0p NJ In YEAR 4 YEAR 3 YEAR 2 YEAR 1 22.8% 4.8% 37.8%Maintenance Repairs
8% 1%
Depreciation
Insurance 27%
10%
Fuel Taxes & Fees
38% 10%
*V Financing 6%
Figure 5-2 SI Engine Cost of Ownership Breakdown
5.3 Effect of Annual vehicle mileage
As we have seen in 5.2, the fuel cost accounts for a large proportion of the total costs. The fuel cost itself is heavily influenced by annual mileage and fuel price. Figure 5-3 shows the annual mileage of different applications and scenarios.
Class 8 Truck Transit Bus Para. Shuttle 1 Delivery Truck School Bus Police Light Truck Light-Duty Vehicle Car Motorcycle 0 5,000 10,000 15,000 20,000 25,000 30,000 35,000 40.000 45,000 50,GOO 55,000 60,000 65,000 70,00075,000 Annual Miles per Vehicle
LF 20A15e A esw nsp
Pnftedv&.: AW#3
i Diesel modified transmission -- S 465 Nm $1.10 E SI 930Nm -+- Diesel modified transmission m SI 465 Nm -- SI 930Nm $1.05 $1.00 E Cy $0.95 0. 4.& 0 $0.90 $0.85 $0.80 11000 12000 13000 annual mileage 14000 15000
Figure 5-4 Influence of Increasing Annual Mileage: the bars are the total cost, the lines are the cost per mile.
What will happen if we change the annual mileage in the assumption is shown in Figure 5-4? Increasing annual mileage will certainly increase the 5 years total cost. But if we consider the average cost per mile, the cost is monotonically decreasing. The diesel engine always costs substantially more than the other options.
5.4 Effect of fuel price
Although the cost of fuel is lower for the diesel vehicle, but the total cost of ownership is still higher than the gasoline vehicle, as we have explained before, mostly due to the lower
depreciation rate of a gasoline vehicle. And if the price of diesel keeps increasing, the advantage of lower fuel cost will disappear and the total cost of ownership of a diesel vehicle will keep increasing.
As shown in Figure 5-5, gasoline and diesel prices have fluctuated a lot in the past. After 2004, the price of diesel is always higher than that of gasoline. Although the unit price of diesel is higher, because of the high efficiency of the diesel engine, 5-year fuel cost of the diesel vehicle
- $68,000 - $66,000 - $64,000 - $62,000 - $60,000 - $58,000 - $56,000 - $54,000 - $52,000 - $50,000 IA 0 0 00
is still lower than gasoline. However, if the price differential keeps increasing like the prediction presented in Figure 5-5. 5-year fuel cost of diesel may be higher than gasoline.
$42,000 $37,000 $32,000 $27,000 . $22,000 $17,000
$12,000.
....
..-...
.... ..-- ...-... 1996 2000 2004 2008 2012 2016 2020 2024 -4-Diesel -- GasolineFigure 5-5 Five Years Fuel Cost
$85,000 - -$75,000 --$65,000 $55,000 $45,000 1996 2000 2004 2008 2012 2016 2020 2024
5.5 Effect of new technologies
The power an internal combustion engine can produce is proportional to the amount of air flow under appropriate combustion conditions. For a naturally aspirated engine, that airflow is approximately in proportion to the displacement of the engine and the engine speed [101. SwRI evaluated a range of potential fuel saving technologies for trucks in a project for NHTSA [11, 12, 13, 14, 15]. Several new technologies which can improve an SI engine's efficiency and thus decrease the fuel cost of an SI engine listed in Table 5-3 will be discussed in the paragraphs following.
Table 5-3 summarizes the estimated efficiency improvement potentials of the technologies. And
Table 5-4 summarizes the assumed cost of implementing these technologies. Figure 5-7 compares the turbocharger-related cost and benefit estimates from the rulemaking to one possible pathway for adding the new technologies. We will utilize the red solid line in Figure 5-7 to estimate the improvement of efficiencies and the decrease of cost.
The SI engine used in the simulation is a 12-cylinder engine, so we need to multiply the cost in Figure 5-7 by a factor of 2. The start point is 1-stage + GDI. We will look into the benefit of 2-stage turbo, Miller cycle, 48V hybrid + VGT and e-boost.
Table 5-3 Comparison of Estimated Efficiency from Rulemaking and Suppliers [20]
TECHNOLOGY BASELINE RULEMAKING
ESTIMATE [16] FEV SUPPLIER ESTIMATE ESTIMATES COOLED EGR 2-STAGE TURBO MILLER CYCLE AXIAL FLOW TURBINE DIESEL VGT 2-STEP VCR E-BOOST 48V HYBRID E-BOOST + 48V HYBRID Turbo, VVL, VVT Turbo, VVL, VVT, cooled EGR Turbo, VVL, VVT, cooled EGR Turbo, VVL, VVT, cooled EGR Turbo, VVL, VVT, Miller cycle Turbo, VVL, VVT, cooled 4EGR 1-stage turbo Conventional vehicle 1-stage turbo 3.6% [17,18,19] 2.5% 4-4.7% 4.4% '-5% 4.2% Uncertain 6.2% 2% -5% 10% - 15% 15%-20%
Table 5-4 Comparison of Estimated Costfrom Rulemaking and Suppliers [20] TECHNOLOGY TURBO + GDI VGT 2-STAGE TURBO COOLED EGR MILLER CYCLE 2-STEP VCR E-BOOST 48V HYBRID E-BOOST + 48V HYBRID BASELINE 14 ->14 14-> 13 V6 -14 1-stage turbo, 13/14 1-stage turbo, 13/14 Turbo 1-stage turbo, 13/14 1-stage turbo, 13/14 48v hybrid Base stop/start 1-stage turbo RULEMAKING COST ESTIMATE $409 -$554 $326 -$471 $54 - $209 $310 $180 $1,087 FEV COST ESTIMATE $454 $297 - $333 ($391) $67 $184 - $226 $116 - $149 $0 -$226 $124-$170 $784 OTHER COST ESTIMATE $67 (VGT) $400 $600 - $1,000 $800 - $1,400
2 +]bcy
co+*-boG"
+48V *+GT
30%
-ICCT. VS to 14 -*- SPA/NI4TSA, V6 to 14 m CCT', I4 to IS m O EPA/I4TSA toal
Direct Manufacturing Cost
Figure 5-7 Cost of Improvement of SI engine Efficiency [20]
Figure 5-8 shows the recalculated fuel cost based on the improved efficiency and Figure 5-9 shows the recalculated new 5-year total cost. From Figure 5-8 we can see, after adding new technologies, the fuel costs of the SI engine decrease a lot from the baseline SI engine and all of them are
less
than the fuel costof
the diesel engine.In
particular, the e-boost engine reduces fuel cost the most, by nearly $5,000 dollars. Figure 5-9 shows the total cost of ownership after addingon
the cost of these technologies. The costof
the diesel engine is the highest, which is more than$
62,000. Adding a new technology can cut the total cost from $1,000 to $3,000. Although the fuel cost with e-boost drops $5,000, the total cost doesn't drop alot
because of the high cost of that technology.$23,000 $21,000 $19,000 $17,000 $15,000 Diesel U Fuel Cost $21,576 $21,956
Figure 5-8 Fuel cost in different cases
$64,000 $62,000 $60,000 $58,000 $56,000 $54,000 $52,000 $50,000 $48,000 Diesel 0 Total Cost $62,713 2-stage Baseline SI turbo $56,092 $54,664
Figure 5-9 Five Years Total Cost
Baseline SI +48V +VGT -2-stage turbo $18,113 2-stage turbo $20,528 + e-boost $17,345 +Miller Cycle $19,760 +Miller Cycle $53,896 +48V +VGT -2-stage turbo $54,349 + e-boost $54,481
$1.05 $1.00 $0.95 $0.90 $0.85 $0.80 $0.75 $0.70 $0.65
a Cost Per Mile
Diesel $1.05
Baseline SI $0.93
+48V +VGT -2-stage turbo +Miller Cycle -2-stage turbo
$0.91 $0.90 $0.91
+ e-boost $0.91
Figure 5-10 Cost Per Mile
5.6 C02 Emissions
C02 emissions from a gallon of gasoline are about 15.7% lower than from a gallon of diesel [21]. However, a vehicle with a gasoline engine generally produces more C02 due to higher fuel consumption over the same travel distance. Figure 5-11 shows a comparison of the amount of
C02 emissions of the diesel engine and several SI engines. The C02 emission of the diesel engine is the lowest. The C02 emission of the SI engine with e-boost is comparable to that of the diesel, only slightly higher. Despite the higher cost of ownership, the diesel engine still have an
900 800 700 600 500 0 E 300
8
200 100 0 +48VBaseline 2-stage +Miller +VGT -2- +
e-SI turbo Cycle stage boost
turbo
a
C02 emission (g/km) 689 839.6 790.9 763.2 714.3 693.8Figure 5-11 C02 emission comparison of the diesel engine against the baseline SI engine and the SI engine added on different techonologies
6 CONCLUSIONS
Results from chapter 4 shows that the large SI engine (slow speed) is about 9-12% less efficient than the diesel engine. Upspeeding to compensate for lower torque in smaller SI engines
decreases the efficiency of the engine. The small SI engine (high speed) not only is about 17-20% less efficient than the diesel but also doesn't have comparable performance. The performance can be improved at a cost of slightly worse fuel economy (20-23% less efficient than the diesel). Chapter 5 suggests that baseline gasoline vehicle is about $6,000 to $9,000 cheaper, which is about 10% decrease in Cost-of-ownership, with comparable performance. All the previous conclusions were drawn under the assumption that the driver drives 12,000 miles a year. Increasing annual mileage will decrease average cost per mile. When comparing the total cost of ownership, the SI engines are always the winner in this study. However, it needs to be noted that the diesel engine has an advantage of lower C02 emissions, if we are also concerned about
![Figure 1-1 Truck sales by manufacturer from 2011 to 2015 [1]](https://thumb-eu.123doks.com/thumbv2/123doknet/14110174.466506/13.917.260.642.379.635/figure-truck-sales-manufacturer.webp)

![Figure 1-7 Examples of Trucks in 8 Truck Classes [3]](https://thumb-eu.123doks.com/thumbv2/123doknet/14110174.466506/16.917.309.594.285.698/figure-examples-trucks-truck-classes.webp)