Automation Solutions for E-Commerce Multi-Item Packing by
Andrew Walker
B.S. Mechanical Engineering, Tufts University, 2011
Submitted to the MIT Sloan School of Management and the Department of Mechanical Engineering in Partial Fulfillment of the Requirements for the Degrees of
Master of Business Administration and
Master of Science in Mechanical Engineering
In conjunction with the Leaders for Global Operations Program
at the MASSACHUSETTS INSTITUTE
OF TECHNOLOGY Ci
Massachusetts Institute of Technology U
JUN 0 7 2018
1
May 2018 C
2018 Andrew Walker. All rights reserved.
LIBRARIES
The author hereby grants to MIT permission to reproduce and to distribute publicly paper and electronic copies of this thesKj3cument in whole or in part in any mediumnow w n/br heraft rcfeated.
Signature of Author
Signature redacted
MIT Sloan School of Management MIT Mechanical Engineering May 11, 2018
Certified by
Signature redacted
tIikolaos Trichakis, Thesis Supervisor Assistant Professor, Operations Management, MIT Sloan School of Management
Certified by
Signature redacted
Maria Yang, Thesi,-%upervisor Professor, Mechanical Engigeering, MIT School of Engineering
Accepted by
Signature redacted
Maura Herson, Director of MIT Sloan MBA Program MIT Sloan School of Management
Accepted by
Signature redacted
Automation Solutions for E-Commerce Multi-Item Packing by
Andrew Walker
Submitted to the MIT Sloan School of Management and MIT School of Engineering Mechanical Engineering Department on May 11th, 2018 in Partial Fulfillment of the Requirements for the Degrees of Master of Business Administration and Master of
Science in Mechanical Engineering Abstract
As Amazon continues to experience a rapid growth in its e-commerce business, fulfillment efficiency needs to through safe implementation of advanced technology to create a better customer experience. Amazon has heavily invested in automating its outbound product sortation process that merges picked items but has yet to develop automation for multi-item packing. Individual item manipulation has been proven very challenging to automate due to the over 500 million unique products offered. This thesis proposes a container manipulation solution that
integrates industrial robotics and other equipment with upstream sortation technology to automate the packing process. A physical prototype was built to test the concept and measure proficiency in critical quality metrics such as item accuracy, product damage, and packing density/orientation. Additionally, an operational simulation for the system was developed to determine the optimal capacity sizing for the integrated sortation and packing system. Lastly, sensitivity analysis on a financial model was performed to optimize for the net present value (NPV) and payback period. After a series of controlled experiments and process improvements, the prototype produced promising results, given the rudimentary nature of the prototype. The system generated item accuracy defects at 2%, product damage defects at 2% and packing orientation defects at 17%. While these results are not adequate to be used in live operation, a development path to
acceptable performance appears attainable. Furthermore, implementation of the technology would generate approximately and $100M in NPV across the global fulfillment network
Thesis Advisor: Nikolaos Trichakis
Title: Assistant Professor, MIT Sloan School of Management Thesis Advisor: Maria Yang
Acknowledgements
I would like to thank my managers and colleagues in the Advanced Technology and R&D
Center Operations teams. I received excellent support, resources and buy-in from these organizations which resulted in a rewarding internship experience. Specifically, I would like to thank my project champion, Jackie Underberg, for providing support and clearing barriers throughout the process. Additionally, I would like to thank my supervisors Terri Creech and
Sam Garrett for their continual guidance on technical and organizational challenges. Lastly, I would like to thank Tyson Wittrock, Tri Quach and Thomas Vekkakis for supporting the technical development and testing process.
Table of Contents
L is t o f F ig u re s ... 7
L is t o f T a b le s ... 8
1 In tro d u c tio n ... 9
1.1 Am azon E-Com m erce Fulfillm ent ... 9
1.2 Problem Statem ent ... 9
1.3 Project Hypothesis ... 10
1.4 Project Approach ... 10
1.5 Thesis O verview ... 11
2. Am azon Fulfillm ent ... 12
2.1 Introduction ... 12 2.2 Inbound ... 12 2.3 Storage ... 12 2.4 O utbound ... 13 2 .4 .1 P ic k ... 1 3 2.4.2 Sortation ... 14 2.4.3 Packing ... 14
2.5 Technology Developm ent ... 15
2.5.1 Advanced Technology O rganization ... 15
2.5.2 C hallenges of item handling ... 16
2.5.3 Autom ated Sortation Replacem ent for A FE ... 17
3. Proposed packing solution ... 18
3.1 Overview ... 18
3.2 Process Flow ... 19
3.3 System Design ... 20
3 .4 R is k s ... 2 1 4 T e s tin g ... 2 2 4.1 Prototype Hardw are ... 22
4.2 M etrics ... 23
4.3 Experim ental Design ... 23
4.4 Execution ... 24
5 Results ... 25
5.1 O verview ... 25
5.2 Experim ental R esults ... 25
5.2.1 Experim ent 1: Prelim inary Accuracy Evaluation... 25
5.2.2 Experim ent 2: Follow -up Accuracy Evaluation ... 26
5.2.3 Experim ent 3: Prelim inary Dam age Evaluation... 27
5.2.4 Experiment 4: Follow-up Damage Evaluation w/ Amazon Products...28
5.2.5 Experim ent 5: Product O rientation Evaluation... 28
5.3 Sum m ary ... 29
6 System M odeling ... 30
6.1 O perational Sim ulation ... 30
6.1.1 Validation of Data Inputs...30
6.1.2 Sim ulation Results... 31
6.2 Financial Sensitivity A nalysis ... 31
7 C onclusions ... 33
7.1 Sum m ary ... 33
7 .2 R is k s ... 3 3 7.3 Future W ork...33
List of Figures
Figure 1. Am azon Robotics drives and storage pods ... 13
Figure 2. Pick Station...14
Figure 3. Pack Station ... 15
Figure 4. Tote Palletizing Robot ... 16
Figure 5. W inning team of Am azon Robotics Challenge 2017... 16
Figure 6. E-Com m erce sortation application of UIS ... 17
Figure 7. O verhead view of prototype ... 19
Figure 8. Process Flow Diagram ... 20
Figure 9. Prototype CAD Layout ... 21
Figure 10. Offline UIS Racking and Tray Hardw are ... 22
Figure 11. Robot gripping tray ... 22
Figure 12. Box holding pneum atics ... 22
List of Tables
Table 1. M ulti-pack S ubroutine Tim es ... 15
Table 2: Experiment 1 Treatments and Results...26
Table 3. Experiment 2 Treatments and Results... 26
Table 4. Experiment 3 Treatments and Results... 27
1
Introduction
1.1
Amazon E-Commerce Fulfillment
Amazon.com was founded in 1994 by Jeff Bezos as an online retailer of books. Over the last
23 years, it has grown into the largest e-commerce company in the world, reporting over $130
billion in revenue in 20161. The company managed to drive this growth by expanding beyond books into nearly every line of retail industry such as apparel, electronics, food and furniture. The company also expanded beyond physical products into digital offerings such as
streaming, music, video and audiobooks. Amazon has also been very successful developing its own hardware products such as the Kindle e-readers and the Echo series of smart speakers powered by their virtual assistant Alexa. All of this development support's Amazon's mission of being "Earth's most customer-centric company" by continually delighting customers with greater product selection, faster delivery and lower prices2
The company has grown its warehousing and IT infrastructure from scratch during this period, building most technology in-house. This has allowed the company to have very tight control over its now 190 million square feet of global warehousing space3. Across the US, Amazon
operates over 70 "fulfillment centers" and employs over 90,000 employees4. The company has
become so confident in its capabilities, that in 2005 it launched Amazon Prime membership which offers free two-day shipping. Furthermore, the company has begun to sell fulfillment as a service to other retailers through its "Fulfilled by Amazon" business. In 2017, more than half of all revenue generated through Amazon retail was owned by third-party retailers5.
1.2
Problem Statement
Amazon continues to exhibit rapid year-over-year growth in its fulfillment business. Based on current growth rates, projections for the worldwide fulfillment network will require millions of associates and millions of square feet of real estate by 2020-20256. Because of these
staggering requirements, the company is aggressively pursuing means to improve worker and real estate productivity. The newly formed Advanced Technology group, has been tasked with developing and deploying short-term automation wins and long-term process redesigns to support fulfillment productivity.
The Advanced Technology group is tasked with developing and deploying automation to support fulfillment efficiencies, worker safety and customer experience. In the current state, repetitive tasks, bottlenecks and space inefficient processes are primary targets for
automation.
1 "Corporate Overview for Amazon.Com, Inc." 2 "Amazon's Global Career Site."
3 "Amazon Distribution Network Strategy I MWPVL International."
4 "About Amazon - Our Innovations - Amazon Fulfillment Network."
s tax, "Amazon."
The packing process operates at around one package every two7 minutes on average and is
one of the costliest processes in the fulfillment center (FC). Amazon recognizes this and has developed technology for single item packaging due to its relative simplicity, but it has yet to produce a multi-pack solution.
Multi-item packing consists of many sub-processes such as box making and sealing, but the most challenging component from an automation perspective is handling the individual items and placing them into the box so they fit. Manipulation of items has been a known challenge for the company for many years, but it has yet to develop a robust enough system capable of manipulating the over 500 million unique items sold through Amazon.com. To solve the multi-item packing problem, either robust multi-item manipulation must be achieved or a solution should be designed around it.
1.3
Project Hypothesis
Multi-item packing automation can be achieved through a container manipulated robotic system that directly transfers sorted items to the customer packaging. This solution avoids the handling of individual items and simplifies the packing process. Sufficient quality can be achieved through proper process, controls and mechanical design along with item preparation and entitlement restrictions. Such a system would have sufficiently high throughput to exceed that of its upstream process and achieve a meaningful financial return to the business.
1.4
Project Approach
To test this hypothesis, my approach was to design and test a physical prototype at Amazon's R&D center. This site featured prototyping capabilities and a live fulfillment operation, both of which were necessary for development. At the start, I learned all about Amazon's operations and technology currently under development. Between spending a week working as an associate, taking robotic controls training and interviewing technical leaders, I gained a solid footing for how to proceed with the project. Next, I interviewed stakeholders of the R&D center and the Advanced Technology team who could either contribute directly or allocate resources to my project. With this information, I generated a project plan that was both feasible and met goals set forth by management.
After many design iterations, an operational prototype was installed. Success criteria and target metrics were determined for the system output, and sources of input variation were determined (item quantity, size, weight, etc). From there, a series of designed experiments were executed to determine the quality as a function of the inherent input variability. Learnings were taken after each experiment which drove hardware and software changes for the next round. This process continued as time permitted until the project conclusion. A final
recommendation was made based on these results.
System level design recommendations were driven by simulation and modeling rather than prototyping. An operational simulation was used to determine appropriate design and capacity
of the upstream sortation technology. Recommendations from the model were used as inputs to the financial model which optimized the business case. Both models were developed using traditional modeling tools (Monte Carlo, Discounted Cash Flow) along with specific internal data. Together with the physical hardware prototyping, an overall recommendation could be made.
1.5
Thesis Overview
The thesis begins with an overview of Amazon's fulfillment operations with additional detail shared for the outbound portion of the process. This is the area of focus for automation, therefore it demands more context. Next, a summary of automation technology current deployed and more under development will be discussed. Finally, details of the proposed solution will be discussed such as the design and process flow along with the high-risk areas. In the second major section of the thesis, system development and testing plans will be discussed. Criteria for safety, throughput and quality all were factored into the design and required many iterations before gaining approval from all stakeholders. Specifics on what and how the system was tested are detailed here.
In the next section, the results from the aforementioned test plans are analyzed and reported. Design changes are also chronicled in this section, as learnings from each experiment were incorporated into the next. The section concludes with a summary and discussion of the process capability and future opportunities for improvement to meet the success criteria. In the fourth section, an operations simulation and business case are presented. The
operations simulation demonstrates the throughput and success rate of the integrated system as a function of process input parameters. A discussion of the validity of the model is also included. The business case is also presented with an NPV sensitivity analysis performed on key design parameters.
In the final section, an overall assessment of the proposed automation solution will be presented along with recommendations for future work.
2. Amazon Fulfillment
2.1
Introduction
Within Amazon's fulfillment network, there exist several types of operations with unique functionality that support the end-to-end supply chain. The workhorses of the fulfillment
network are "sortable" fulfillment centers which perform inventory storage and outbound shipping for the majority of customer orders. Items fulfilled by sortable FCs fit into a breadbox and weigh under 25 lbs. For larger items, there are "non-sortable" fulfillment centers, which operate in a very similar manner but have infrastructure that is larger. State-of-the-art sortable centers can ship hundreds of thousands per day. There are also specialized fulfillment centers for oversized or breakable items such as televisions, appliances, etc. which operate under a more traditional manual fulfillment process.
Beyond FCs, there are also two other types of centers which support the supply chain.
Inbound Cross Docks (IXDs) are used to receive materials from outside vendors. These centers are responsible for tracking inbound shipments, breaking down packaging and receiving items into Amazon's fulfillment containers and software. Sort Centers are regional operations that sort packages from fulfillment centers to the many different delivery vehicles and service providers at the household level.
The focus of this project is automation within sortable fulfillment centers for its outbound process, so a more detail description of these operations is provided in the next section.
2.2
Inbound
Inbound, in general, is the process of receiving product from external vendors and inducting it into Amazon's systems. Vendor volume comes from IXDs and then is brought into FCs through a process known as transshipment (internal node to node) to place inventory at the right location and right time for customer orders.
The inbound process concludes with items being stowed into inventory, at which point Items are available for sale through the Amazon.com website. There are two major types of storage systems. The first is a traditional, fixed shelving inventory storage model which persists in older fulfillment centers in the network. Most new sites however, use Amazon Robotics (AR)
technology for intelligent inventory management.
2.3
Storage
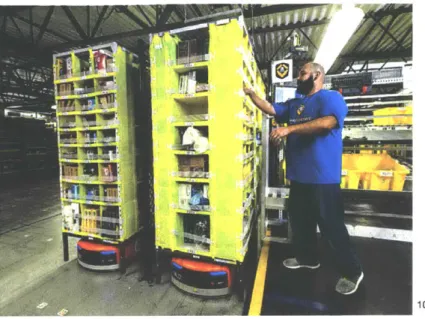
In 2012, Amazon acquired Kiva Systems for $678M8 and renamed the organization Amazon Robotics (AR). AR develops its own software and hardware system that uses autonomous guided vehicles to manipulate shelving units within a controlled field. Rather than operators walking through aisles stowing product on shelves, the system transports shelves to fixed
stow/pick stations, where the appropriate locations are presented to an operator. This system enables much faster pick and stow rates along and more concentrated inventory storage. The system has been widely deployed at sortable and non-sort sites through the US.
9
Figure 1. Amazon Robotics drives and storage pods
Essential to all Amazon processes is the virtual / physical match of items. Each container in the Amazon system is registered with bar codes as is each item. When product moves through the process, the record for the location of that item and container should match the physical presence of the item in the container. This data quality is validated at the inventory storage stage through the process called Inventory Control Quality Assurance (ICQA), where matches are periodically confirmed.
2.4
Outbound
2.4.1 Pick
The outbound process begins with a pick from the AR field by the operator. The items and timing are controlled by Amazon's proprietary software and are sequenced based on shipment time and resource availability. Pick operators place items into totes that are destined for a variety of "process paths" in the fulfillment center. Once a tote is full (around 30 lbs of product),
it is released to its path. One path is for transshipment to another fulfillment center, as
previously discussed. The next major process path is "pack singles", in which items are sent to a specialized packing line where one item is packed inside each package. At this stage, small cardboard boxes ("cases") and padded envelopes ("jiffy mailers") are used to package the
items, which are then labeled and sorted for shipment. The last process path is "pack multis" for customer shipments with multiple items. Products for an order are not likely to be picked sequentially or even by the same operator, so they must be sorted and merged downstream. A
system called Amazon Fulfillment Engine ("AFE") is used to sort these items down to customer package granularity.
10
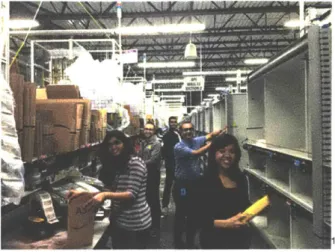
Figure 2. Pick Station'
2.4.2 Sortation
Pack-multi totes are conveyed to a station known as "induct", in which items are moved from their previous mixed-item tote to their own single-item container. Item barcode and container bar codes are scanned to verify physical/virtual match and are then sent along another conveyor. These containers are then routed to a number of "rebin" stations where items are removed from their containers and sorted into particular slots in a large array behind the operator. Bar code scanners and light indicators show where items should be placed and empty containers are returned to the induct process. Once all items for a particular package have been sorted to its slot, the items are "pushed through" to the other end of the open-ended slot, where pack operators await.
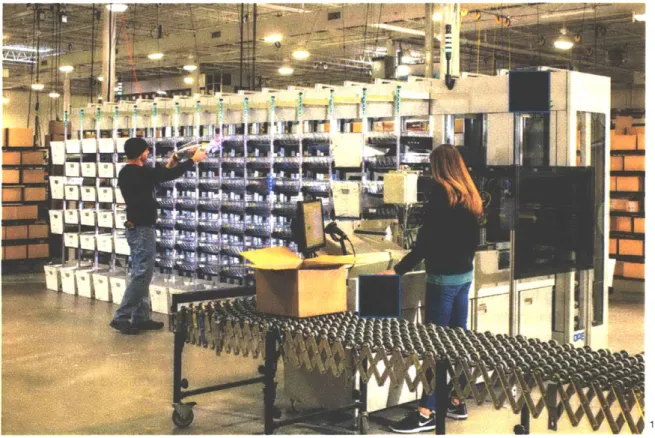
2.4.3 Packing
The pack operation involves many sub routines and is the primary focus of the automation developed for this thesis. This process begins with scanning the slot ready for packing, removing the items and placing them on the pack table. Next, the packer builds a box that is recommended by the software. Based on the known size and weight of the items present in the order, an algorithm recommends a box to be used for the order. After, the operator scans the items and places them into the box. Next, the packing slip, packing material ("dunnage") and tape are added to the box. Lastly, the box is labeled and moved to the take away conveyor. Time studies for the sub routines have been performed to determine the relative contribution of each step to the overall cycle time (data provided below).
Table 1. Multi-pack Subroutine Times
Build box 8-10 seconds
Remove items from chute 12-20 seconds Scan items and place in box 16-24 seconds Add dunnage and tape 16-20 seconds Add label and move to conveyor 6-14 seconds
12
Figure 3. Pack Station
2.5
Technology Development
2.5.1 Advanced Technology Organization
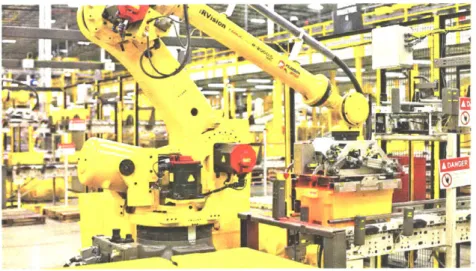
To support development of automation, a new technical team was formed in 2015 called Advanced Technology (AT). Composed largely of engineers and program managers, the team is focused on development and alpha testing of new automation technology. Projects range from using traditional industrial robotics such as palletizing totes to full process redesign from the ground up. Lots of work is also done with outside vendors and modifying equipment for use in fulfillment applications.
The AT team has extensive access to Amazon's R&D center. The site's mission is to expedite the development of technology solutions to support the growing demand on the company's fulfillment network. This largely translates to prototyping and testing new automation
equipment in a controlled, but live operation. Advanced technologies and Amazon Robotics (formerly Kiva) report up through the same Vice President and have aligned short and long-term milestones. An example of the automation solutions produced by this team is featured below.
Data is masked for confidentiality
1 17
~I-0
Figure 4. Tote Palletizing Robot 2.5.2 Challenges of item handling
Amazon designs its process to minimize touches to the product, but it still must be handled to some extent. While easy for human operators, automating the manipulation of individual items has proven to be a very challenging problem. With over 500M unique products offered,
developing a software and hardware solution that can handle any possible item is a unique challenge. Since 2013, the company has hosted the Amazon Robotics Challenges in which academic teams are given a task to automate using a robotic design of their choice. In 2017, the competition required teams to pick and stow items into containers as well as pack items into boxes. This problem involves challenges of hardware design, but software is the major limitation. Advances in machine learning has allowed development on this problem to proceed, but in general these systems are not robust enough for live operation. As such, most
automation under development avoids handling items directly and prefers well-defined containers.
Figure 5. Winning team of Amazon Robotics Challenge 2017
13 Wingfield, "As Amazon Pushes Forward With Robots, Workers Find New Roles."
2.5.3 Automated Sortation Replacement for AFE
The AFE system used for outbound item sortation is robust but requires a large amount of floor F space. The system makes extensive use of conveyors, diverts and large totes in the routing
and sorting process. This presents a large opportunity for process and technology
improvement. Amazon has invested heavily in sortation equipment to automate this process for next generation fulfillment operations. By partnering closely with a number of external
equipment vendors, the organization has been able to tailor machine hardware and software capabilities to handle the specific challenges posed by fulfillment.
One system, known internally as Universal Item Sorter (UIS), requires just one operator to feed items into the machine (similar to "induct" previously described), and the equipment sorts the items into an array of up to 700 removable trays/totes that line the machine. Each tray/tote contains items for a customer order, and packing operations interfacing with this machine are essentially identical to that of the existing process. The standardization and removability of these containers creates an opportunity for robotic manipulation. This approach could be applied to other sortation systems as well including Amazon's existing AFE sortation walls or other types of sorting chutes.
S ~ S
15
Figure 6. E-Commerce sortation application of UIS
3.
Proposed packing solution
3.1
Overview
The proposed packaging solution involves automating removal of a consolidation order and placing it directly in a package container. For existing Amazon processes, a removable tray or other device could be inserted into the AFE chute for easy removal and replacement. This concept could also be integrated in future automation sortation solutions. After weighing technical challenges and internal development milestones, a solution was proposed to automate the packing process as it interfaces with sortation chutes / trays:
After all items in a customer order are sorted to its tray, an industrial six-axis robot can be used to pick the tray. Simultaneously, a corrugate box is constructed and automatically fed into the work area on a roller conveyor and held in place with pneumatics. The robot turns to face the
box and empties the tray contents into an intermediate fixture that funnels the items into the box. The robot then returns the tray to its original location and the box is sent out of the robotic work cell.
Two alternatives to this proposal were considered. The first alternative was loading boxes directly on the AFE or automated sortation machine to avoid the intermediate tray transfer step. While an interesting solution, it would require a major hardware overhaul of the upstream sortation system. Also, using a robot to manipulate assembled boxes would add complexity which could be a thesis project unto itself. The second alternative considered, was integrating a second robot that individually picked and placed items from the tray to the box. This
theoretically would be a gentler process, but the speed and reliability of this technology has yet to be proven.
This system was proposed due to speed and simplicity. A single operation, emptying the tray contents, is much faster than picking and placing individual items one at a time. Furthermore, the challenge previously mentioned of manipulating individual items is avoided with this
proposal.
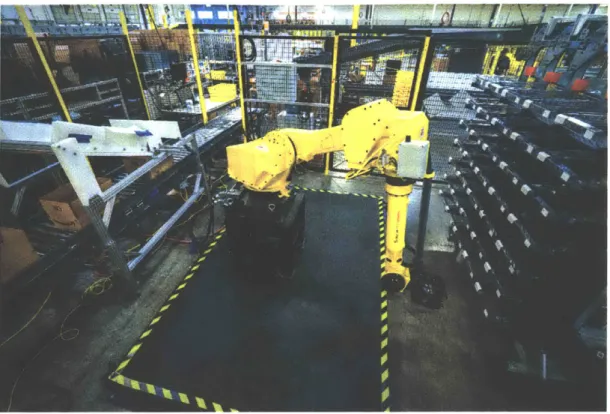
To test this concept, a proof-of-concept prototype was built to evaluate the fundamental mechanics of picking trays, funneling their contents, and conveying boxes. The initial embodiment had the robotic system interfacing directly with operations. This concept was abandoned due to unnecessary complexity, safety issues and competing testing availability.
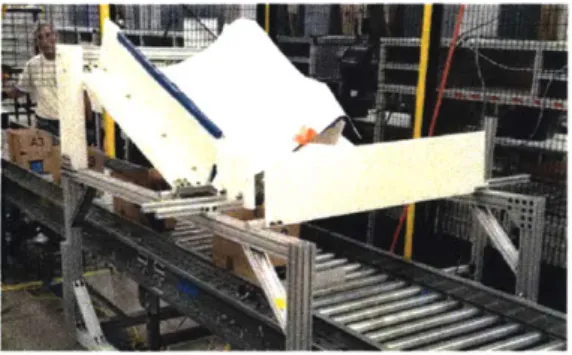
Instead, a fully off-line system was built that employed identical tray and racking hardware. This allowed for unhindered testing of the prototype, faster process iterations and improved safety. A photograph of the prototype is shown below.
JL~hi2L14
Figure 7. Overhead view of prototype
The prototype required a manual process for loading products into the trays pictured. A case erector was later integrated with the prototype to automatically assemble boxes as needed, but most operation was performed by manually loading pre-made boxes. Adding dunnage, tape and labeling were considered outside the scope of this prototype, but off-the-shelf solutions already exist for automating these processes.
3.2
Process Flow
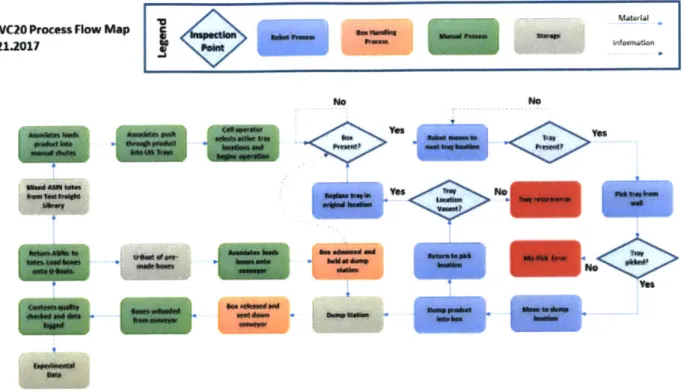
A process flow diagram for the system operation is shown in Figure 5. Typically, the system was run as a batch operation beginning with associates loading product into all 35 trays. Simultaneously, boxes are fed to the inbound conveyor either by hand (pre-made) or by
machine (ust-in-time) and are held in place by pneumatics. A proximity sensor was mounted to the box holding location to confirm the box is present before initiating the pick and dump sequence. Additional checks are made by the robot before operating. Using the mounted laser distance sensor, the program confirms a tray is present before attempting to pick it. Next a short-range proximity sensor confirms that the tray has, in fact, been picked. These sensor elements confirm the timing and avoid errors in the process. After the pick, the robot turns and empties the contents into the funnel. The tray is returned to its location, and the box is released to exit the work cell. Associates collect the discharged boxes and reuse the boxes and items for future testing.
RWCZO Process Flow Map
8.21.2017
... w>.
PkIMt U~ ms".-n
No No
-Fig h"m u*e W" P c s Fom D r
. y I IS ei DIs n
pr A s ess.i rd sat reureet rup sauand
b~wd - WPM OW
hua pesses wihi thists Asme suh gann -prv-fomitra s-eyadtr a
stkhdrs w syesev y ddrr
ss.Frm edse rvwsitwsm detemd thta ecd n'ntroce ncoue-ol
Figure 8. Process Flow Diagram
3.3 System Design
Navigating the organization and managing the many stakeholders involved was challenging in the early phase of the project because a number of barriers arose that slowed the development
process. Amazon sets very high standards for safety requirements for both equipment and human processes within their sites. As such, gaining approval from internal safety auditors was a challenge in driving the design of the prototype. Safety risk assessments with project
stakeholders were used to identify the severity and frequency of various risks associated with a design. From these reviews, it was determined that a fenced and interlocked enclosure would be required to ensure no human-robotic interactions and form a barrier for flying
product/debris from the system.
The equipment used in the prototype had a variety of power and air consumption
requirements, but the desired site for the system did not have such utilities. Special electrical and air lines had to be run to the site to power the system. Approval for this work was difficult due to scheduling and budgetary constraints. Lastly, there was simultaneous development of related projects that competed for space and resources. After some discussion and
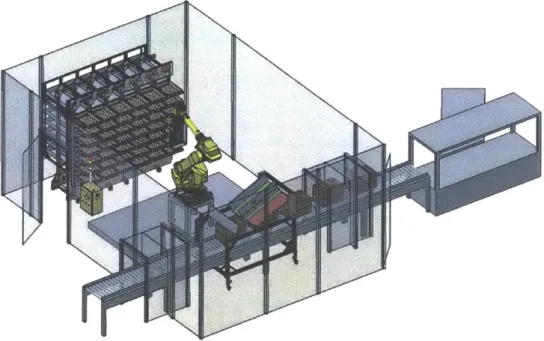
negotiation, an acceptable balance competing criteria was determined. The resulting CAD layout is shown below.
Figure 9. Prototype CAD Layout
3.4
Risks
The simplicity of the proposed solution has many benefits, but there also some potential risks inherent to this method. Three risks were identified as most fundamental to this process and became the focus of testing.
1) Product accuracy - Transferring all items successfully into the customer package is a key feature of Amazon's promise to customers. The current process requires manually scanning each item before packing into the box. The proposed process would make this scanning step challenging if not impossible. Success in this new process will rely on upstream sortation accuracy and minimal defects generated from this process. Mitigation solutions may include changes to hardware or controls software.
2) Product damage - The proposal avoids handling individual items and therefore may be a rougher process than picking and placing by hand. The extent to which damage is exhibit will be investigated. Mitigation strategies may include item restrictions for this process path or additional preparation at the inbound stage.
3) Product orientation - The contents of the order are transferred to the box in a single step without control of locations or orientations of the items. The extent to which this is a problem will be investigated. Mitigations solutions may include mechanical shaking of the box or manual intervention as an additional process.
4
Testing
4.1
Prototype Hardware
Development of supporting hardware was a significant
barrier to evaluating the proposed automation concept. A - a
combination of internal and external design resources was employed to develop custom hardware.
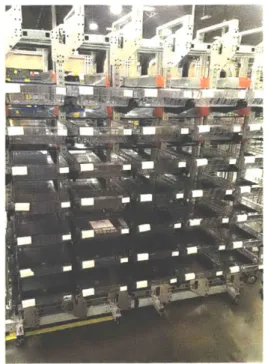
A decision was made to build a fully off-line prototype that did not interface with the operation. Extra racking hardware and trays were used as a surrogate to the actual operation. This allowed for true representation of the mechanical issues with the hardware and allowed greater flexibility in testing and development. Trays were injection molded polycarbonate and were only four inches deep (typically used for small orders only). Space constraints allowed for 5 columns with 7 trays each for testing. A photo is pictured below of the tray and racking hardware.
Figure 10. Offline UIS Racking and Tray Hardware
The robotic arm employed had 70 kg of capacity, which was mounted to a stand and skid for easier transport and adjustment. A custom gripper tool was designed and manufactured by the robot vendor that interfaced with the arm and its
controls. The gripper engages with the nearest lip of the tray (shown below) and clamps down using a pneumatic actuator.
A conveyor with 11 motorized drive rollers (MDRs) Figure 11. Robot gripping tray
was used to convey boxes with zero pressure accumulation. A side rail was installed and rollers were angled such that boxes migrated to the rail as they moved along the conveyor. At the center of the conveyor there was special hardware to firmly hold a box in place while items were transferred to it. A pneumatic blade stop was fitted between rollers that popped up and down to prevent boxes from flowing forward. A
pneumatic pusher actuated perpendicular to the conveyor to trap boxes against the side rail. This
enabled consistent box placement that was tolerant of any box size. Due to the variable size of boxes and the large area
required to dump items from trays, a specialized "funnel" was constructed to guide items into the box. This was designed for flexibility and simplicity. The
hardware contains an inclined plane with a PTFE film. Side walls were added to ensure items were guided correctly. An angle of 25 degrees was determined to be a good working position for the plane.
Figure 13. Product funnel
4.2
Metrics
As previously discussed, critical quality metrics were determined to be accuracy, damage and orientation with quality targets set to "parity or better" than the existing manual process. Due to changes in the process, a perfect measure of existing figures for accuracy and damage were difficult to determine. Orientation is not an issue at the current time. In addition to quality, throughput speed was also a critical metric to validate the business case. From financial analysis, it was determined that cycle times less than 206 seconds were required for a positive NPV investment. Ultimately all quality targets must be achieved if the system were to be
deployed in live operation, but failing to do so does not preclude success in this early stage of R&D.
From analysis looking at package weight checks, it was determined that around 0.25% of orders had accuracy defects on the box in the existing process. This figure was chosen as the target accuracy quality target. Damage was much more difficult to determine, since damaged items are typically removed by associates if deemed unacceptable. Customers report
damaged goods received known as "concessions", but it would not be possible to determine if damage occurred from packaging or from shipping. As such, the same figure of 0.25% was used for this quality metric. Orientation is not a problem in manual packing, since associates will rearrange items or choose a larger box if the fit is poor. Orientation defects were defined as any configuration of products that extended beyond the flap crease, thus preventing the box from closing.
4.3
Experimental Design
Each experiment was designed to understand the effects of product characteristics (size, weight, etc.) and mechanical hardware on the response variable of interest (1. accuracy defects, 2. damage defects, 3. item orientation). Randomized factorial experiments were used to determine significance of primary and interaction effects of the factors under study. Defect rates were calculated for each configuration by dividing the number of trials containing a defect
by the number of trials. This was deemed a more customer-centric approach than item-by-item defect rate and is consistent with the Amazon's definition of defects.
4.4
Execution
Testing was supported by the author, a dedicated associate and a rotating team of fulfillment associates. The testing process followed that described in Figure 8. Typical operation was performed with two fulfillment associates who completed product loading, box loading, and unloading steps. The innovations associate operated the cell, logged data and coordinated the trials. The author also supported all these activities in addition to robotic work cell intervention and detailed note taking.
4.5
Test Freight
Since testing was not completed with real customer orders, it became critical to procure good quality test freight that mimicked the range of characteristics exhibited by typical orders. Three classes of freight were procured for testing.
The first class, was a set of previously damaged items discarded from real customer orders. These items had minor or major damage defects but had not been discarded. These were useful for evaluating metrics besides damage because they were representative of Amazon's products and were readily available without cost. In Appendix A, histograms of the length, weight and item descriptions are provided.
The second class of test freight was, undamaged test freight. These items were procured from a local discount store. These items were not currently fulfilled by Amazon but had no signs of wear or damage. While inexpensive to procure, this freight begged the question of whether or not they were representative of Amazon's products. Packaging tended to be less robust on these items compared to what Amazon keeps in inventory. In Appendix B, histograms of the length, weight and item descriptions are provided. In general, these two sets of test freight are very similar, but the undamaged freight was on average larger by two inches.
The third class of test freight were items drawn directly from Amazon's inventory at the R&D center. Purchasing this freight was not practical due to the high number of units required and the associated cost, but eventually approval was gained to pick items from inventory, process them once, and then return them to inventory. Access to this freight was limited due to
resource constraints for picking and stowing freight but represented the most realistic
simulation for live customer fulfillment. The dimensionality of these parts was not recorded, but the parts were constrained to fit in a 15" x 12" x 8" box and be under five lbs.
5
Results
5.1
Overview
Once the prototype was functional, a series of designed experiments were conducted to learn about the process and make improvements. In the end, five major experiments were run, each with around 1,000 trials during 10 hours of testing. The first two experiments focused on product accuracy because this is the most foundational quality metric. After gathering learnings and improvements, two more experiments were conducted evaluating product damage. During this study, accuracy was also tracked. The final study evaluated orientation of the items in the box to determine if the box could be closed.
Because measurements are binary in response (defect or not), experiments were designed to produce around 10 defects per run. This is the rule of thumb for defect testing experimental design, since this gives a measurement "resolution" of around 10 times the feature size. Earlier experiments produced more defects, so fewer trials per treatment were required and later on more trials were required.
Lastly, an arcsine transformation was used before regressing the data in each experiment. This is a common practice used for regression with proportions. At very low or every high
proportions, the binomial distribution becomes highly non-linear. After this transformation, the data is better suited for linear regression. In the experimentation, most defect rates are less than 10% so the transformation was determined to be a useful tool.
5.2
Experimental Results
5.2.1 Experiment 1: Preliminary Accuracy Evaluation
Accuracy was the first response variable tested. It was chosen because all other criteria were dependent on successfully transferring items from their trays to the boxes. Six factors with two levels were considered in evaluating accuracy defects: Item Size (Large/Small), Item Weight (Heavy/Light), Item Quantity (4 units / 2 units), Robot Speed (100%/50%), Funnel Width (Wide/Narrow) and Tray Type (ramp/no ramp). Funnel width was varied to mimic wider or narrower boxes that the products may be destined for, though the actual box used was always a large K3 (16" x 12" x 5"). Lastly, it was hypothesized that adding a rounded inner corner ("ramp") to the tray would be less damaging to the items, so it was included in this study to identify any adverse effects on accuracy. The defect rates over approximately 100 trials are reported for each treatment described in the DOE table shown in Table 2 below.
Table 2: Experiment 1 Treatments and Results
StdOrder RunOrder PtType 9 10 5 2 12 7 4 3 8 1 11. 6 1 2 3 4 5 6 7 8 9 10 11 12
Blocks Speed Chute Wih Item Qty Item Size Tray Type Item Weight Defect Rate Arcsine Transform 50 100 100 100 50 50 100 50 50 100 50 100
6 2 Large No Ramp High
6 12 12 6 12 6 12 6 6 12 12 2 Small 2 Large 2 Large 2 Small 4 Large 4 Large 4 Small 4 Large 4 Small 2 Small 4 Small No Ramp No Ramp Ramp Ramp Ramp Ramp No Ramp No Ramp Ramp Ramp No Ramp High Low Low Low High High Low Low Low High High 22.8% 0.8% 2.1% 1.1% 2.1% 10.2% 72.7% 3.0% 21.0% 8.0% 0.0% 13.0% 0.498 0.087 0.147 0.107 0.147 0.326 1.021 0.174 0.476 0.287 0.000 0.369
The ANOVA results show that three factors were statistically relevant with a 0.10 significance level: Item Quantity, Item Size and Funnel Width. Overall, around 70% of the defects could be explained by the fitted model and residuals do not show any bias (see Appendix C). The two major failure modes were 1) items flying out of the tray during the motion, and 2) items jamming in the funnel. Both of these failures were exacerbated by larger size and quantity trials. Furthermore, narrow chute width resulted in a high rate "Funnel Stuck" failures. In the worst case (Qty 4, Large Items, 6" Chute) the defect rate was over 70%. Conversely, in the best case (Qty 2, Small Items, 12" Chute), the defect rate was 0%. The average defect rate over the 12 configurations was 13%.
We targeted these failure modes with two mechanical changes. First, a 450 angle was applied to the tray during rotation to counter centrifugal forces. Next, the funnel shape was redesigned to avoid jam points while still guiding items into the box (see Appendix D). With these changes implemented, a follow up accuracy study was conducted to determine if these changes made a meaningful improvement.
5.2.2 Experiment 2: Follow-up Accuracy Evaluation
In the follow-up evaluation, only 100% robot speed was used due to its small effect on quality and business requirement for high throughput. Furthermore, the new funnel design did not require any adjustments for it work with a variety of box sizes so funnel width was removed. The remaining factors were held the same as the previous round (Item Qty, Size, Weight, Tray Type). The defect rates over approximately 100 trials for each are shown in Table 3 below.
Table 3. Experiment 2 Treatments and Results
StdOrder RunOrder CenterPt Blocks Weight
2 1 1. 1 Heavy 7 2 1 1 Light 4! 1 Heavy 4 1 1Light 5 1! 1 Light 8 6 1 1'Heavy 6 7 1 1 Heavy 5 8 1 1 Light Size Small Large Large Large Small Large Small Small
Qty Ramp Defect Rate Arcsine Transform
2 Ramp 1.90% 0.138 4 No Ramp 0.0 0 ___ 0.000i 2 No Ramp 0.00%1 0.000 2 Ramp 0.95% 0.098 2 No Ramp 0.95% 0.098 4 Ramp 5.36% 0.234 4 No Ramp 4.55% 0.215 4 Ramp 5.71% 0.241
For this study, the average defect rate for all 8 treatments was 2.4%, which was a major improvement over the previous study. Results from the ANOVA do not show any main or interaction effects with a significance level of 0.01 (see Appendix E). This is an encouraging result because the item characteristics are not truly controllable in operations. This suggests that different sizes, weights and quantities do not significantly affect the success rate of the robot, at the current sample size.
From this analysis and observation, the changes implemented on the robot motion and funnel design were very successful improving the system performance. This performance level was determined to be good enough to continue evaluating other metrics of interest such as
damage and orientation. Throughout future studies, accuracy would continue to be monitored. 5.2.3 Experiment 3: Preliminary Damage Evaluation
Damage to the product is one of the biggest risks for the proposed system and perhaps the hardest to engineer out of the process. In this experiment, we attempted to evaluate the damage rate that occurred from the process by using new, undamaged test freight. This was the most straightforward way to evaluate damage that occurred from processing, though items were reused for many trials until deemed "damaged." After each trial, all items were visually inspected by the same innovations associate and the types of damage were logged. For the study, it was decided to avoid splitting test freight by size and weight due to the fact that
heavier items may damage lighter ones. The effects of Item Quantity and Tray Type were studied in a 2-level, 2-factor design. Due to the reduced number of factors, the trial count for each treatment was increased to 250. The treatments and defect rates are shown in Table 4 below.
Table 4. Experiment 3 Treatments and Results
StdOrder RunOrder CenterPt Blocks Qty Ramp Damage Rate Damage Arcsine Amnesty Rate Amnesty Arcsine
1 1 1 1 4 Ramp 0.049 0.223 0.041 0.203
3 2 1 1 2 No Ramp 0.008 0.090 0.016 0.128
2 3 1 1 4 No Ramp 0.073 0.274 0.020 0.143
4 4 1 1 2 Ramp 0.004 0.064 0.041 0.203
From the ANOVA results, interaction effects were insignificant and were therefore excluded. Analysis of the main effects can be seen in Appendix F. Results of this study had two
interesting results, the first being item quantity had a statistically significant (a=0.05) effect on the damage rate. One would suspect damage rate to scale linearly with item quantity (more opportunities for a defect), but the data showed 10 times increase in damage rate for 4 item trials compared to 2 item trials. This suggests that product interactions cause damages more than the dumping process itself. Second, Tray Type did not have a significant impact on damages. This was counter to expectations and suggests the ramp tray type was not creating the intended effect. The slope of the Main Effects Plot does suggest the ramp may trend towards decreased damage rate, but more study will be required to prove this.
Accuracy was also tracked in this study. The ANOVA results show that Item Qty had little effect on the amnesty results (though a slight upward trend) meanwhile the Tray Type had larger effect (p-value = 0.071). From this we can say that the "Ramp" tray type did increase accuracy defects with 90% confidence. This is not surprising, since the ramp is designed to allow items to exit the tray more easily.
5.2.4 Experiment 4: Follow-up Damage Evaluation w/ Amazon Products
The above damage rate was very high and would be completely unacceptable in operation. While some hardware improvements could be made, the critical question about these results was the test freight used. Since items were not purchased from Amazon and were processed
many times, the results may not translate to actual fulfillment.
A second damage evaluation was devised in which test freight was picked from on-site inventory. These 600 units were processed in the same manner as the previous study, but each item was used only once.
In the 200 trials, zero items exhibited damages. Due to research time constraints, further testing with this process could not be completed, but the results were encouraging. Reasons
behind this result are expected to be caused by two factors. First, the items used were only run through the process one time as opposed to repeated testing resulting in cyclic stress and damage. Second, the items were packaged and prepped with the intent of being sold in an e-commerce environment and appear to have more packaging on them than loose items do from a store shelf.
5.2.5 Experiment 5: Product Orientation Evaluation
In the final study, the orientation of product in its box was evaluated. This metric was determined to be the third critical factor for the proof-of-concept. A defect in this study was deemed to be any trial where an item protrudes above the crease line for the box flaps.
In the first phase of the study, customer orders were simulated for small and medium box sizes (A3 "small" and 1A5 "medium") because those are the most common. Items were picked at random from the test freight and packed into a "gauge" box until it was full. Then, the set of items was loaded into a tray and the process was repeated for all trays/trials. Items were loaded with their longest dimension perpendicular to the array of trays because this was how items were processed by the UIS and would align with the longest dimension of the box. We hypothesized that using the "Ramp" tray type would help maintain orientation of items as they departed the tray and entered the box, so this factor was also studied.
The results from the DOE can be seen in Appendix G. Neither box type nor ramp type had an effect with statistical significance (a=0.05). The p-value for Tray type was 0.072 though,
showing that it still may have played a role and further testing may be warranted. In either case, the orientation defect rate was around 60% across all trials. This obviously is not acceptable in an any process, so secondary processing would be required to proceed with this method.
To mitigate these defects, mechanical shaking of the box was proposed to improve the product orientation. This was evaluated by mounting a fixture to an orbital shaker table and shaking each box for 5 seconds at 500 RPM. In this test, orders were again simulated but for A3, 1A5 and N3 "large" boxes. Orders were inspected before and after shaking (if needed).
Table 5. Item Rearrangement Results
Box Type Trials No Fit Defect Proportion No Fit Defect After Shake Total Proportion Shaker Conversion %
N3 134 52 0.388 8 0.060 85%
1A5 104 75 0.721 31 0.298 59%
A3 100 59 0.590 19 0.190 68%
SUM 338 186 0.550 58 0.172 69%
Overall the shaker effectiveness exceeded expectations. Similar to the previous phase, the pre-shaking defect rate was 55%, but after pre-shaking the defect dropped to 17%. This is a dramatic improvement and suggests this may be a viable way to improve the item orientation. From anecdotal observation though, there are certain orientations that cannot be improved with shaking. Because of this result, we expect a manual intervention will still be required on around 20% of orders even after additional mechanical stimulus. This may not be an unreasonable request and could be integrated if dunnage is manually added to the box.
5.3
Summary
The five experiments performed with the prototype production line yielded promising, but mixed results. None of the three quality criteria were met after the testing and improvements made during this research. That being said, there remain many opportunities to improve the process that may produce a system that meets the stated targets.
Accuracy of items in the box resulted in a 2% defect rate by the end of testing. It was demonstrated through disciplined, iterative testing that defects can be driven out of the process. As defect rates continue to drop, larger sample sizes will be required to measure defects, so scaling up testing will be a necessary challenge.
Damage of items also resulted in a 2% defect rate during testing. The validity of this result is somewhat in question though because the follow up test showed zero damaged items. While this zero-damage result is encouraging, there are certain types of items that may be excluded from being processed with the system. Amazon's proprietary software is able to limit these
items from this process path if needed.
Orientation in the box resulted in a 60% defect rate after dumping to the box, and 17% after shaking. While shaking showed a marked improvement, another intervention in the process will still be required due to the uncontrolled nature of the item orientation. Further consideration for this concept should expect to implement a manual rearrangement process.
6
System Modeling
Beyond the minutiae of mechanical and process design, there are system level design decisions that must also be considered for operational effectiveness and business success. Various analyses were performed to recommend an optimal system design for the integrated sortation and packing solution.
6.1
Operational Simulation
The upstream process involves loading items onto the in-feed conveyor, one at a time. Items are sorted by customer order into the appropriate tray. A common problem experienced by operations is the machine is "blowing out" the wall, meaning all sort destinations fill up with partially sorted orders. When this happens, there is no available destination for new orders which are therefore rejected from the machine ("kick-out"). Short term fixes were made, but an analytical model was desired to better understand the system response to changing inputs such as arrival rates, packing rates, and quantity of sort destinations.
A time series model was developed using a Monte Carlo random sampling method for
simulating order arrival times and first-to-last item sorting times. By simulating these events for one million consecutive orders, the model can predict how full trays are over time and what the expected "kick-out" rate would be.
6.1.1 Validation of Data Inputs
To validate some underlying assumptions, data from the AFE of a large, sortable fulfillment center was pulled and analyzed. Since one AFE produces the throughput of 6 or more, an equivalent subset of the AFE was evaluated to scale down the volume and pooling effects. Arrival times for new orders were hypothesized to be a Poisson process, thus inter-arrival times should follow an exponential distribution. Furthermore, the mean time between new orders should equal to induct rate (individual unit arrival) divided by the average units per order. From the described dataset, inter-arrival times were calculated and an exponential distribution was fit. The calculated mean fell within the 95% confidence interval fitted mean. Furthermore, the predicted inter-arrival times were compared against the data using a QQ plot (see Appendix H). The model follows the data closely for times under 30 seconds, at which point they diverge. Outliers are likely driven by discontinuous factors such as shift changes and mid-shift labor reallocation. A histogram for the sample data shows that around 97% of all inter-arrivals are under 30 seconds. Therefore, the vast majority of data from the sample closely follow
exponential distribution. For this reason, this was determined to be a good approximation for inter-arrival rates of new orders.
The duration a tray spends accumulating its items was hypothesized to follow a lognormal distribution based on observation and intuition. From the dataset mentioned above, the difference between "First Induct" and "Last Rebin" was taken to be this time. This measure was fitted to a lognormal distribution and compared to the model using a QQ plot (see Appendix I). Similar to the induct inter-arrivals, the model holds well over the bulk of the data
set. The fitted distribution and the data set begin to diverge at 100 minutes, and this point constitutes over 95% of all orders. Because of this, we determined this was a good approximation for the first-to-last item sortation time.
6.1.2 Simulation Results
The model was able to predict kick-out rates as a function of tray quantities and process inputs. Currently, the fastest induct rate capable by human operators was assumed to be 1600
UPH. Furthermore, the allocation of small, medium and large trays was set to an equivalent
proportion as the expected throughput of the respective size. A simulation of 1 M orders was run for 10 tray quantities between 200 to 500. The kick-out rate falls logarithmically with increasing tray quantity (see Appendix J). At the initial configuration of 200 trays, the predicted kick-out rate was over 300,000 kick-outs per million orders (KPMO) or 30% of items. By increasing to 420 trays, the predicted kick-out rate falls to around 600 KPMO or 0.06%. This is a very low rate and would be considered acceptable operationally.
Furthermore, the model reports a distribution of "fullness" of each tray type to determine if the configuration of small, medium and large trays is appropriate. The results are displayed as histograms in Appendix J. Furthermore, a time series plot is presented showing the tray status' over time (open, work-in-progress, or packable). From this analysis, the configuration of 420 trays seems to be high enough to avoid excessive kick-outs, but also avoids excess capacity
and space costs. Lastly, the tray size histograms show that no one tray type is excessively full and that a throughput proportional allocation is a good assumption. A slight increase in larger
bins may be recommended though, because the UIS allows orders to be sorted to larger trays if the correct tray size is full.
Currently, the operator's ability to induct items into the AFE is the bottleneck for the system. For automation sortation solutions, induct is also the bottleneck. Efforts are underway to speed up the induct rate through additional staffing or automation solutions. The above analysis was run a second time at 2400 UPH induct from 200 to 700 trays (see Appendix J). At 420 trays, the expected kick-out rate would be high: 10,000 kick-outs per million or 1 % of all orders. At
700 tray locations, the kick-out rate would fall back to an acceptable level of under 1000. This
tray quantity is possible but represents the upper limit for the AFE capacity and would be the recommended design for a high induct rate.
6.2
Financial Sensitivity Analysis
The business case for any automation project essentially weighs the immediate cost of the equipment against the discounted efficiency savings over the life of the project. As such, manual and automated process rates are key inputs to understanding the value proposition. In this section, a business case is presented for the product transfer to packaging, which is the core functionality of the prototype system. A series of sensitivity analyses have been
performed on a discounted cash flow model, where payback period (PBP), net present value
(NPV), and capacity utilization (CU) are studied. The optimal number of robots and accessible
As shown in Table 1, the manual process for product transfer to packaging takes 3017 seconds,
so with an average of three items per package, the throughput rate is around 325" UPH. The robot cycle time was assumed to be 1219 seconds, which is slightly faster than the prototype, but is achievable with layout improvements. The first sensitivity analysis was conducted using the current induct capability of 1600 UPH. The sensitivity analyses are shown in Appendix K. While the total number of trays is recommended to be greater than 400 from the operational simulation, the optimal business case would be to use one robot with access to 200 of these trays via a 7th axis rail. In this embodiment, the system would earn $1.5M20 NPV per fulfillment
center and would payback its capital expenditure of $2.2M2 1 in two years. Additional robots
would add capital expense without increasing throughput due to the upstream bottleneck of induct.
As previously discussed, opportunities for increasing the induct rate are being considered and under this circumstance, the profit maximizing system design would be different. At 2400 UPH, the highest NPV design uses two robots with a total of 400 accessible trays between them. This business case assumes steady state operation, so variability in the arrival of packable
orders may drive the accessible tray count higher in a more advanced model that accounts for this stochastic process. The proposed design would deliver $2.5M22 NPV per fulfillment center
and would payback its capital expenditure of $3.0M23 in less than two years. These financial
and operational metrics would be considered attractive for Amazon.
Additional equipment is required for other parts of the pack process, such as box making, dunnage application and sealing. These processes can generally be served by existing equipment on the market, but financial or process analysis was not performed for this
research.
1 Data is masked for confidentiality.
18 Data is masked for confidentiality.
1 Data is masked for confidentiality.
20 Data is masked for confidentiality. 2 Data is masked for confidentiality.
20 Data is masked for confidentiality. 21 Data is masked for confidentiality.