Automatically Generating Textured Buildings
Using Reconstructive and Statistical Methods
by
Ka Wai Lee
B.S., Massachusetts Institute of Technology (2019)
Submitted to the Department of Electrical Engineering and Computer
Science
in partial fulfillment of the requirements for the degree of
Master of Engineering in Electrical Engineering and Computer Science
at the
MASSACHUSETTS INSTITUTE OF TECHNOLOGY
June 2019
c
2019 Ka Wai Lee. All rights reserved.
The author hereby grants to MIT permission to reproduce and to
distribute publicly paper and electronic copies of this thesis document
in whole or in part in any medium now known or hereafter created.
Author . . . .
Department of Electrical Engineering and Computer Science
May 24, 2019
Certified by . . . .
Fr´
edo Durand
Professor
Thesis Supervisor
Accepted by . . . .
Katrina LaCurts
Chair, Master of Engineering Thesis Committee
Automatically Generating Textured Buildings Using
Reconstructive and Statistical Methods
by
Ka Wai Lee
Submitted to the Department of Electrical Engineering and Computer Science on May 24, 2019, in partial fulfillment of the
requirements for the degree of
Master of Engineering in Electrical Engineering and Computer Science
Abstract
Realistic 3D models of cities are extremely important for generating synthetic datasets for deep learning models. Current algorithms generate models of cities that are ei-ther monotonous, unrealistic, or must be specified with many procedural rules. In this thesis we present AutoCity, a system for generating realistic textured buildings given only the footprints of the buildings. AutoCity generates buildings using recon-structive and procedural methods, and then textures the buildings using a known adversarial neural network, FrankenGAN. We provide images of our output and ex-tensive documentation on how the system can be run and extended.
Thesis Supervisor: Fr´edo Durand Title: Professor
Acknowledgments
A huge thank you to Professor Fr´edo Durand for providing guidance, support, and motivation throughout my time working in his group.
This project also would not have been possible without the help of Dr. Tom Kelly from University of Leeds, for his work on FrankenGAN that drove the direction of most of this project, and for answering all of my emails and Github issues.
Shout out to Tiam Jaroensri for being a helpful mentor and point of contact whenever things go wrong. And that happens a lot.
Contents
1 Introduction 11
1.1 The problem: procedural modeling of cities . . . 12
1.2 Our solution: AutoCity . . . 12
2 Background 15 2.1 Procedural Methods . . . 15 2.2 Reconstructive Methods . . . 16 2.3 Statistical Methods . . . 16 3 AutoCity 19 3.1 Motivation . . . 19 3.2 System Overview . . . 20
3.2.1 Interface and Usage . . . 22
3.3 System details . . . 26 3.3.1 Input . . . 26 3.3.2 Building Generation . . . 28 3.3.3 Texture Generation . . . 30 3.3.4 Output . . . 32 4 Generated Cities 35 4.1 Output buildings . . . 35 4.1.1 Geometries . . . 35 4.1.2 Labels . . . 35
4.1.3 City . . . 37 4.2 Performance . . . 37
5 Conclusion 41
5.1 Future Work . . . 41
A Downloading and Running the System 43 A.1 Source Code Location . . . 43 A.2 SSH with Graphical User Interface . . . 43
List of Figures
3-1 An overview of the input flow of our pipeline. The blue rectangular components are parts of our pipeline, whereas red circular components are the data. OSM data is shown with a dotted line because it is not necessarily to have OSM data if the user already has the .gml data that they need. . . 21 3-2 An example of what the graphical user interface, chordatlas, looks
like. . . 24 3-3 The user interface for selecting the probability of each joint of the
FrankenGAN pipeline. The textures are generated with FrankenGAN, and the color segments are yet to be computed. The user can right click on the drop style image part of the interface on the right in order to adjust the mean and standard deviation of the distribution. . 25 3-4 A typical directory tree after running the entire AutoCity pipeline.
The folder buildings/ is generated as an intermediate result, and the folder franken out is generated as the output of the entire pipeline. The scripts can be located anywhere with respect to the directory tree. 27 3-5 A sample generated city with roof generation probability 0.6. . . 28 3-6 Two versions of generated textures for the same building, by supplying
a different mean from the texture distribution. . . 31 3-7 Two versions of generated textures for the same building, one with
normal resolution and one with super resolution. The image on the top is with normal resolution, while the image on the bottom is with super resolution. . . 33
4-1 Generated geometries for a polygonal building. . . 36 4-2 Generated geometries from a view of the city. The geometries are
consistent and realistic. . . 36 4-3 A visual representation of the labels of the AutoCity output. Glass
textures are labelled with dark blue, whereas other parts are labelled with red. . . 37 4-4 Some random views of our city as output. The shown buildings are
generated without super resolution. . . 38 4-5 Similar angles of two cities, one generated without super resolution
(top), and one generated with super resolution (bottom). The images on the right are zoomed in versions of the images on the left. . . 39
Chapter 1
Introduction
The rise of statistical and machine learning has created a need for an immense volume of high accuracy data, especially for the problem of autonomous vehicles. To collect large amounts data, many researchers have turned to generating synthetic data in-stead of collecting in the wild [19]. In particular, one prominent way of generating synthetic self-driving data is to use 3D computer graphics to model a city, from which we can generate high-quality and pre-annotated images. The MIT Graphics Group has an existing pipeline that first procedurally creates a 3D model of a city, and then generates synthetic images based on the 3D model. This thesis focuses on improving the pipeline, specifically in the generation of varied buildings and detailed facades in the first stage of the pipeline. We present AutoCity, a modular system that can completely replace the first part of the pipeline.
This chapter describes our motivation for this work, and why we need to improve the generation of 3D building models.
Chapter two describes how 3D models of facades and buildings have been gen-erated in previous work, and we also discuss what prior methods are useful in our work.
Chapter three describes the motivation of our work with greater technical detail, the specifics of how to run the system, and finally, the implementation choices that we made in creating the system and why we elected each choice.
perfor-mance of AutoCity.
1.1
The problem: procedural modeling of cities
Current methods of constructing city models using procedural modeling is severely lacking, particularly in generating building details. In order to create complex struc-tures, we must first learn the (usually complex) rules and languages specific to the generating software, which gives this process a rather steep learning curve. Further-more, generating buildings with procedural modeling is not scalable in terms of how varied the buildings are. In order to have a variety of types of buildings, we must also write many varied rules in the aforementioned language that correspond with the varied types. One goal of our system is to have very many types of buildings without the need to write many procedural rules.
Furthermore, we are interested in having realistic detail on the buildings. We will refer to these details (such as depth of window sills, reflectiveness of windows, wall textures) collectively as the facade of a building. While having a detailed and realistic facade on the building seems overly fastidious, small details on surfaces of buildings give the building realism and make them appear not flat. In a synthetic dataset for training autonomous vehicles, a detailed facade allows drivers close to buildings to correctly identify edges of buildings. There are two components of a facade that we are particularly interested in. One is the geometry of the facade, which is the change in physical shape of the building due to windows, doors, or other components. The other is the texture of the facade, which is the color, patterns, and material that describe the facade. The goal for our system is to be able to generate buildings with realistic geometry and texture.
1.2
Our solution: AutoCity
This thesis is focused on generating many buildings with realistic facade details. To address the aforementioned problems with building generation, we design and present
AutoCity, which uses a combination of reconstructive and statistical modeling to generate buildings. We use an online collaborative database to find the footprint of a city, generate buildings on top of the footprints, and then we use an existing generative adversarial network (GAN), FrankenGAN, to texture the facades of the buildings. Our key contribution in this work is the development of AutoCity, a system which can generate detailed building models from building footprints. AutoCity is designed to be modular and can be easily extended for improvements and additional features.
Chapter 2
Background
Synthetic data has shown to be a promising source of machine intelligence data, and many research groups have attempted to construct 3D models in order to generate synthetic data. Current methods to generate complex building types and textures are usually either procedural, reconstructive, or statistical. In this chapter, we discuss existing research in each of these directions.
2.1
Procedural Methods
Various research attempts have created multiple well-documented systems which gen-erate cities and buildings procedurally. One example is Esri’s CityEngine, which is a flexible software used by city designers [3]. With a few initial grammatical rules, a large scale city can be generated, with flexible tuning capabilities available. Similarly, Nishida et al. designed a system which takes in sketches of building parts and gen-erates 3D models of buildings easily and quickly [5]. However, many such procedural models often require large amounts of user input for all aspects of the city, which is unscalable for generating large amounts of data.
Research has also produced methods to combine procedural methods with machine learning, where models are trained on existing building datasets in an attempt to learn the grammar to a structure. A prominent method for doing this is Bayesian model merging [8]. However, it appears that this technique is not powerful enough to
represent a structure as complex as a city, as there are very few successful examples of well-learned grammars beyond basic examples.
2.2
Reconstructive Methods
Rather than creating city models from scratch, some research focuses on generating a representative model of a city from existing data collected from the real world. The first and perhaps biggest challenge is to collect data for regeneration; many scattered datasets of building footprints exist, but very few if any contain full facade information of the buildings. Among these datasets, many researcher choose to use OpenStreetMap, an open online wikipedia for city data, as a source for building footprints. Wang and Zipf used the tags available in OpenStreetMap to attempt to construct the inner workings of a building [9]. Many others have also built tools that attempt to model data from OpenStreetMap, including Glosm [10], OSM-3D [11], OSM2WORLD [12]. Kelly et al. designed a system in 2017 which takes real-world information from both OpenStreetMap and Google Street View to reconstruct building information [13]. However, a lot of these methods often weigh the accuracy of the reconstruction over the details in the facades, which makes the buildings appear visually unrealistic when viewed up close. In AutoCity, we will use some real world data as a base for the generation of our city.
2.3
Statistical Methods
Unsupervised methods for deep learning has been very popular with synthesis tasks, in particular for image and texture synthesis. Many breakthroughs in the realms of image colorization [17] and style transfer [18] have occurred in the recent years as a result of the rise of unsupervised learning. Most of the current state-of-the-art models in these fields use generative adversarial networks (GANs). GANs consist of two machine learning systems, one discriminator and one generator. The generator synthesizes an image, while the discriminator determines whether the synthesized
image is “real”. The two systems adversely compete against each other in order to synthesize new models and images.
There are very few attempts to generate entire buildings from scratch using only statistical methods, as there are not enough complete building datasets for the model to be generic. There are some GANs that generate images or models of building facades. In particular, there are a few GANs that are of interest to us: first is pix2pix [2], a general GAN for image-to-image translation between domains given image pairs that describe the relation. pix2pix is popularly used for generating realistic looking images or textures given input of some type. The second is CycleGAN [7], which maps between image domains just like pix2pix. CycleGAN works slightly differently in that direct pairings of images are not needed; we only have to supply a sample of images from both domains, and the network learns the relation using a special type of loss called cycle consistency loss. We are also interested in FrankenGAN, which, given building input, generates semi-realistic textures and styles [1]. In addition to basic textures, FrankenGAN also modifies the geometry of the building to fit in reasonable structures such as a chimney or a balcony. FrankenGAN accepts, as input, images that describe the styles that will be applied to the buildings. In our system, we use FrankenGAN as a subsystem for generating building textures.
Chapter 3
AutoCity
This chapter describes AutoCity, the system we have created. In the following sec-tions, we will discuss the technical motivation we have for building this pipeline, an overview of the system including details on how to run it, and finally, the details of each component and why we made each design choice.
3.1
Motivation
The MIT Graphics Group currently has a pipeline which uses computer graphics to generate large amounts of synthetic data used to train models for autonomous vehicles. The first part of the pipeline, CityEngine, creates a 3D model of a city, using rules that govern generation of roads, buildings, trees, bus stops, and etc. The output of CityEngine is a .obj file that is a model of a city. We use the model as an input to the second part of our pipeline, CoSy. CoSy, developed by Nishchal Bhandari, generates driving scene data by taking rendering scenes of the input model using computer graphics rendering algorithms [4]. Because we created the 3D model that we input into CoSy, we have an inherent understanding of each semantic part of the images that we render with CoSy. Therefore, the images that are output from CoSy are high fidelity and could be labelled on a pixel level, and they could be used directly for training models for autonomous vehicles.
part of the pipeline. CityEngine is a specialized 3D modeling software for creating cities. In order to use the tool, it is necessary to learn the specific language which is used for the generation of the city. Having this tool as a dependency in our pipeline makes it very difficult for newcomers to utilize the tool.
Furthermore, since CityEngine is meant to be a design tool, there is a lot of freedom in how to generate buildings. Therefore, it is easy to have biases in the way that rules are written to generate textures from CityEngine. Instead, it is much preferred to generate buildings based on a statistical knowledge of the world so that biases can be avoided.
This brings us to AutoCity: a system which not only alleviates our dependency on CityEngine, but also generates buildings based on our existing statistical knowledge of the world.
3.2
System Overview
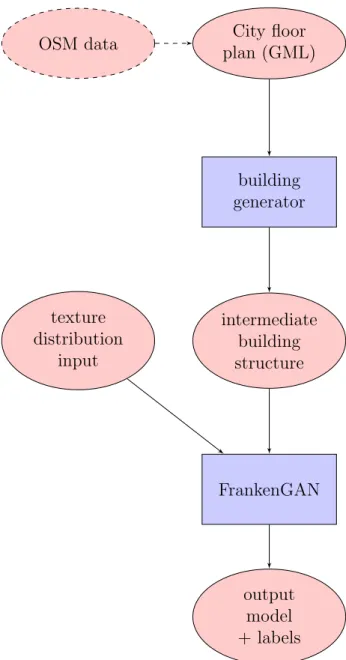
At a high level, our system is a two-stage pipeline: the first stage is building creation, and the second stage is the generation of detailed facades for the buildings. To start, the user must first provide a footprint of the city they wish to create, in the form of a Geographical Markup Language (.gml) file. The output of the first pipeline is a list of 3D models for each of the buildings generated from the footprint, in the form of a group of .obj files. We then input the list of .obj files into the second part of the pipeline. The group of .obj files, together with an optional input of texture parameters, will generate a corresponding output of .obj files with textured facades on each of the buildings. The second part of the pipeline will also generate set of label .obj files which replaces the texture of window panes with red and blue labels. This gives flexibility to our user in case they want to replace the material textures with their own. Figure 3-1 provides a visual overview of the pipeline and the data.
City floor plan (GML) OSM data building generator intermediate building structure texture distribution input FrankenGAN output model + labels
Figure 3-1: An overview of the input flow of our pipeline. The blue rectangular components are parts of our pipeline, whereas red circular components are the data. OSM data is shown with a dotted line because it is not necessarily to have OSM data if the user already has the .gml data that they need.
3.2.1
Interface and Usage
AutoCity is operated using a combination of command-line interface (CLI) and a graphical user interface (GUI). In this section, we will describe how a user can utilize the system.
System requirements
The user needs python3 to run scripts and Java 11 or higher to run the FrankenGAN subprogram. A machine with an Nvidia GPU is highly recommended, as inference using FrankenGAN will take a long time if there is no dedicated GPU. AutoCity also has a graphical component; if the user has a machine with a GPU but no monitor attached, see Appendix A.2 for notes on using the secure shell protocol (ssh) to run graphical applications remotely. It is also recommended to have Blender to view intermediate and final .obj files. All source code and corresponding binaries that are mentioned below can be downloaded in URLs specified by Appendix A.1.
Preparing City Footprint Data
To start, the user must acquire a .gml file of the city that they want to generate. The user can easily convert most geographical feature file types to .gml using online tools, and one easy way to get city data is from OpenStreetMap. It is recommended to place this file within a dedicated folder so that the system can generate intermediate files.
Preparing Config File for Building Generation
Configuration variables for generating buildings are located in autocityconfig.py. At minimum, the user must define two variables: ROOT FOLDER, which locates the root folder for outputting intermediate outputs (usually the folder of the .gml file), and GML FILE, which locates the .gml file that is needed to run the code. All other variables are specific for generating buildings, and can be changed as needed.
Running building generation
The first part of the system, which generates buildings, can be run using the command python generateBuildingObjs.py. After running this command, the user can check to see that intermediate .obj files have been generated. In particular, a buildings/ directory should have been created inside the root folder, and it should be populated with many .obj files, each containing a building, and a todo.list that lists all of the .obj files. There will also be a .obj file generated on the same level of the buildings/ directory; this file has all generated buildings in one .obj file for easy debugging and viewing in Blender.
Running texture and facade generation
Once the user has checked the intermediate .obj files, the user can then run the second part of the pipeline. The second part of the pipeline requires two running components: a python script which actively listens for building input and generates output using FrankenGAN, and a Java .jar program which will continuously feed input to the python script. We recommend that the user has two terminal windows, one running the python script and one running the Java program.
To start the python script, the user can execute python test interactive.py from the FrankenGAN repository and leave that terminal open for as long as they are generating textures.
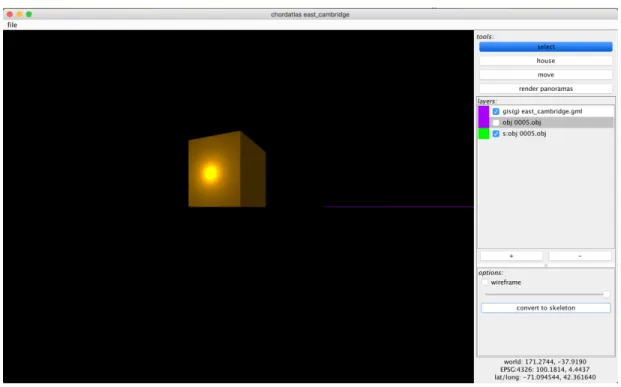
To start the Java program, the user should first make sure they have a compiled version of the program obtained from Appendix A.1. Then, the user can execute java -jar -Xmx20g chordatlas.jar. Once in the Java program, the user will see an interface similar to that of Figure 3-2. On the left, we see a big window which renders the scene, and the user can use the mouse together with the keys W/A/S/D/Q/Z to move around the scene. On the top right, we see a list that describes all the objects that are currently in our world. On the bottom right, we see a small window, which we can use to interact with our current selected object.
Figure 3-2: An example of what the graphical user interface, chordatlas, looks like.
1. The user should click file -> new... and select the directory that is set as ROOT FOLDER in autocityconfig.py.
2. The user should add the GML file used to generate buildings. Click “+” on the bottom right and choose gis (gml), and then find the GML file. Note that this step simply determines the homography of the viewing window and does not actually contribute to to the generation.
3. The user should click file -> settings.... Under bike gan root, the user should input the directory where the python script test interactive.py is being run.
4. The user saves by clicking file -> save. After completing these 4 steps, the user will no longer need to repeat these steps in the future.
5. The user should add the generated todo.list file which contains information about all the .obj files. Click + on the bottom right and choose + mesh (obj, group), and then find the todo.list file. This should add an object to the
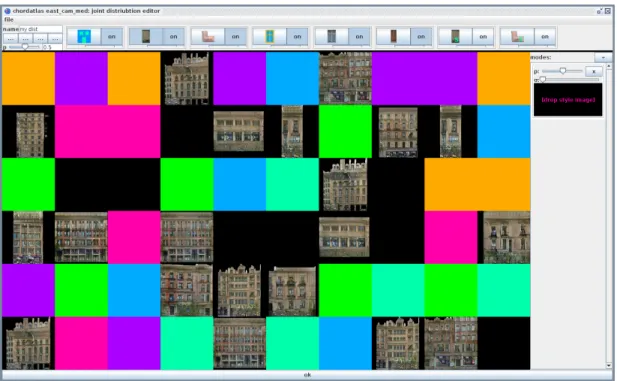
Figure 3-3: The user interface for selecting the probability of each joint of the Franken-GAN pipeline. The textures are generated with FrankenFranken-GAN, and the color segments are yet to be computed. The user can right click on the drop style image part of the interface on the right in order to adjust the mean and standard deviation of the distribution.
right side of the window, and if the user moves around the scene, they should be able to find the loaded mesh.
6. On the bottom right, the user should click convert to skeleton.
7. (Optional) On the bottom right, the user can select edit joint (all), and a new window will popup to allow the user to edit the probability distribution of each part of the FrankenGAN pipeline. An example view is in Figure 3-3. After editing, the user can click OK on the bottom of the window to exit.
8. On the bottom right, the user can select one of generate textures (medium) or generate textures (super) to run the network with either normal resolu-tion or with super resoluresolu-tion. For more informaresolu-tion on what difference between normal and super resolution are, see Section 3.3.3.
Each building is contained in its own numbered folder.
Depending on the number of buildings, the finished models will be completed in different amounts of time. For an approximate runtime of the program, see Section 4.2. We recommend that the user check for power-saving settings on their machine to ensure that the machine does not go to sleep even with the running graphical program.
Visualizing output
The output of texture generation is a group of folders, each of which contains the .obj and .mtl files for one building model, which can then be imported into Blender for viewing. In the source code is a script, gather obj.py, which can help with rendering all the files from separate folders. The script can be run with the following command at the location of the Blender binary: ./blender --python [path to gather obj.py] -- [path to franken out].
For each building, there are also .obj and .mtl files which describe the labels on the building. These files are stored under franken out/[buildingNum] labels/. They can be viewed similarly as the regular output files.
3.3
System details
We now dive into the modules of the system and detail how we compute the building models and textures.
3.3.1
Input
The pipeline takes, as input, a .gml file. We decided on using .gml as the standard input because .gml is a very commonly used and accepted language in expressing geographical features [6]. The recommended way of acquiring .gml files is via Open-StreetMap, an open source online wikipedia for city plans. OpenStreetMap gives us source files in .osm format, which can be easily converted to a .gml using online
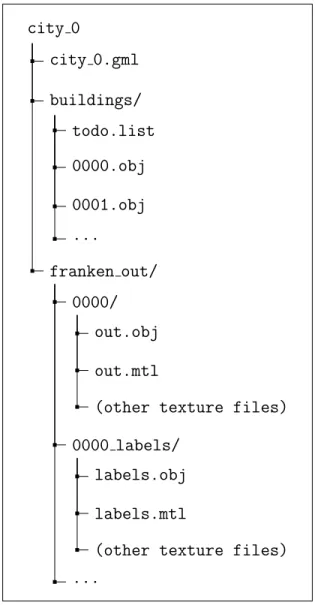
city 0 city 0.gml buildings/ todo.list 0000.obj 0001.obj ... franken out/ 0000/ out.obj out.mtl
(other texture files) 0000 labels/
labels.obj labels.mtl
(other texture files) ...
Figure 3-4: A typical directory tree after running the entire AutoCity pipeline. The folder buildings/ is generated as an intermediate result, and the folder franken out is generated as the output of the entire pipeline. The scripts can be located anywhere with respect to the directory tree.
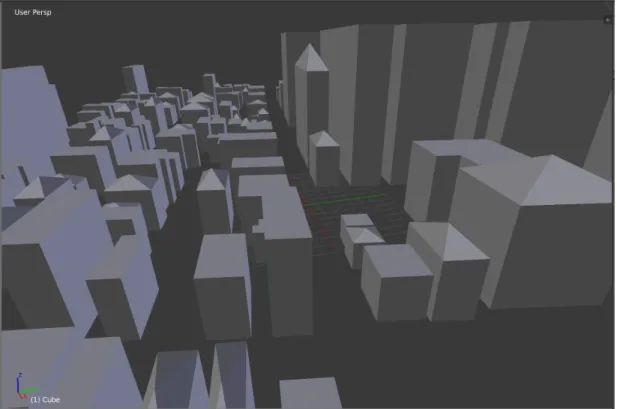
Figure 3-5: A sample generated city with roof generation probability 0.6.
tools. Our system is currently tested with GML coordinate system EPSG:4326, but it should be extendable to all other coordinates.
3.3.2
Building Generation
The first step of the pipeline is the generation of buildings from the GML file. There are a few variables and algorithms that can be fine tuned for better generation, which are scaling, height, and roof of a building. An example of a generated city can be seen in Figure 3-5.
Model Scaling
First, we will examine scaling. The footprint data stored in the .gml file is stored using some sort of coordinate system, which depends on the specific GML file. For example, many GML files use EPSG:4326, which is used by most GPS navigation systems [14]. If we generate buildings using these coordinates, however, they will be too small for the second stage of our pipeline. That is because the second stage of
our pipeline has an inherent understanding of size so that windows and doors can be properly scaled to human size. Therefore, when using different GML systems, we we have to multiply each edge of our model by a SCALING variable inside the autocityconfig.py file. Specifically, for EPSG:4326, a scaling factor of 25000 to 35000 seems to work well.
Building Height
The height of the building is calculated very simply in order to avoid writing exces-sive rules. Inside the autocityconfig.py file, the user can specify two variables, the MAX HEIGHT that a building can be, and also whether all buildings have the same height, determined by the boolean SAME HEIGHT. If SAME HEIGHT is false, the build-ing’s height depends on the max edge length of the building footprint. If the buildbuild-ing’s max edge length is greater than MAX HEIGHT, then its height will be MAX HEIGHT. Oth-erwise, its height is the max edge length.
This algorithm is currently very simple and it would be interesting to either extend this to a more statistical model, or use a more reconstructive method and attempt to retrieve the actual heights of the buildings.
Roofs
The roof of buildings are also designed simply. By default, the tops of the buildings are flat. There is an option to turn on roof generation; if we do generate roofs, we currently only generate roofs for buildings with four vertices, as buildings with more vertices tend to be concave. For buildings with four edges, roofs are generated with a convergence point at the center of mass of its four vertices, and the height of the roof is some fraction of the height of the building.
There are three variables that control the generation of roofs: GEN ROOFS, which determines whether we have more sophisticated roofs; ROOF PROB, the probability that a building has a roof; and finally, ROOF HEIGHT FACTOR, which is the aforementioned factor that describes the height of the roof.
Known Problems
There are a few known problems with building generation. Since we cannot express curves in .gml files, if a building is a smooth circular shape, GML expresses building footprint as a polygon with many sides. This effect is undesirable, as we want to treat the entire smooth surface as one wall instead of many walls. Unfortunately, there is currently not a way to express a smooth wall in this system. Currently, polygons with too many walls narrow walls are simply ignored. This can be a possible extension for future work.
3.3.3
Texture Generation
The generation of texture uses a Java subsystem called chordatlas. chordatlas is a program with a graphical user interface that is designed for urban design, which also can be used to run FrankenGAN. A large part of this thesis has been collaborating with the original creator of chordatlas, Tom Kelly, in order to integrate functionality that we desire in our pipeline.
FrankenGAN
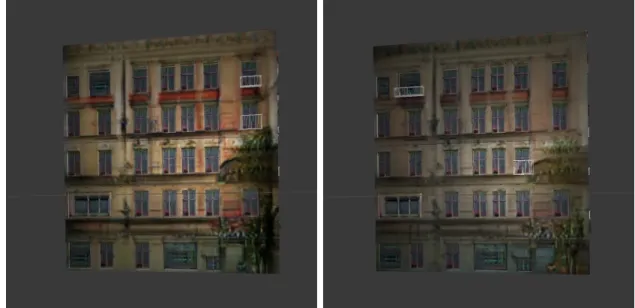
FrankenGAN is a multi-step generative adversarial network trained on various fa-cades and roof datasets. When using the model for inference, the model textures the building in stages, first starting with the labels and ending with detailed texture gen-eration. The user can input different starting mean values to the model to get outputs of different appearances; some examples can be shown in Figure 3-7. Optionally, the user can indicate whether they wish to generate the output with super resolution.
Single Building
We will explain how chordatlas generates detailed facades on a single building, and then this easily extends to how we do this for many buildings at once. Internally, chordatlas works on procedural models, which means that every building is repre-sented by vertical walls and roof parts rather than just as a generic mesh, like in an
Figure 3-6: Two versions of generated textures for the same building, by supplying a different mean from the texture distribution.
.obj file. In order to use FrankenGAN on our .obj file, we first load our building model as an ObjGen object. We can do so visually by pressing “+” in chordatlas and adding a “mesh (obj).” We then convert ObjGen into a procedural model type, ObjSkelGen, using the fact that buildings generally consist of walls and roofs. This is equivalent to clicking “convert to skeleton” on the graphical user interface, and details of implementation can be found in ObjGen.java. (It is currently untested what would happen if we import a model with walls that are not perpendicular to the ground.) In ObjSkelGen, we can choose the texture distribution that we desire for our model. Finally, we send our model to FrankenGAN, which is equivalent to clicking “redraw distribution” on our object. This sends images of our walls, roofs, and profiles of our building to a specific folder. The running python script listens to the folder, and once received, it processes each image by running it through FrankenGAN, which outputs images of textures or depth maps depending on the specific request. Finally, chordatlas listens for the output of FrankenGAN, and rebuilds the model inside the graphical interface. Once the inference by FrankenGAN is complete, the output is automatically saved to franken out/.
Multiple Buildings
For multiple buildings, the process is exactly the same. Instead of loading a single model to ObjGen, we load a list of models to ObjGenList, which then get converted to ObjSkelGenList. The inference is ran exactly the same as for one building, except each building is processed sequentially.
Super resolution
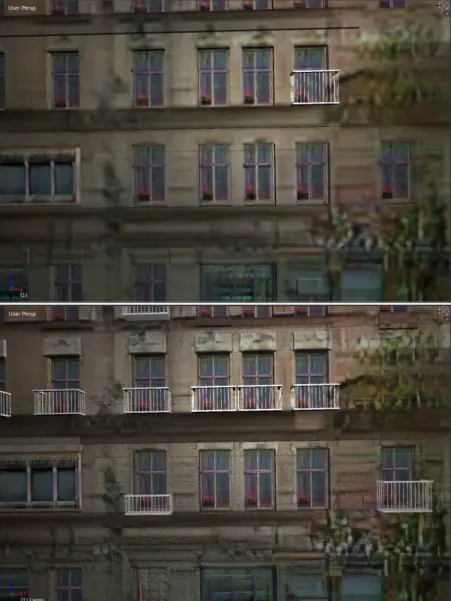
When generating textures, the user has a choice between running with normal reso-lution and super resoreso-lution. When running with super resoreso-lution, we use a slightly different GAN that has been trained to generate texture detail such as bricks from low-resolution input. For a more visual understanding of how the results differ, see Figure 3-7.
3.3.4
Output
We automatically save the buildings after they have been textured, using a call-back function that is called after each stage of FrankenGAN. That is also how we get the labels on parts of the building; we save after the facades labels part of FrankenGAN has finished generating. Details of the implementation can be found in ObjSkelGenList.java.
Figure 3-7: Two versions of generated textures for the same building, one with normal resolution and one with super resolution. The image on the top is with normal resolution, while the image on the bottom is with super resolution.
Chapter 4
Generated Cities
In this chapter, we show and discuss some results of our pipeline, starting with the output facade geometry and later delving into the output labels. We will also show some views of some of the cities that we generated with AutoCity. Finally, we will discuss some of our performance metrics.
4.1
Output buildings
4.1.1
Geometries
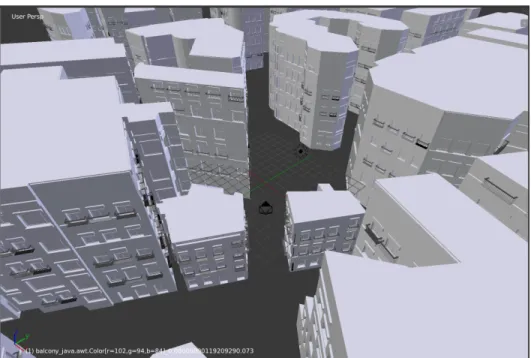
Our system generates complicated and realistic facade geometries for the buildings. In Figure 4-1, we can see that in a zoomed in view of a rather complex building, the geometries look very detailed and realistic. Corners of the building are handled particularly well. In Figure 4-2, we see that as a large generated city, the facade geometries are still detailed and add the necessary detail to make the buildings look realistic. The generated geometries shown are not generated with roofs.
4.1.2
Labels
As part of our output, we generate textured buildings with colors as labels so we can easily change the texture for window panes if the user so wishes. An example output is shown in Figure 4-3. The labels are stored in material files and can be easily parsed.
Figure 4-1: Generated geometries for a polygonal building.
Figure 4-2: Generated geometries from a view of the city. The geometries are consis-tent and realistic.
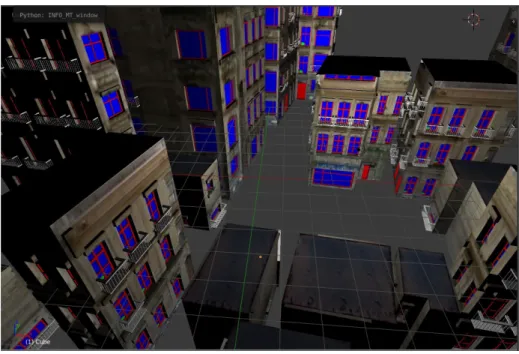
Figure 4-3: A visual representation of the labels of the AutoCity output. Glass textures are labelled with dark blue, whereas other parts are labelled with red.
4.1.3
City
We show some views of the cities that we have generated in Figure 4-4; these views are generated without super resolution to show the realism of the buildings even without super resolution. We also generated some views of cities with super resolution, which looks much more realistic up close. We include a comparison between normal resolution and super resolution in Figure 4-5. We can see that, while normal resolution output is sufficient for looking realistic far away, super resolution looks much more real up close.
4.2
Performance
Generation of buildings take on the order of seconds, as following rules procedurally does not take too much computational time. Most of the computation time is on texture generation. On average, generating textures on a single building takes around 8 minutes, and generating textures on super resolution takes around 35 minutes. Buildings that are taller and have more faces will take more time to compute.
Figure 4-4: Some random views of our city as output. The shown buildings are generated without super resolution.
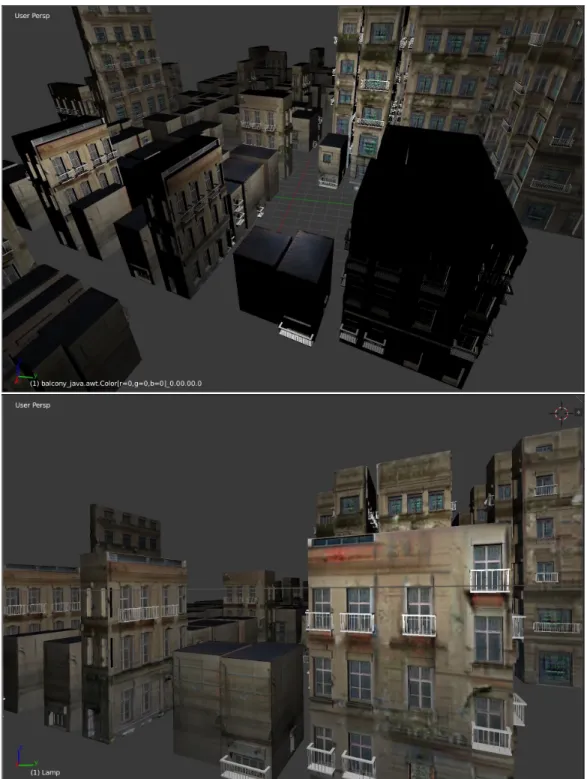
Figure 4-5: Similar angles of two cities, one generated without super resolution (top), and one generated with super resolution (bottom). The images on the right are zoomed in versions of the images on the left.
Chapter 5
Conclusion
In this thesis, we presented AutoCity, a pipeline that automatically generates a tex-tured city given building footprints. The user has the option to provide texture parameters, or the parameters can be generated by default. We solve the problem of dependency on city model-generation software, and we are able to see a variety of buildings and textures. Our contribution are the city generation pipeline, and a lot of work in improving the existing chordatlas software to become the texture generation part of the pipeline.
5.1
Future Work
There are many potential areas of improvement with AutoCity. Most of the problems are with the ease of use of the system and some with the quality and variety of output. One large area of improvement is AutoCity’s use of a Graphical User Interface with chordatlas. While it is helpful to have a GUI when testing, for large scale generation, it is not too helpful to have a GUI because the GUI simply freezes during texture generation. The added need for a GUI simply makes the texture generation process more tedious and prone to problems. One step that we could take is to turn all of texture generation (chordatlas) to a Command Line Interface.
Another area of improvement is AutoCity’s building generation. While footprints are generated using reconstructive methods and detailed facades are generated
sta-tistically, the main skeletal geometry of the buildings are generated with procedural methods, where all buildings are prisms with even height throughout the building. Furthermore, the height and existence of roofs of all buildings are determined by very simple rules. We also currently do not have a way to understand buildings with cylindrical shapes. We could potentially explore datasets for buildings and use a more statistical method for geometry generation, so that the method is less procedural and that we have more variety in buildings.
One other area of improvement is training a better version of FrankenGAN. Cur-rently, the limitations of FrankenGAN is that there is a limited space of building facades that could be generated, and there are some problems with texture gener-ation where green areas will appear on random parts of building textures. These limitations are largely due to a lack of facades and roof data when training Franken-GAN. We could construct more datasets to train FrankenGAN to get better results.
Appendix A
Downloading and Running the
System
A.1
Source Code Location
The source code for each part of the sytem can be found at the following links:
• FrankenGAN: https://github.com/twak/bikegan
• chordatlas: https://github.com/leekkww/chordatlas
• all other scripts: https://github.com/leekkww/autocity
The binary for chordatlas can be found at the GitHub README file.
A.2
SSH with Graphical User Interface
Working on a powerful remote machine with no monitor can be problematic with AutoCity, as texture generation only happens when the GUI for chordatlas is actively opened. One way to go around this is to ssh with X11, which opens a graphical user interface even during an ssh session. Unfortunately, if we use ssh with X11, because of protocol limitations, we can only use OpenGL features up to OpenGL1.4. However, chordatlas needs features from OpenGL2+. To get around
this, we recommend using X11 forwarding over SSH with VirtualGL. VirtualGL intercepts OpenGL calls, renders on the remote server, and then transports the final image to the local machine. A note for how this is done can be found on https://www.scm.com/doc/Installation/Remote_GUI.html.
Bibliography
[1] Tom Kelly, Paul Guerrero, Anthony Steed, Peter Wonka, and Niloy J. Mitra. FrankenGAN: Guided Detail Synthesis for Building Mass-Models Using Style-Synchonized GANs. 2018. https://arxiv.org/abs/1806.07179
[2] Phillip Isola, Jun-Yan Zhu, Tinghui Zhou, and Alexei A. Efros. Image-to-Image Translation with Conditional Adversarial Nets. 2017. https://arxiv.org/abs/1611.07004
[3] ESRI. CityEngine. 2016. http://www.esri.com/software/cityengine
[4] Nishchal Bhandari. Procedural Synthetic Data for Self-Driving Cars Using 3D Graphics. 2018. MIT EECS.
[5] Gen Nishida, Ignacio Garcia-Dorado, Daniel G. Aliaga, Bedrich Benes, and Adrien Bousseau. Interactive sketching of urban procedural models. 2016. https://dl.acm.org/citation.cfm?id=2925951
[6] Open CityGML datasets. 2018. https://www.citygml.org/3dcities/
[7] Jun-Yan Zhu, Taesung Park, Phillip Isola, and Alexei A. Efros. Unpaired Image-to-Image Translation using Cycle-Consistent Adversarial Network. 2017. https://arxiv.org/abs/1703.10593
[8] Andreas Stolcke, and Stephen M. Omohundro. Inducing Probabilistic Grammars by Bayesian Model Merging. 1994. https://arxiv.org/abs/cmp-lg/9409010 [9] Zhiyong Wang, Alexander Zipf. Using OpenStreetMap Data to
Gener-ate Building Models with Their Inner Structures for 3D Maps. 2017. https://doi.org/10.5194/isprs-annals-IV-2-W4-411-2017
[10] Dmitry Marakasov. Glosm: 3D OpenStreetMap renderer. 2011. https://github.com/AMDmi3/glosm
[11] Alexander Zipf. Integration of OpenStreetMap and Digital Elevation Model and their use by means of interoperable GI-Web Services. 2012. http://www.osm-3d.org/home.en.htm
[12] Tobias Knerr. Converter that creates three-dimensional models of the world from OpenStreetMap data. 2018. http://osm2world.org/
[13] Tom Kelly, John Femiani, Peter Wonka, Niloy J. Mitra. BigSUR: Large-scale Structured Urban Reconstruction. 2017. https://doi.org/10.1145/3130800.3130823
[14] EPSG:4326, Horizontal component of 3D system. 2007. https://spatialreference.org/ref/epsg/wgs-84/
[15] Jia Deng, Wei Dong, Richard Socher, Li-Jia Li, Kai Li, and Li Fei-Fei. ImageNet: A Large-Scale Hierarchical Image Database. 2009. http://www.esri.com/software/cityengine
[16] Balaji Lakshminarayanan, and Yee Whye Teh. Inferring ground truth from multi-annotator ordinal data: a probabilistic approach. 2013. https://arxiv.org/abs/1305.0015
[17] Richard Zhang, Phillip Isola, and Alexei A. Efros. Colorful Image Colorization. 2016. https://arxiv.org/abs/1603.08511
[18] Leon A. Gatys, Alexander S. Ecker, and Matthias Bethge. Im-age Style Transfer Using Convolutional Neural Networks. 2016. https://ieeexplore.ieee.org/document/7780634
[19] Hayko Riemenschneider. Yet Another Computer Vision Index To Datasets. 2018. http://riemenschneider.hayko.at/vision/dataset/index.php
[20] Radim Tyleˇcek and Radim ˇS´ara. Spatial Pattern Templates for Recognition of Objects with Regular Structure. 2013. http://cmp.felk.cvut.cz/~tylecr1/facade/
[21] Olivier Teboul. Ecole Centrale Paris Facades Database. 2011. http://vision.mas.ecp.fr/Personnel/teboul/data.php
[22] Dengxin Dai, Hayko Riemenschneider, Gerhard Schmitt, and Luc Van Gool. Example-based Facade Texture Synthesis and Inpainting. 2013. http://www.vision.ee.ethz.ch/~daid/FacadeSyn/