DIAGNOSTIC NEURORADIOLOGY
MTR variations in normal adult brain structures
using balanced steady-state free precession
Meritxell Garcia&Monika Gloor&Oliver Bieri&
Stephan G. Wetzel&Ernst-Wilhelm Radue&
Klaus Scheffler
# Springer-Verlag 2010 Abstract
Introduction Magnetization transfer (MT) is sensitive to the macromolecular environment of water protons and thereby provides information not obtainable from conventional magnetic resonance imaging (MRI). Compared to standard methods, MT-sensitized balanced steady-state free preces-sion (bSSFP) offers high-resolution images with significant-ly reduced acquisition times. In this study, high-resolution magnetization transfer ratio (MTR) images from normal appearing brain structures were acquired with bSSFP. Methods Twelve subjects were studied on a 1.5 T scanner. MTR values were calculated from MT images acquired in 3D with 1.3 mm isotropic resolution. The complete MT data set was acquired within less than 3.5 min. Forty-one brain structures of the white matter (WM) and gray matter (GM) were identified for each subject.
Results MTR values were higher for WM than GM. In general, MTR values of the WM and GM structures were in good accordance with the literature. However, MTR values showed more homogenous values within WM and GM structures than previous studies.
Conclusions MT-sensitized bSSFP provides isotropic high-resolution MTR images and hereby allows assess-ment of reliable MTR data in also very small brain structures in clinically feasible acquisition times and is
thus a promising sequence for being widely used in the clinical routine. The present normative data can serve as a reference for the future characterization of brain pathologies.
Keywords Magnetization transfer ratio (MTR) . Balanced steady-state free precession (bSSFP) . High-resolution imaging . Normative MTR values
Introduction
Magnetization transfer is based on the exchange of spin magnetization between free water protons (the so-called liquid pool) and those bound to macromolecules (“semi-solid or (“semi-solid pool”) [1–4], thus providing information beyond conventional T1- and T2-weighted MRI.
In its simplest form of quantification, magnetization transfer (MT) effects are condensed into so-called magnetization transfer ratio (MTR) images based on the acquisition of two images, i.e., one with and one without MT saturation of semisolid protons, respectively [1, 5–7]. Although MTR imaging has been applied for the characterization of different pathologies, including brain infarction, tumors, and white matter (WM) lesions [3,5,8–14], this technique is still not a widely established method in the daily clinical routine, especially due to its long acquisition times. In addition, MTR suffers from its difficulty to be reproduced across different studies as it is very sensitive to pulse sequence details and relaxation properties [1, 7, 12, 15,16]. Further-more, clinical limitations on power absorption, i.e., specific absorption rate (SAR), preclude a complete saturation of the restricted pool protons, hereby making data interpretation and standardization difficult [15,17]. In addition, the comparabil-ity of MTR values is complicated by several technical issues, M. Garcia (*)
:
S. G. Wetzel:
E.-W. RadueDepartment of Neuroradiology, Institute of Radiology, University of Basel Hospital,
Petersgraben 4, 4031 Basel, Switzerland e-mail: [email protected] M. Gloor
:
O. Bieri:
K. SchefflerDivision of Radiological Physics, Institute of Radiology, University of Basel Hospital,
Basel, Switzerland
DOI 10.1007/s00234-010-0714-5
such as field strength, MT saturation and sequence properties, B1-inhomogeneity, and subject positioning [18]. However, reproducibility and standardization of MTR data are prereq-uisites for diagnostic accuracy, therapeutic trials, and multi-center studies [16].
So far, two major methods for MT using MT-prepared spoiled gradient echo (SPGR) methods have been described in the literature that mainly differ from the state in which magnetization is measured, that is: either in steady-state [2,
12,17,19,20], or during the transition to steady-state [4,
13,14].
Only recently, a new MT-sensitized method using balanced steady-state free precession (bSSFP) was pro-posed [21, 22], which is based on a modification of the duration of the radiofrequency (RF) pulses used. In contrast to common MT-prepared imaging, bSSFP provides high-resolution whole brain MTR within short and thus clinically feasible acquisition times. Since MT-sensitized bSSFP circumvents the need for additional MT saturation pre-pulses, repetition times can be kept exceptionally short (i.e., typically within 3–5 ms yielding an acquisition time of 3.5 min with 1.3 mm isotropic resolution) and the missing off-resonance pre-pulses additionally promise a reduced sensitivity to B1 field inhomogeneities and subject posi-tioning [23]. Furthermore, the signal-to-noise ratio (SNR) of 3D MT-bSSFP is typically about two times the SNR of 3D MT-prepared SPGR [22].
In this study, normal appearing cerebral structures from 12 healthy volunteers were acquired using MT-sensitized bSSFP with an isotropic resolution of 1.3 mm in order to create a normative high-resolution MTR data set that may serve as a source of reference for the evaluation of pathologies in the future. In addition, MTR values were compared with previously published data achieved by MT-SPGR [12,24–26].
Materials and methods Image acquisition
All measurements were obtained at a 1.5 T MR clinical whole body scanner (Avanto, Siemens Medical Solutions, Erlangen, Germany), equipped with a 12-channel head coil. Twelve healthy subjects (six males and six females, age range 26–45 years, mean age 36 years) underwent an imaging protocol including an axial unenhanced turbo spin-echo (TSE) T1-weighted sequence, an axial TSE T2-weighted sequence, and an axial turbo inversion recovery magnitude sequence for anatomical exclusion of incidental findings. Images from a sagittal 3D inversion recovery magnetization prepared rapid gradient echo (repetition time/ echo time (TR/TE)=1,760 ms/3.35 ms, inversion time= 906 ms, α=7°, bandwidth=190 Hz/Pixel) were used for
anatomical reference. For calculation of MTR maps, MT-sensitized bSSFP was used (α=35°, bandwidth=790 Hz/ Pixel, matrix size 192×192×144, yielding 1.3 mm isotropic resolution) with varying RF pulse duration (TRF), having TR/TRF =2.92/0.23 ms and TR/TRF =4.78/2.1 ms of the MT- and non-MT-sensitized image acquisition, respectively [22]. The complete MT data set (MT- and non-MT-sensitized images) was acquired within less than 3.5 min. Image post-processing
After brain segmentation and image registration using FSL [27] and AFNI [28], MTR maps were calculated from two bSSFP acquisitions with different pulse durations (TMT=
0.23 ms, Tnon-MT=2.1 ms) according to MTR=100 (S0−
SMT)/S0[%], where S0and SMTcorresponded to the signal
amplitude measured with Tnon-MTand TMT, respectively [7].
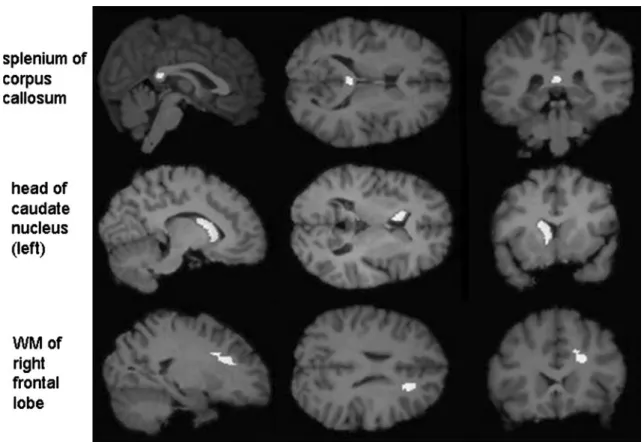
Forty-one (five unilateral, 36 bilateral) brain structures were identified and corresponding masks were drawn by an experienced radiologist, covering: (1) the deep WM and gray matter (GM) of all four lobes (frontal, temporal, parietal, and occipital) bilaterally; (2) the head of the caudate nucleus, the putamen, the globus pallidus, the thalamus, the mamillary body, the amygdala, the hippocampus, the anterior and posterior limb of the internal capsule (IC), and the crus cerebri bilaterally; and (3) as midline structures the anterior commissure and the four different parts of the corpus callosum (CC) (rostrum, genu, body, and splenium). For the frontal, temporal, and occipital lobes, masks were created at the transition from the superior to the medial gyrus and sulcus, respectively, whereas the masks for the parietal lobe were drawn at the transition from the parietal lobulus to the angular gyrus. The lateral borders of the GM masks of the cerebral cortex were omitted to avoid inclusion of extracere-bral or adjacent WM tissue. For all the other cereextracere-bral structures, masks did not include the structures’ anatomical margins to avoid partial volume effects from adjacent tissue or cerebral spinal fluid.
Due to some cases’ relevant differences in the volunteers’ head configuration and size of evaluated brain structures, all masks were drawn for each subject individually using FSL [27] (FSL, Oxford, UK, www.fmrib.ox.ac.uk/fsl). Bilateral masks were drawn symmetrically in both hemispheres. All masks were reviewed by a second experienced radiologist for anatomical localization and size. Examples for WM and GM structure masks are presented in Fig.1. Evaluation of created MTR masks was performed using Matlab (The MathWorks, Inc., Natick, MA, USA; Fig.2).
Statistical analysis
For the analysis of differences between the right and left hemisphere (side), the WM and GM tissue (type of tissue), and
the single subjects, two-way analysis of variances (ANOVA) were performed, as this test enables the assessment of several grouping variables simultaneously. For the assessment of differences between types of brain tissue (WM/GM) and side (right/left) a two-way ANOVA based on MTR values was factored into side (right/left) and type of brain tissue (WM/ GM), whereby only the bilateral structures were considered. In a second two-way ANOVA (based on MTR values) factored into type of brain tissue (WM/GM) and all 12 subjects, both bilateral and midline structures were included. Differences were considered to be statistically significant for p<0.01.
For a more detailed assessment of the differences within the single WM and GM structures, respectively, a post hoc
analysis for the evaluation of found significant differences in the prior ANOVA tests was performed using Tukey’s multiple comparisons procedure. This was done for both series of the ANOVA analysis.
Results
In general, MTR was higher in WM as compared to GM structures, and average (over the subjects) MTR values of the single brain structures investigated are summarized in Tables 1and 2.
Fig. 2 MTR parametric maps in the axial (left), coronal (middle), and sagittal (right) plane, obtained from a healthy subject by the 3D-bSSFP method with an isotropic resolution of 1.3 mm
Fig. 1 Sagittal (left), axial (middle), and coronal (right) images showing masks located in the splenium of the corpus callosum (upper row), head of the left caudate nucleus (middle row), and white matter of the right frontal lobe (lower row)
For WM, highest MTR values were found in the frontal lobe, followed by the splenium, genu, and rostrum of the CC, whereas lowest MTR values were observed in the crus cerebri. For GM, lowest MTR values were found in the frontal cortex and caput nucleus caudatus, whereas the thalamus, amygdala, and globus pallidus showed the highest MTR values. Despite of the general higher MTR in WM, the higher MTR values for the thalamus (GM structure) were not statistically significantly different from MTR values for the anterior commissure and crus cerebri (WM structures). No significant MTR difference between the right and left hemisphere was observed for all bilateral WM and GM structures investigated. However, the ANOVA tests showed a significant difference between the average of the 12 subjects and the average in WM and GM structures, respectively (F value for the WM structures 78.53 with a p (>F) of 0.0000; F value for the GM structures 24.60 with a p (>F) of 0.0000).
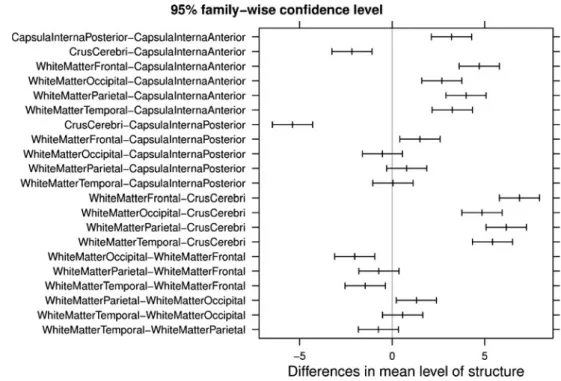
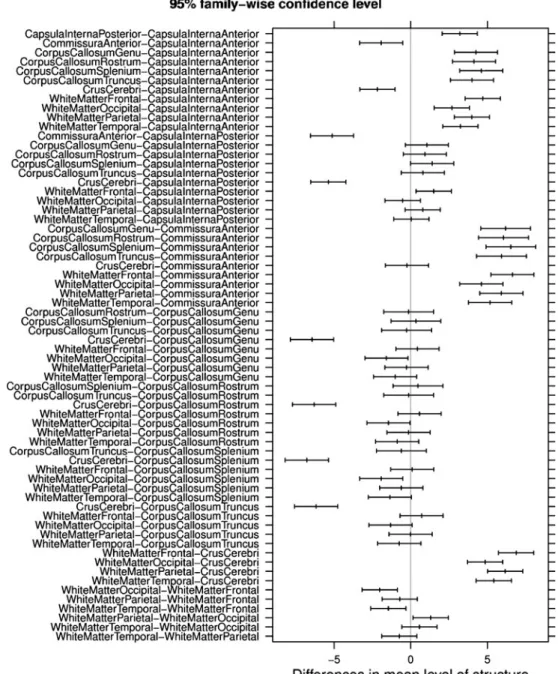
The post hoc analyses of the MTR assessing the differences within all single WM and GM structures, respectively, showed a number of highly significant differences (Figs. 3,4,5, and6).
Among the WM structures a significant difference was found between the anterior and the posterior limb of the internal capsule. Here, MTR values were significantly higher in the posterior as compared to the anterior limb (Figs.3 and5). Furthermore, highly significant differences within WM structures were observed in the posterior limb of the internal capsule as compared to the crus cerebri as well as for the frontal WM in comparison to the crus cerebri (Figs.3 and5).
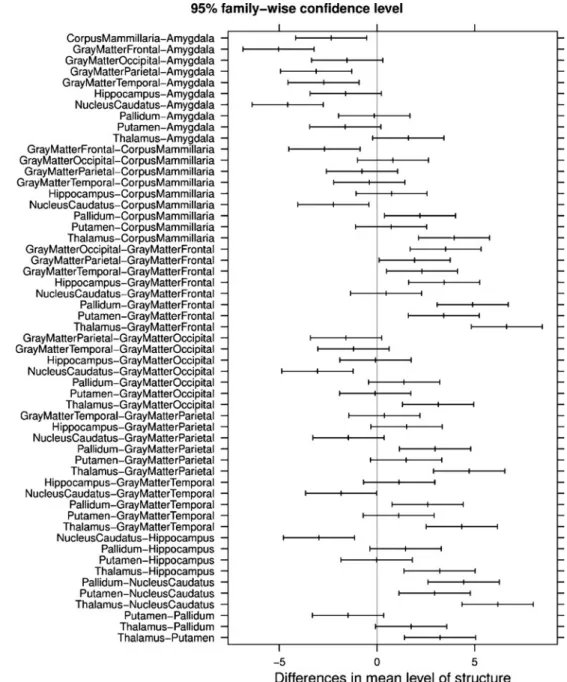
Within the GM tissue highly significant differences in MTR were observed between the frontal GM and amygda-la, caput nucleus caudatus and amygdaamygda-la, thalamus and frontal GM as well as the thalamus and caput nucleus caudatus (Figs.4 and6).
WM structure Present study 3D-bSSFP Mehta et al. [24] 2D T1-SPGR MTR [%] ΔMTR (%) MTR [%] ΔMTR (%) WM frontal 43.9±0.2 +5.1 36.6±0.5 +0.6 CC splenium 43.8±1.1 +4.8 37.7±0.3 +3.7 CC genu 43.5±2.1 +4.1 40.7±0.3 +11.9 CC rostrum 43.4±1.9 +3.9 n.a. n.a. WM parietal 43.2±0.3 +3.4 34.6±0.5 −4.9 CC truncus 43.2±1.8 +3.4 n.a. n.a. WM temporal 42.5±0.3 +1.7 38.2±0.3 +5.0 Int. capsule, crus posterior 42.4±0.4 +1.5 38.1±0.3 +4.8 WM occipital 41.9±0.2 +0.3 38.2±0.2 +5.0 In. capsule, crus anterior 39.2±0.3 −62 34.3±0.3 −5.7 Anterior commissure 37.3±2.7 −10.7 29.9±0.7 −17.8 Crus cerebri 37.1±0.5 −11.2 35.4±0.6 −2.7 Table 1 MTR values (%, mean
±SD) for different white matter brain structures of the present study and the study of Mehta et al.
Additionally, relative differences (ΔMTR) to the mean MTR value (41.8% and 36.4%) across all structures are given for both studies
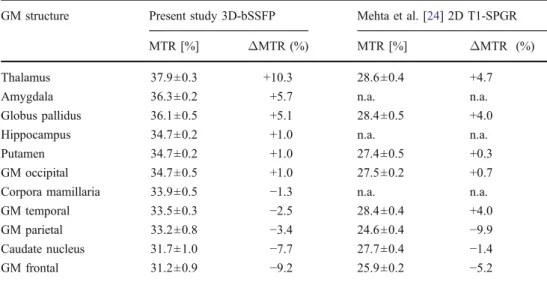
GM structure Present study 3D-bSSFP Mehta et al. [24] 2D T1-SPGR MTR [%] ΔMTR (%) MTR [%] ΔMTR (%) Thalamus 37.9±0.3 +10.3 28.6±0.4 +4.7 Amygdala 36.3±0.2 +5.7 n.a. n.a. Globus pallidus 36.1±0.5 +5.1 28.4±0.5 +4.0 Hippocampus 34.7±0.2 +1.0 n.a. n.a. Putamen 34.7±0.2 +1.0 27.4±0.5 +0.3 GM occipital 34.7±0.5 +1.0 27.5±0.2 +0.7 Corpora mamillaria 33.9±0.5 −1.3 n.a. n.a. GM temporal 33.5±0.3 −2.5 28.4±0.4 +4.0 GM parietal 33.2±0.8 −3.4 24.6±0.4 −9.9 Caudate nucleus 31.7±1.0 −7.7 27.7±0.4 −1.4 GM frontal 31.2±0.9 −9.2 25.9±0.2 −5.2 Table 2 MTR values (%, mean
±SD) for different gray matter brain structures of the present study and the study of Mehta et al.
Additionally, relative differences (ΔMTR) to the mean MTR value (34.4% and 27.3%) across all structures are given for both studies
Concerning the deep WM and the cortex also several statistical differences for MTR between matched pairs of WM and GM structures, respectively, could be observed between the different regions (frontal, temporal, parietal, and occipital; Figs.3,4,5, and6).
Comparison of relative MTR values of same brain structures were overall in good accordance with the study of Mehta et al. [24], the hitherto largest and most complete study assessing normative MTR data [22] (Tables1and2).
Discussion
Our MTR results did in overall agree with those of prior studies from normal brain structures [12,24–26], especially with the larger MTR study by Mehta et al. [24]. For example, the CC, cerebral WM, and internal capsule showed maximum MTR, whereas for the GM the highest MTR was observed in the thalamus, according to the study of Mehta et al. [24].
As in the study of Mehta et al. [24], the posterior limb of the internal capsule showed significantly higher MTR than the anterior limb. One hypothesis could be that the long and large-diameter axons composing the corticospinal tract and whose cell bodies reside in the primary motor cortex might be a major cause for the higher MTR observed in the posterior limb of the internal capsule, reflecting high myelination.
However, slight differences were observed between studies. For instance, for the CC the highest MTR was
found in the splenium, whereas Mehta et al. [24] observed highest MTR in the genu. In contrast to the study of Mehta et al. [24], but in accordance with the study of Ramani et al. [12] the highest MTR value within the deep WM was detected in the frontal lobe. For the GM structures, in this study the MTR for the thalamus was not significantly different from the MTR for the WM structures of the anterior commissure and crus cerebri, differing from the results by Mehta et al. [24].
MTR values in general and especially for the CC and for WM appear to be more homogeneous in this study as compared to values found by Mehta et al. [24]. This is most likely due to hardware improvements, in particular improve-ments in B1 field homogeneity, over the past 15 years.
One advantage of the MT-sensitized bSSFP technique is its high resolution. When regarding the MTR values within the WM and GM structures, respectively, each of the two types of brain tissue showed more homogeneous values than in the study of Mehta et al. [24]. Furthermore, the high resolution enabled the evaluation of reliable MT values in even very small brain structures, as reflected by their small standard deviation. Thus, the smaller and more difficult to delineate structures like the corpora mamillaria and hippo-campus, which MTR values have not been described before, showed quite homogeneous values among all GM structures in our study. Larger deviations like the notably lower MTR value of the anterior commissure in contrast to the other WM structures in the study of Mehta et al. [24] can most likely be attributed to the small size of this structure being impaired by partial volume effects, given the slice thickness of 5 mm in the study of Mehta et al. Fig. 3 Confidence intervals on
Tukey’s honest significant dif-ferences between the means of white matter structures with a 95% family-wise probability of coverage for MTR (ANOVA factored in side (left/right) and structure)
[24]. This is an important factor, as high resolution enables more accurate evaluation of small structures, hereby enhanc-ing diagnostic reliability and accuracy. This might be especially important for the detection of very small lesions or, e.g., incipient MS lesions that are too small or too subtle to be assessed with low-resolution MTR. In addition, the signal of bSSFP is considerably higher than that of 3D-SPGR (typically around two times), yielding higher SNR at exceptionally short repetition times (3–5 ms).
A further advantage of MT-based bSSFP over MT-SPGR is the markedly lower and consequently clinically applica-ble acquisition time. Especially the need of the magnetiza-tion preparamagnetiza-tion step, i.e., the addimagnetiza-tion of the MT-sensitizing off-resonance pulse prior to the proper MT measurement in
standard methods using MT-SPGR, makes these sequences very time consuming, requiring TRs exceeding 20 ms. This is especially a problem, e.g., in situations when agitated patients are scanned, or if scan time is limited due to the restricted therapeutic time window, like in stroke patients. MT-sensitized bSSFP, however, circumvents the need for additional MT saturation pre-pulses since the on-resonant RF pulses used for imaging are responsible for the MT effect. Therefore, repetition times and consequently the overall acquisition time can be kept exceptionally short. Similar to standard MTR sequences, SAR is a limiting factor with MT-sensitized bSSFP, which might become an issue with increasing field strength. Nevertheless, the feasibility of MTR scans with MT-sensitized bSSFP has Fig. 4 Confidence intervals on
Tukey’s honest significant dif-ferences between the means of gray matter structures with a 95% family-wise probability of coverage for MTR (ANOVA factored in side (left/right) and structure)
been demonstrated also at ultra-high field strengths [29]. Whether off-resonance or on-resonance irradiation concepts with similar irradiation power are more advantageous in terms of the achievable contrast-to-noise ratio has been a matter of controversy over the last two decades. Whereas several authors claimed an advantage for on-resonance irradiation concepts [30, 31], other studies indicated very comparable results [32,33]. From this, except for the gain of a factor two in the SNR, similar SAR properties are expected for MT-sensitized bSSFP as compared to standard off-resonance MT-prepared SPGR methods.
Limitations of the study include the small number of subjects examined and their narrow age range (26– 45 years), preventing a subdivision of the patient pool into
different age ranges. MTR has been shown to increase gradually with normal brain maturation during childhood [34], whereas in the elderly small, but significant age-related reductions in MTR in selective WM regions have been reported [26]. However, in the study of Mehta et al. [24], in which a larger patient pool with a wide age range was studied and subdivided into different age groups, no significant differences in MTR values could be observed across the different age groups up to the age of 80 years. Rovaris et al. [35], who among others studied the influence of aging on MTR, did also not find a significant age-related correlation for MTR. Hence, further studies are necessary in order to evaluate to what extent MTR reflects changes in the normal aging adult brain.
Fig. 5 Confidence intervals on Tukey’s honest significant dif-ferences between the means of white matter structures with a 95% family-wise probability of coverage for MTR (ANOVA factored in structure and subject)
Due to the intrinsic MT-weighting of bSSFP without additional RF pulses, making this sequence much less sensitive to pulse sequence details and therefore theoreti-cally MR-scanner independent, bSSFP-based MT should provide standardization of MT data and MT comparison across studies, which could promote a more widespread use of MT. Recently, intra- and inter-scanner variability of MTR using bSSFP has been shown to be very low [23]. However, large clinical studies with this method on different scanners are necessary in order to assess to what extent MT-bSSFP is really device independent.
In conclusion and in contrast to standard MT-SPGR, bSSFP-based MT imaging provides high-resolution MTR images with significantly reduced and thus clinically applicable acquisition times. The high-resolution 3D MTR
data obtained in this study can be taken as a normative baseline data set for the characterization and evolution of pathologies of the brain.
Acknowledgments The authors would like to thank Thomas Zum-brunn (PhD) and Thomas Fabbro (PhD) for support of statistical analysis. Conflict of interest statement We declare that we have no conflict of interest.
References
1. Cercignani M, Symms MR, Schmiere K et al (2005) Three-dimensional quantitative magnetization transfer imaging of the human brain. NeuroImage 27:436–441
Fig. 6 Confidence intervals on Tukey’s honest significant dif-ferences between the means of gray matter structures with a 95% family-wise probability of coverage for MTR (ANOVA factored in structure and subject)
2. Henkelman RM, Huang X, Xiang QS, Stanisz GJ, Swanson SD, Bronskill MJ (1993) Quantitative interpretation of magnetization transfer. Magn Reson Med 29:759–766
3. Sled JG, Pike GB (2001) Quantitative imaging of magnetization transfer exchange and relaxation properties in vivo using MRI. Magn Reson Med 46:923–931
4. Wolff SD, Balaban RS (1989) Magnetization transfer contrast (MTC) and tissue water proton relaxation in vivo. Magn Reson Med 10:135–144
5. Dousset V, Grossman RI, Ramer KN et al (1992) Experimental allergic encephalomyelinitis and multiple sclerosis: lesion character-ization with magnetcharacter-ization transfer imaging. Radiology 182:483–491 6. Barker GJ, Tofts PS, Gass A (1996) An interleaved sequence for accurate and reproducible clinical measurement of magnetization transfer ratio. Magn Reson Imaging 14:403–411
7. Ou X, Gochberg DF (2008) MT effects and T1 quantification in single-slice spoiled gradient echo imaging. Magn Reson Med 59:835–845
8. Pui MH (2000) Magnetization transfer analysis of brain tumor, infection, and infarction. J Magn Reson Imaging 12:395–399 9. Okumura A, Takenaka K, Nishimura Y et al (1999) The
characterization of human brain tumor using magnetization transfer technique in magnetic resonance imaging. Neurol Res 21:250–254
10. Fazekas F, Ropele S, Enzinger C et al (2005) MTI of white matter hyperintensities. Brain 128:2926–2932
11. Inglese M, Salvi F, Iannucci G, Mancardi GL, Mascalchi M, Filippi M (2002) Magnetization transfer and diffusion tensor imaging of acute disseminated encephalomyelitis. AJNR Am J Neuroradiol 23:267–272
12. Ramani A, Dalton C, Miller DH, Tofts PS (2002) Precise estimation of fundamental in-vivo MT parameters in human brain in clinically feasible times. Magn Reson Imaging 20:721–731 13. Tozer D, Ramani A, Barker GJ, Davies GR, Miller DH, Tofts PS
(2003) Quantitative magnetization transfer imaging of bound protons in multiple sclerosis. Magn Reson Med 50:83–91 14. Davies GR, Tozer DJ, Cercignani M et al (2004) Estimation of the
macromolecular proton fraction and bound pool T2 in multiple sclerosis. Multiple Sclerosis 10:607–613
15. Tofts PS, Steens SCA, van Buchem MA (2003) MT Magnetization transfer. In: Tofts P (ed) Quantitative MRI of the brain: measuring changes by diseases, 1st edn. Wiley, New York, pp 257–298 16. Berry I, Barker GJ, Barkhof F et al (1999) A multicenter
measurement of magnetization transfer ratio in normal white matter. J Magn Reson Imaging 9:441–446
17. Sled JG, Pike GB (2000) Quantitative interpretation of magneti-zation transfer in spoiled gradient echo MRI sequences. J Magn Reson 145:24–36
18. Barker GJ, Schreiber WG, Gass A et al (2005) A standardised method for measuring magnetisation transfer ratio on MR imagers different manufacturers—the EuroMR sequence. MAGMA 18:76–80
19. Lee RR, Dagher AP (1997) Low power method of estimating the magnetization transfer bound-pool macromolecular fraction. J Magn Reson Imaging 7:913–917
20. Yarnykh VL (2002) Pulsed Z-spectroscopic imaging of cross-relaxation parameters in tissues for human MRI: theory and clinical applications. Magn Reson Med 47:929–939
21. Bieri O, Scheffler K (2006) On the origin of apparent low tissue signal in balanced SSFP. Magn Reson Med 56:1067–1074 22. Bieri O, Scheffler K (2007) Optimized balanced steady-state free
precession magnetization transfer imaging. Magn Reson Med 58:511–518
23. Gloor M, Scheffler K, Bieri O (2009) Intra- and inter-scanner variability of magnetization transfer ratio using balanced SSFP. Pro Intl Soc Mag Reson Med, Honolulu, Hawaii, USA
24. Mehta RC, Pike GB, Enzmann DR (1995) Magnetization transfer MR of the normal adult brain. AJNR Am J Neuroradiol 16:2085– 2091
25. Papanikolaou N, Maniatis V, Pappas J, Roussakis A, Efthimiadou R, Andreou J (2002) Biexponential T2 relaxation time analysis of the brain: correlation with magnetization transfer ratio. Invest Radiol 37:363–367
26. Silver NC, Barker GJ, MacManus DG, Tofts PS, Miller DH (1997) Magnetisation transfer ratio of normal brain white matter: a normative database spanning four decades of life. J Neurol Neurosurg Psychiatry 62:223–228
27. Smith SM, Jenkinson M, Woolrich MW et al (2004) Advances in functional and structural MR image analysis and implementation as FSL. Neuroimage 23:S208–219
28. Cox RW (1996) AFNI: software for analysis and visualization of functional magnetic resonance neuroimages. Comput Biomed Res 29:162–173
29. Bieri O, Mamisch TC, Trattnig S et al (2008) Steady state free precession magnetization transfer imaging. Magn Reson Med 60:1261–1266
30. Hu BS, Conolly SM, Wright GA et al (1992) Pulsed saturation transfer contrast. Magn Reson Med 26:231–240
31. Schneider E, Prost RW, Glover GH (1993) Pulsed magnetization transfer versus continuous wave irradiation for tissue contrast enhancement. J Magn Reson Imaging 3:417–423
32. Hua J, Hurst GC (1995) Analysis of on- and off-resonance magnetization transfer techniques. J Magn Reson Imaging 5:113– 120
33. Graham SJ, Henkelman RM (1997) Understanding pulsed magnetization transfer. J Magn Reson Imaging 7:903–912 34. Engelbrecht V, Rassek M, Preiss S, Wald C, Mödder U (1998)
Age-dependent changes in magnetization transfer contrast of white matter in the pediatric brain. AJNR Am J Neuroradiol 19:1923–1929
35. Rovaris M, Iannucci G, Cercignani M et al (2003) Age-related changes in conventional, magnetization transfer, and diffusion-tensor MR imaging findings: study with whole-brain tissue histogram analysis. Radiology 227:731–738