State-of-the-Art
Risk Assessment: Aquatic Ecosystems
Data Ranges in Aquatic Toxicity of Chemicals
Consequences for Environmental Risk Analysis
Guntram Koller I, K o n r a d Hungerbiihler 1, Karl Fent 2
1 ETH, Safety and Environmental Technology Group, Swiss Federal Institute of Technology, ETH-Zentrum, CAB C32.5, Universit~itsstrasse 6, CH-8092 Ziirich, Switzerland;
2 Swiss Federal Institute of Environmental Science and Technology (EAWAG) and Swiss Federal Institute of Technology (ETH), Ueberlandstrasse 133, CH-8600 Diibendorf, Switzerland
Corresponding author: Guntram Koller; e-mail: [email protected]
DOI: httmHdx.doi.orQ/lO.lO65/esDr199911.013
Abstract. A significant problem for effect assessment of aquatic ecosystems arises from the large ranges of toxicity data, which can be found in different databases and literature. Here, ranges are given for the aquatic toxicity of 27 high production volume chemicals. Based on these illustrative examples and on the cur- rent literature on uncertainty in aquatic effect assessment, toxic- ity ranges are discussed for their possible causes (variation in ex- perimental condition, species, endpoint, time) and ways to handle them (safety factors). Implications and recommendations on the procedure of risk analysis of chemical substances are drawn. Two main requirements for a comprehensive risk assessment are identified, which often play a minor role in current practice (as they are often neglected) as well as in scientific discussion (as they are meant to be trivial). First, data quality must be checked critically before applying any result of a toxicity test. Secondly, experimental data should take into account different species and acute as well as chronic data. If these aspects are considered in risk analysis, which is common practice in ecotoxicology but not always in the context of practical appli- cations in risk engineering, a more comprehensive picture of the environmental toxicity of a chemical substance can be obtained.
Keywords." Aquatic toxicity, data range, ecological risk assess- ment, effect assessment, uncertainty
1 I n t r o d u c t i o n
The risk posed on aquatic ecosystems by man-made sub- stances is an important part of all environmental risk analy- sis methods proposed by legal or scientific bodies. In the effect analysis as part of the environmental assessment, it is tried to estimate a concentration which has no undesired effects on the aquatic ecosystem. N o Effect Levels (NEL), No Observed Effect Concentrations (NOEC), Predicted N o Effect Concentrations (PNEC) or aquatic quality criteria are examples of such concentrations. The aquatic effect assess- ment in environmental risk analysis is usually based on a set of toxicity data obtained from environmental databases, published toxicological studies or a set of values directly measured in toxicological experiments.
Almost all toxicity data are based on laboratory tests. As these tests have been highly standardized [1], the experi-
mental conditions for each toxicological endpoint and spe- cies are clearly defined based on Good Laboratory Practices (GLP). The effects observed at different concentrations are interpreted using a statistical model to obtain the toxic con- centration for the endpoint. These statistical models and their implications on the results of the study are reviewed by Chapman et al. [2]. The experimental results obtained are published in a toxicological report or included in some kind of database. Because of this standardization, results of tox- icity tests are usually well documented in toxicological stud- ies. However, documentation decreases largely as soon as secondary information sources are considered. Many envi- ronmental databases do not include background informa- tion about the test conditions such as exact description of the endpoint, p H of exposure water, etc. The quality of docu- mentation of toxicity data in material safety data sheets (MSDS) is even worse, although MSDS are an important data source for environmental risk assessment in industrial practice. Such background information about the exact test conditions, however, is essential for interpreting the results, as all toxicity data have to be questioned critically before being applied in risk analysis.
A major problem often encountered during risk assessment is the lack of ecotoxicological data covering key species in ecosystems. This holds in particular for chronic toxicity data. This problem of uncertainty because of missing information is addressed by estimating toxicity data via QSAR methods [3] or by estimating safe concentrations using safety factors (uncertainty factors). Most international bodies issued guide- lines on which factors to apply in order to account for the different sources of uncertainty [4]. The scientific commu- nity is discussing these factors [5,6] intensively.
In the case of chemicals where a sufficient set of toxicity data exists, one major problem of aquatic effect assessment is the large range of data for the same chemical substance. Toxic concentrations can vary by several orders of magni- tude depending on experimental conditions, species, end- point, exposure time (acute - chronic) and aquatic test envi- ronment (laboratory - field). Several studies are available reporting ranges of aquatic toxicity data. Especially the dif- ference between acute and chronic data has been studied intensively for a broad field of substances [7]. Other studies
ESPR - Environ. Sci. & Pollut. Res. 7 (3) 135 - 143 (2000)
@ ecomed publishers, D-86899 Landsberg, Germany and Ft. Worth/TX, USA ~ Tokyo, Japan 9 Mumbai, India ~ Seoul, Korea
Risk Assessment: Aquatic Ecosystems
State-of-the-Art
report the range of aquatic toxicity for a specific group of chemicals especially insecticides and herbicides [8,9]. For com- modity chemicals produced at high volumes, however, illus- trative examples for the ranges of aquatic toxicity data are missing. This is somehow astonishing as a sufficient amount of data exists and as these substances (for instance solvents) play an important role in every-day risk assessment.
If a sufficient amount of reliable and well-documented data is available to the environmental risk manager, the toxicity ranges can be considered and the "safe" concentration for protecting ecosystems can be estimated. Detailed guidelines for aquatic risk assessment are available at many interna- tional bodies in order to simplify and harmonize the meth- ods. These guidelines should provide every user, not only "experts" in ecotoxicology knowing the theoretical back- ground of aquatic toxicology, with an easy-to-use "manual" on how to perform environmental risk assessment. How- ever, there is no consensus on a scientifically and politically accepted framework for aquatic effect assessment. Especially the concept of using NOEL values for estimating "safe" concentrations has been criticized [10,11,12,13] and effect concentration at low effect levels (EC5, ...) were proposed as alternatives. Despite all guidelines, collection and inter- pretation of toxicity data still requires time and background knowledge in order to avoid misinterpretation. As the time available for performing a rigorous study on environmental risk is decreasing continuously at today's economic situa- tion, practitioners are faced with the problem of not having enough time for a comprehensive literature search for the aquatic toxicity of a substance.
Despite all problems of missing data, poor data quality, large toxicity ranges and methodological discussions, practitioners sometimes believe effect assessment to be possible by simply selecting a few single values for the aquatic toxicity of a sub- stance according to published guidelines without any toxico- logical background knowledge. This would largely simplify and speed-up the risk analysis process, but can lead to misin- terpretations and wrong results. Similar practical problems and misunderstandings are described in the literature [14]. The goal of this study is to highlight the problems associated with the application of aquatic toxicity data in risk analysis by giving illustrative examples of 27 selected bulk chemicals.
We want to show that in effect assessment, the aquatic toxic- ity of a compound should be based on a concentration range instead of one or a few single values. After analyzing the dif- ferent reasons for the toxicity ranges, we discuss the current concept of safety factors with respect to the aquatic toxicity of the selected substances. Some recommendations are given, pleading for a critical use of a full set of data when assessing the toxicity of a chemical substance to aquatic ecosystems.
2 Methods
In order to obtain a comprehensive picture of the problems in applying aquatic toxicity data in environmental risk analy- sis, 27 substances of different chemical classes were selected. Their aquatic toxicity data were presented graphically for different species and endpoints.
The basis for selection was a list of High Production Vol- ume Chemicals in the U.S. (production volume > 50,000 t) which contains many important bulk chemicals. The sub- stances were selected, when a sufficient number of toxicity data was available in public databases (at least ten acute values and two chronic values). As an additional criterion, the selected substances should play an important role in fine chemical industry (such as solvents) and they should cover different chemical substance classes. Inorganic acids and bases were not considered, as their toxic effect is usually based on the pH change. The selected 27 substances are listed for each class in Table 1 (note that substances can be men- tioned more than once). Most substances exert their toxic effect through narcosis and membrane toxicity and act by an unspecific mode of action. Only some of them have other and specific mechanisms of toxicity such as the cyanides. Data for the aquatic toxicity of the chemicals were taken from two different databases. ECDIN (Existing Chemicals Data Information Network - http://ecdin.etomep.net/) is a publicly available database of the European Community and includes all substances of the EINECS (European Inventory of Existing Chemical Substances) with varying amounts of data. The toxicological information was selected from pri- mary literature by experts. ECDIN has not been kept up to date for a few years, as a new database system, IUCLID (International Uniform Chemical Information Database), is
Table 1: Selected substances Substance class
Aliphatic hydrocarbon
Substance : / : : : :
Hexane
Halogenated compound Methylene chloride, p-chlorophenol, dimethytethylhexadecylammoniumbromide Ether Diethylether, tetrahydrofuran
Alcohol, phenol Methanol, ethanol, isopropanol, phenol, p-chlorophenol Aldehyde, ketone Formaldehyde, dimethylformamide, acetone
Acid and derivatives Oleic acid, hydrogen cyanide, ethylacetate, acrylonitrile
Amine Ammonia, diethanolamine, pyridin, dimethylethylhexadecylammoniumbromide Long chain compound Oleic acid, dimethylethylhexadecylammoniumbromide
Aromatic compound Phenol, toluene, p-chlorophenol
Salt NaNO2, NaBr, NaOCI, NiCI v (NH4)2SO., NaCN
State-of-the-Art
Risk Assessment: Aquatic Ecosystems
being developed. The second database used in this study is the IGS-database (Informationssystem Gef/ihrliche Stoffe) built by Swiss Authorities (Nationale Alarm Zentrale, http: //www.aac.ch/IGS/root.htm). It contains toxicity data from different other sources (databases) which were selected with- out further quality control.
For each substance, all toxicity data were exported from the external databases and saved as a text file. After creating a new database (Microsoft Access), all data files were im- ported. In a first set of calculations, the data were trans- formed into a standardized format (SI-units, endpoint cat- egories according to chapter 2.1). Secondly, the following quality criteria were applied on the data:
1. Data were rejected if no information about species or end- point was available or if no result was given (10 % of data). 2. In a few cases, concentration ranges were given instead of single values. If the range exceeded the factor of 5, data were not used (e.g. effect concentration (growth, 40% increase) of toluene to alga: 0.1-10 rag/l). In the case of smaller ranges, the lower value was used (pre- cautionary principle).
It was not possible to apply additional quality criteria, as the documentation of some data was incomplete (see chapter 4.1).
2.1 Definition of endpoint categories
Five different endpoint categories were used in this study in order to simplify the graphical representation (LCh0, Ef- fect, Chronic, LOEL, NOEL). These categories are based on toxicological endpoints but some of them are defined slightly different. "LCh0" contains all acute LC50 values. The category "LOEL" includes all endpoints where a low- est concentration causing toxic effects was described. There- fore, not only Lowest Observed Effect Concentrations ac- cording to the toxicological definition were included, but also values extrapolated from a dose response relationship (e.g. ECh). The following endpoint descriptions were col- lected in the category "LOEL" : ECh, E e l 0 , LCh, LC10 (EC: effect concentration, LC: lethal concentration, number re- fers to percentage of total effect 100%), LOEL, threshold level. Similarly, the category "NOEL" is used to show all endpoints which in the data source were mentioned as EC0, LC0, no effects, NEL (No Effect Level), NOEL or NOAEL (No Observed Adverse Effect Level). This exceeds the toxi- cological definition of a NOEL.
All endpoints not included so far were summarized in the categories "Effect" and "Chronic". If a chronic endpoint could be identified, the category "Chronic" was applied. All remaining acute data or data without sufficient infor- mation about the time of the experiment were collected in the "Effect" category. If a LCh0 value (e.g. 28 days in fish) was reported, it is shown as "Chronic" and not as "LCh0" value in all graphs9 All acute lethal concentrations besides the LCh0 values (such as LC100, LC25, total mortality) are presented in the category "Effect".
This classification results in one narrowly defined endpoint category (" LCh0") and four broad categories summarizing
similar endpoints. All data were graphically presented using these categories.
3 R e s u l t s
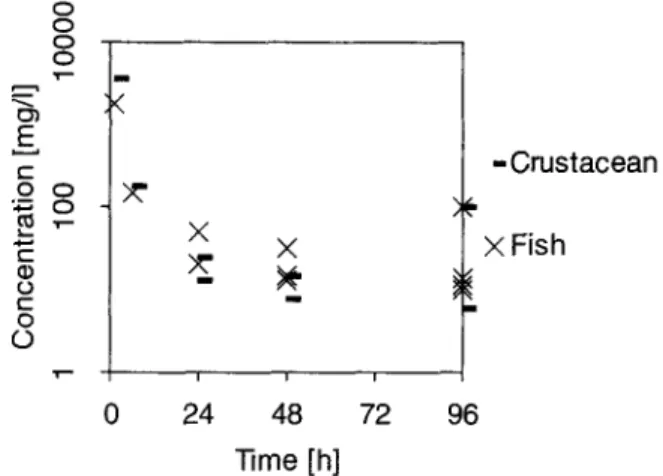
3.1 Experimental parameters influencing toxicity The exact experimental conditions are of highest importance for obtaining comparable results in toxicological studies. For acrylonitrile, the time course of toxicity is shown in Fig. 1. The LCh0 / ECh0 values for Leuciscus idus decrease for 2-3 orders of magnitude when comparing values for 1 and 96 hours. This is a well-known fact of the toxicological response of organisms and only the 96h value will be used in effect assessment. However, if the time information is not included in the data-source, these two values can not be distinguished and the variability of toxicity results can not be explained. An experiment for measuring the aquatic toxicity of a given substance can be designed as static or flow-through test de- pending on the mode of adding and controlling the tested substance. As soon as volatile, degradable or adsorbable sub- stances are tested, this can lead to large ranges in results. Fig. 2 illustrates this problem using the highly volatile ac- etone as example. Toxicity data for Daphnia magna are lower
o o o o c o o "E o o c o o • X m i i i 0 24 48 72 96 ] ] m e [h] - Crustacean e X Fish m
Fig. 1" Influence of time on L C 5 0 / EC50 values of acrylonitrile o o o o o
d o
g g
E o o O o n X u s f s f s f s f s fLC50 Effect Chron LOEL NOEL
- Crusta- cean X Fish
Fig. 2: Influence of w a t e r f l o w on toxicity of acetone, s: static, f:
f i o w t h r o u g h
R i s k A s s e s s m e n t : A q u a t i c E c o s y s t e m s S t a t e - o f - t h e - A r t
by a factor of 1000, if flow-through tests are compared to static experiments. As acetone evaporates, the effective con- centration can largely decrease during static experiments, In flow-through tests, acetone is added throughout the ex- periment to keep a constant concentration. Therefore a much higher amount of acetone added at the beginning was re- quired in the static test to reach equal toxic effects as in flow-through experiments.
Similar differences in toxicity data can be caused by differ- ences in the pH-value of the experiment, if protonable or deprotonable substances are tested.
3.2 Comparison within related species
Aquatic toxicity strongly depends on the animal or plar~ species under consideration. As an example, the toxicity of toluene for different fish species is shown in Fig. 3. Between the different species, the LC50 values vary by the factor of 200 (interspecies variability). Within one species (intraspe- cies variability) the range is smaller and does not exceed a factor of 10. Effect-concentrations exhibit higher ranges (factor of 5,000). This fact can mainly be contributed to differences in the measured effect
(Cyprinus:
blood serum concentration;Leuaiscus:
letal effects; other fish species: behavior, reproduction). Toluene as an example corresponds quite well with the ranges of intraspecies variability which generally is reported not to exceed a factor of 10 for most substances [5]. 10000 1000 E ~ lOO~
lO
o 0 0.1 " ~ - ~ - , = Chronic X Effect - LC50 NOEL 8 = ~- g P~ ~ ~"Fig. 3: Intra- and interspecies variability in toxicity of t o l u e n e to dif-
ferent fish s p e c i e s
3.3 Comparison of different species
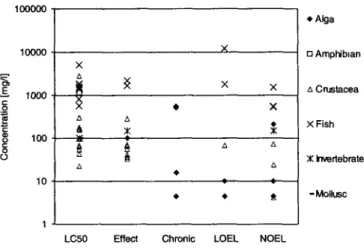
To illustrate the species differences, the aquatic toxicity of diethanolamine is shown in Fig. 4 as a representative ex- ample. Similar graphs were built for all 27 substances but are not shown here. Diethanolamine is known to be toxic to liver and kidney of higher vertebrates. At the cellular level it leads to changes in the phospholipids of the cell membranes [15]. Some carcinogenic effects are reported as well, as nit- rosamines can be formed during metabolism [15]. LC50
values range between 20 and 5,000 mg/l. The ranges within fishes and crustacean span a factor of about 10. For one alga,
Skeletonema costatum,
the toxic concentration lies two orders of magnitude below that of other algae species(Scenedesmus, Selenastrum) (see
chronic and NOEL values ofFig. 4).
High interspecies variabilities and high sensitivi- ties have been reported for algae also for other compounds [16]. Crustaceans and algae are the most sensitive species for diethanolamine, whereas fishes are a factor of 100 less sensitive. If only fish data were used for an effect assess- ment, the risk would largely be underestimated even if a safety factor of 10 were used.100000 1000O g o 0 10 • x A ~ x x 9 X , 5 ,', ~ o ~, A 9 O 9 9 t: LC50 Effect C h r o n i c L O E L NOEL Fig. 4: A q u a t i c toxicity of d i e t h a n o l a m i n e 9 Alga [] AmphibDan z~ Crustacea XFish X iwertebrate - Mollusc
3,4 Comparison of different substances
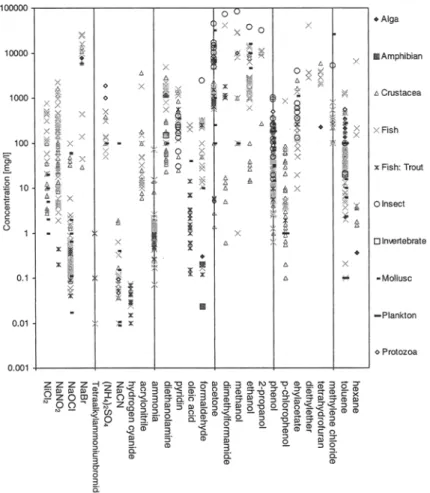
Fig. 5 ( ~ p. 139)gives an overview of the acute aquatic tox- icity of all 27 substances (without NOEL and LOEL val- 'ues). All substances are roughly ordered by decreasing po- larity starting with salts at the left-hand side and ending with hexane on the right. On first sight, the large ranges of aquatic toxicity can be seen which cover two to four orders of magnitude for most substances. Higher variabilities (fac- tor of 100,000) can be observed for NaOCI, formaldehyde, acetone, dimethylformamide and methanol. Some single val- ues at the higher end of the concentration range can be ex- plained with inadequate experimental design (static tests: ammonia, NaOCI, NaNO2, acetone; short test periods: acry- lonitrile). Applying more restrictive quality criteria would reduce the ranges for the mentioned substances by a factor of 10 to 100. Such strict criteria would, however, remove almost all data for some other compounds.
The largest number of toxicity data were for fish and crus- taceans. Toxicity data for algae and molluscs were available for two thirds and half of the compounds, respectively. A comparison of the toxicity of the different substances to other aquatic organisms was not possible, because data were lack- ing for most substances. No species can be identified which is most sensitive to all substances studied, which is well known in ecotoxicology [8]. General trends of the toxicity results themselves or of the size of the overall variability could not be seen. This is not surprising as different modes of toxic action are involved.
State-of-the-Art
Risk Assessment: Aquatic Ecosystems
Fig. 5: Acute aquatic toxicity (LC20 - LC100, EC20- EC100) of selected substances
Fig. 6: Comparison of endpoints of toxicity to Daphnia magna. _gro: growth _let: mortality, j m m : immobilization, _pho: phototaxis, _eft: other effects, _TLM: probably threshold limit, _loe: LOEL, _noe: NOEL
Risk Assessment: Aquatic Ecosystems
State-of-the-Art
3,5 Comparison of different endpoints
One major reason for ranges in toxic concentrations is the difference in the endpoint measured in the experiments. Sub- lethal effects usually occur at concentrations which do not cause mortality of the organism. Therefore, lethal concen- trations normally have higher values than effect concentra- tions under comparable experimental conditions. First physiological or chemical changes in the organism can al- ready occur at much lower concentrations, where no mac- roscopic effect can be observed. Therefore, the exact de- scription of effect concentrations is essential for interpreting the results of the toxicological study.
Fig. 6 (--) p. 139) shows different endpoints of the toxicity to Daphnia magna. The data picture is not completely consis- tent with theory, partly because quality and quantity of the data was not high enough. NOEL values (except LC0 values) lie at the lower end of the toxic range for most substances. For p-chlorphenol, however, effect concentrations (phototaxis, enzyme inhibition) are reported below the NOEL values (fac- tor of 10). LOEL values can not be found between effect con- centration and No Effect Concentrations, but are spread over the whole range of toxicity data. This fact can be explained with the lack of clear documentation and missing of exact definition of most LOEL values. LC50 values usually are above sublethal effect concentrations by factors between 1 and 10.
4 D i s c u s s i o n 4.1 Quality of data
One of the main practical problems of interpreting toxico- logical data is that the documentation and the quality of the information often is poor, especially in broadly used data sources (such as official databases, MSDS). In this study, no strict quality criteria could be applied, such as minimum testing time, exact description of endpoint and experimen- tal conditions (controlled pH, no static tests) and meaning- ful citation of data source. Especially the IGS-Data source was quite unsatisfactory in this respect, although it is the official database recommended by Swiss Authorities. The exact documentation of the experimental conditions (pH, temperature, static or flow-through, etc.) was only given for half of the results. A rough description of the endpoint (such as EC50) and species (such as fish) was available for almost all data (95%). However, an exact allocation to chronic or acute tests could only be done in 70% of the results, as for the others no testing time was given. On an additional 15%, data could be ascribed as acute values, as LC50 values com- monly are acute endpoints.
In principle, an exact definition of the most common toxi- cological endpoints (such as NOEL, LC50, LOEL, EC50) exists. However, a large variety of descriptions and slightly different definitions exist for most endpoints in toxicologi- cal information systems. This poses problems for users will- ing to interpret toxicological data accordingly. In particular, databases show an astonishing and often unclear variety of endpoint descriptions (e.g. TLM, TDLo, LDLo, threshold value, normal effects, increasing mortality, etc.). In most cases, it was possible to attribute standardized endpoints to
the verbal descriptions; in some other cases, however, the endpoint description (such as "acute" or "chronic") were of limited value. The danger of poor documentation of tox- icity data is the tempting possibility of rejecting undesirable data because of low quality, but of accepting suitable data without critical evaluation. Critical questioning of the toxi- cological data used for risk assessment is a crucial point for avoiding misinterpretation during the assessment process. Fig. I and 2 show how important the experimental conditions (e.g. time, water flow) are for interpreting the results. It should be emphasized that the experimental conditions must be docu- mented for meaningful interpretation. This criterion is fulfilled for most data measured since toxicological experiments were standardized in the 80's, particularly those performed under GLP conditions. As an important quality criterion of toxico- logical information media such as substance datasheets or da- tabases, the full documentation of all important experimental parameters must be included. If this information is missing, selecting a single value or using statistical methods for inter- preting the results can lead to large errors. The aquatic risk can be over- or underestimated by several orders of magni- tude. Additionally, the standardization of ecotoxicological endpoints should be further developed and communicated to the public. Every ecotoxicological endpoint which might not be known by all possible users of the results should be defined clearly when passing on toxicological information. This could avoid misinterpretations and misunderstandings of aquatic toxicity data.
4.2 Data ranges and concept of safety factors
Aquatic toxicity data for a substance always cover a certain concentration range. Several reasons are known for this fact such as differences within a species and between species, endpoints, replicates, exposure time, laboratories and be- tween laboratory and field tests [8]. Using only a single or a few values can never deliver a reliable picture of all ecotoxicological effects of a substance. Thus, toxicity can be over- and underestimated by several orders of magnitude depending on substance and data quality. Only if a suffi- cient amount of reliable data is available covering all men- tioned reasons for variability, a "safe" concentration for the aquatic ecosystem can be estimated. This condition, how- ever, is fulfilled for only a very small number of substances due to different (especially economic) reasons. Usually, only a much smaller number of data which is at the fingertip of the user will be applied. As only some of the ranges can be covered, the remaining uncertainty of missing information has to be dealt with before estimating the "safe" concentra- tion. A similar problem arises when substances with differ- ent levels of information about toxicity are compared. De- tailed aquatic toxicity data for one substance can not be used for comparison if corresponding values are missing for the other substance. To resolve these problems, the concept of safety factors (uncertainty factors) has been proposed. If no chronic or sublethal effect data, or no NOEL values or field studies are available, the use of safety factors has been recommended for extrapolating "safe" concentrations from LC50 values [4]. These factors are based both on policy and
State-of-the-Art
Risk Assessment: Aquatic Ecosystems
science and try to estimate concentrations that are very prob- ably lying below the real values. The goal of safety factors is to keep the probability of underestimating the risk low, in- dependently of the amount of toxicity data. This pragmatic concept allows effect assessment based on single LC50 val- ues. Usually factors of 10 for extrapolation of lethal to sub- lethal, acute to chronic, inter- and intraspecies variability and LOEL to NOEL are proposed. A detailed discussion of these safety factors, their background and problems was done by Chapman et al. [5]. Some aspects are summarized below and discussed with respect to the results of the present study.
4,2,1 Acute-chronic ratio
Chronic toxicity tests cover a considerable part of the life span of organisms. They are quite time consuming and costly to perform and therefore attempts have been made to de- velop extrapolation methods to estimate chronic from acute data. The acute-chronic ratio plays an important role in leg- islation (e.g. water quality criteria in the U.S.) [17]. Using such ratio, the chronic quality criterion (Final Chronic Value) can be estimated from the acute criterion (Final Acute Value). The OECD guidelines propose an average factor of 10, if chronic data are missing. This factor was obtained from the 50% percentile of a study of the ratios between 96h LC50 and chronic NOEL values for 72 substances [7]. The ratios ranged from values of 0.13 to 1300, which is an indication of the problems associated with this extrapolation.
The use of a constant acute-chronic ratio for all substances has been partly supported [6], but is being increasingly criti- cized from an ecotoxicological point of view. The extrapo- lation from acute to chronic toxicity is based on statistical analysis rather than toxicological concepts. In the past, a factor of 10 seemed to be sufficiently protective for most substances and species, as chronic data were quite rare. During the last decade, a number of examples have been reported [5,8], where the ratio between acute and chronic data can not be represented with a constant factor of 10. First, the ratio strongly depends on the species and substance, and second, it can reach much higher values (>1000). This fact is not surprising, as different toxicological mechanisms can be responsible for chronic and acute toxicity. For the 27 substances in this study, conclusions for the acute-chronic ratio could not be drawn, as not enough chronic data of sufficient quality were available.
As this extrapolation is scientifically questionable, it is essen- tial to use chronic data from experiments or substance-spe- cific estimation methods for aquatic effect analysis. The gen- eral safety factors for acute-to-chronic extrapolation can neither predict chronic toxicity, nor assure the protection of aquatic ecosystem when trying to extrapolate "safe" concentrations.
4.2.2 Inter- and Intraspecies variability
Considering the enormous evolutionary diversity of aquatic species, it can be easily understood that different sensitivi- ties exist for the same substance. Evolutional, biological, physiological-morphological and ecological differences be- tween organisms are among the reasons for this diversity.
Some earlier studies [18] reported ranges of a factor of 2- 50 for LC50 values, whereas in recent studies [5,8] much larger ranges (>10,000) were reported. Similar high ranges of several orders of magnitude can be seen in Fig. 5. A sta- tistical evaluation yielding mean and maximal variability strongly depends on the quality criteria applied on the raw data and would therefore not give any additional informa- tion. Even within closely related species, a high variability of a factor of 10,000 was shown for some specific sub- stances such as organophosphate pesticides (e.g. disulfo- ton) [8]. These large ranges are desired as the substances are designed to exhibit high selectivity on a specific group of organisms. For most substances, however, aquatic toxic- ity to similar species does not exceed a range of 10 to 100, especially since detailed guidelines for conducting toxico- logical experiments are being followed.
From the practical point of view, it would be desirable in risk assessment to identify a most-sensitive species, from which extrapolation to all other species would be possible. This would largely simplify risk assessment of new sub- stances, as only one species would have to be tested and the resulting concentration would protect all species. However, such most sensitive species does not exist for several rea- sons. This can be seen in Fig. 5. If crustaceans were assumed to be the most sensitive species, the lowest toxic concentra- tions would be found for 45 % of the substances considered in this study. For 20% of the substances, other species are more sensitive by a factor >100. Applying a safety factor of 10 would not be sufficient for these substances. Thus, for assessing aquatic effects it is essential to have data for sev- eral species of different phyla and trophic levels [8,14].
4.2.3 Extrapolation to different endpoints
Fig. 6 compares different endpoints. General correlations al- lowing extrapolation from one endpoint to another (such as lethal to sublethal effects, LOEL to NOEL) could not be ob- served. Such constant extrapolation factors can be defined with statistical means for ideal data, i.e. data measured in the same laboratory with the same organisms under exactly the same experimental conditions. Applying them on real data from different sources with partly unknown quality can result in large errors and unrealistic values. If such safety factors are used for aquatic effect assessment, the risk can be overesti- mated by several orders of magnitude. Especially, the aggre- gation of a number of factors often leads to unrealistically low values [19]. If NOEL values were extrapolated for the studied substances applying extrapolation factors on LC50 / ECS0 values, the results would be lower by a factor between 1 and 1000 than the real NOEL values. Thus, the current system of endpoint extrapolation estimates values, which are protective but often unrealistically low. One exception might be the safety factor of 10 proposed by the European Union to extrapolate from a LOEL to a NOEL for human effect assess- ment [4]. It can only be applied if the quality of the LOEL is without any doubt. Otherwise this extrapolation might un- derestimate the risk.
General extrapolation factors must not be used to predict toxicity data for other endpoints. For comparison of the
Risk Assessment: Aquatic Ecosystems
State-of-the-Art
aquatic toxicity of two substances (one with a full data set, one with little data), there is no advantage in using any of those factors. From a legal point of view, it is pos- sible to close data gaps using such factors, as they esti- mate more or less "safe" concentrations in order to pro- tect the environment. From a scientific point of view, the use of general extrapolation factors for predicting aquatic toxicity is questionable.
4.3 NOEL / LOEL concept in risk analysis
Most existing concepts of risk analysis rely on the No Effect Level (NEL), which is the real concentration not causing any undesired effects in the aquatic environment. This is a hypothetical value, which can not be measured experimen- tally. Therefore, a NOEL is commonly used to estimate the NEL. In the last decade this concept of NOEL has been criti- cized [2,10,11,12,13] for the following reasons.
A NOEL is obtained as the highest experimentally measured concentration, where no significantly different effects were observed between the test group and the control group of the experiment. The significant difference is analyzed using one of the statistic hypothesis test procedures usually with a significance interval of 5 %. Laskowski showed that this sig- nificance level often does not correspond to the desired er- ror probability of underestimating the aquatic risk [13]. The error probability of obtaining a (wrong) concentration as result (i.e. as the NOEL), at which toxic effects still occur but simply have not been detected because of pure chance, usually is between 10 and 20% or even higher [13]. Chapman et al. [10] showed different examples of how the choice of data interpretation method (hypothesis test) can in- fluence the result of the study (i.e. the NOEL) using the same experimental data. Similarly, a different choice of concentra- tions used in toxicity experiments can lead to large differences in the resulting NOEL. The main reason for this problem of the NOEL concept is that only one single value of the whole experiment is used for obtaining the result instead of the whole dose-response curve. A small change in experimental data which, for instance, increases the error probability from 4.9 to 5.1% finally leads to a large change in the NOEL, because the next measured (lower) concentration has to be used. This can be the reason why the ranges for NOEL values are re- ported to be higher than for EC50 values [10].
Several alternatives were proposed instead of the NOEL con- cept using different kinds of effect concentrations (from EC50 down to EC0) [2,10,11]. Problems of hypothesis test selec- tion, dependence on experimental conditions can be avoided by fitting a statistical distribution to all experimental data using regression analysis. From this distribution model, the desired effect level can be calculated. The kind of statistical distribution and regression analysis has no significant influ- ence as long as it is used for interpolation between mea- sured values. However, if a concentration at low effect lev- els such as EC0 or EC5 shall be extrapolated, tlae result largely depends on the choice of the model.
The dependence on statistical models can lead to large un- certainties for both EC0 and NOEL values. The endpoint,
which has the lowest uncertainty ranges caused by statisti- cal or experimental reasons, is the EC50 (LC50) value. For substances with similar slopes of the dose-response curves, such endpoints should be used for comparing the aquatic toxicity of different substances. The principal problem of estimating a NEL, a concentration at which no effects oc- cur, can be improved but not completely solved by the alter- native concepts to the NOEL.
We understand the criticism of the NOEL concept as one which is largely based on mathematical/statistical reason- ing. Compared to the data ranges caused by the different sources of variability, these theoretical considerations have to be relativated, especially if a pragmatic approach to aquatic effect assessment is sought.
5 Conclusion
Assessing aquatic effects of chemical substances is a major task in environmental risk assessment. Although a number of guidelines exist, several problems can occur during this procedure, especially for non-experts in ecotoxicology. The first important step of successful effect assessment is to ques- tion all toxicological data critically before applying them. All background information required for this quality check must be made available in primary and also in secondary information media for toxicological data.
Ecotoxicological data always consist of a range of concen- trations depending on species, endpoint, time-scale and ex- perimental conditions. To get a comprehensive impression of the aquatic toxicity of a substance, the whole range must be considered and covered with data. This especially in- cludes data for different species of different trophic levels and acute as well as chronic data. From the legal point of view, safety factors provide a useful and pragmatic means to deal with these uncertainties as they usually (with some exceptions) lead to "safe" concentrations which protect the environment. For predicting toxicity data in order to com- pare the true aquatic toxicity of two substances, general safety factors should not be used. If the quality and the ranges of toxicity data are not considered adequately, the risk in the aquatic ecosystem can be under- or overestimated by several orders of magnitude.
Acknowledgments
i
The authors thank Martin Scheringer and Oemer Kut (ETH ZOrich), Hannes Wasmer and Beate Escher (EAWAG) for read- ing the manuscript.
6
[Z] [2]
[3]
References
Organization of Economic Cooperation and Development (OECD) (1993)" Guidelines for Testing Chemicals. Paris, France C F ~ v ~ , P.E; CRANE, M.; WJLES, J.; NOPPERT, E; MCINDOE, E. (1996): Improving the quality of statistics in regulatory ecotoxicity tests. Ecotoxicology 5, 169-186
~SCH, C.; LEO, A. 1995: Exploring QSAR. American Chemi- cal Society, Washington, DC, USA
State-of-the-Art
Risk Assessment: Aquatic Ecosystems
[11]
[4] Commission of the European Communities (1996): Techni- cal guidance documents in support of the Commission Direc- tive 93 / 67 / EEC on risk assessment for new substances and the Commission Regulation (EC) No 1488 / 94 on risk assess- ment for existing substances. Brussels, Belgium
[5] CHAVM~X, P.M.; FAIRBROTHER, A.; BROWN, D. (1998): A criti- cal evaluation of safety (uncertainty) factors for ecological risk assessment. Environ. Toxicol. Chem. 17, 99-108 [6] FA~rEBB, J.K.; HEDGBCOTr, S. (1996): Derivation of acceptable
concentrations for the protection of aquatic organisms. Environ. Toxicol. Pharmacol. 2, 115-120
[7] European Centre of Ecotoxicology and Toxicology of Chemi- cals (ECETOC). (1993): Aquatic Toxicity Data Evaluation. Technical Report 56. Brussels, Belgium
[8] FErn', K. (1998): Okotoxikologie. Georg Thieme Verlag, Stuttgart, Germany
[9] Abt. Associates (1995): Technical basis for recommended ranges of uncertainty factors used in deriving wildlife criteria for the Great Lakes water quality initiative. Final Report. Office of Water, U.S. Environmental Protection Agency, Wash- ington, DC, USA
[10] CH,WMAN, P.M.; CALDWELL, R.S.; CHAPMAN, P.F. (1996): A Warning: NOECs are inappropriate for regulatory use. Environ. Toxicol. Chem. 15, 77-79
HOSKSTV, A, J.A.; VAN EWIJK, P.H. (1993): The bounded effect concentration as an alternative to the NOEC. Sci. Total Environ. Supplement, 705-711
[12] Ho~cq-~, J.A.; VAN EwIJK, EH. (1993): Alternatives for the No- Observed-Effect-Level. Environ. Toxicol. Chem. 12, 187-194 [13] LASKOWSrd, R. (1995): Some good reasons to ban the use of
NOEC, LOEC and related concepts in ecotoxicology. Oikos 73, 140-144
[14] PO~R, M.; McCART~, L.S. (1997): Fallacies in ecological risk assessment practices. Environ. Sci. Technol. 31,370A-375A. [15] Criteria group for occupational standards (1992): Scientific
basis for Swedish Occupational. Standards XIII, Consensus report for diethanolamin. Arbeite och Halsa 47, 1-4 [16] HOFFMAN, D.J.; RATTNER, B.A.; BURTON, G.A.; CAIRNS, J.
(1995): Handbook of Ecotoxicology. Lewis Publishers, Lon- don, United Kingdom
[ 17] U.S. Environmental Protection Agency (1997): Water quality guidance for the great lake system. 40 CFR 132. Washington, DC, USA
[18] U.S. Environmental Protection Agency (1984): Estimating con- cern levels for concentrations of chemical substances in the environment. Environmental Effects Branch, Health Environ. Rev. Div. Washington, DC, USA
[19] SWARTO~r, J.C.; PracE, P.S.; DOLa~SON, M.L.; CAgLSoN-L~cH, H.L.; KEENAN, R.E. (1998): A probabilistic framework for the reference dose. Risk Analysis 18, 271-282
Received: August 26th, 1999 Accepted: October 26th, 1999
Online Publication: November 23rd, 1999
Commentary
Radiation Prot&tion Framework for Release of Scrap Materials Containing ResidualRadionuclides
S.Y. Chen
IntegratedRisk and ImpactAssessments for Complex Contaminated Sites
Margaret MacDonell and Loren Habegger
Managing Risk inthe UnitedStates Department otEnergy's Environmental ManagementProgram
Alvin L. Young and William Andrews
Criteria for ResidualContamination at U.S. Department of Energy Cleanup Sites
Margaret MacDonell, Debbie Elcock, John Peterson, and Gladys Klemic
EvaluatingEnvironmental Technology for MeetingRemediation End Points and Long-Term Stewardship Options
James L. Regens, R. Eric Zimmerman, Patrick L. Wilkey, Donald G. HodgesAnthony Q. Armstrong, and Linda Kelley
i Science and Technolog)Challenges for the Environmental Cleanup ofthe Cold War Legacy
I Curtis Travis, Alvin L. Young, and Miles C. Dionisio
A Risk-Based Approach to Setting an Environmental Management Science and Technology Agenda for the U.S. Department of l~ Nuclear WeaponsComplex
James L. Regens, Patrick L. Wilkey, R. Eric Zimmerman, Donald G. Hodges, Lawrence C. Mohr, and Glenn Fleming
Communicating Risks from the Environmental Management A Communication Tools Network: How the U.S. Department of Program of the United Stated Department of Energy Energy s Environmental Management Program Communicates Mark E. Bollinger, Robert Stenner, Kurt Picel, and with Stakeholders
Wilson McGinn Mary Jo Acke Ram cone and Nancy Lane
.... : Cultu~lRiskASsessment andQualityof Lifelssues : ' :: Cultural Impact Assessments and EnvironmentaRemediation
Decisionmaking
Elizabeth Kundinger Hocking, Catherine k. Bendowitz, and Matt Flynn
Using Eco-CulturalDependency Webs inRisk Assessment and Characterization
Stuart G. Harris and Barbara L. Harper