ORIGINAL INVESTIGATION
Rivastigmine effects on EEG spectra and three-dimensional
LORETA functional imaging in Alzheimer
’s disease
Lorena R. R. Gianotti&Gabriella Künig& Pascal L. Faber&Dietrich Lehmann& Roberto D. Pascual-Marqui&Kieko Kochi& Ursula Schreiter-Gasser
Received: 27 September 2007 / Accepted: 9 February 2008 / Published online: 30 April 2008
# Springer-Verlag 2008
Abstract
Objective The objective of the study is to investigate the electrocortical and the global cognitive effects of 3 months rivastigmine medication in a group of mild to moderate Alzheimer’s disease patients.
Materials and methods Multichannel EEG and cognitive performances measured with the Mini Mental State Exam-ination in a group of 16 patients with mild to moderate Alzheimer’s Disease were collected before and 3 months after the onset of rivastigmine medication.
Results Spectral analysis of the EEG data showed a significant power decrease in the delta and theta frequency bands during rivastigmine medication, i.e., a shift of the power spectrum towards‘normalization’. Three-dimensional low resolution electromagnetic tomography (LORETA) functional imaging localized rivastigmine effects in a network that includes left fronto-parietal regions, posterior cingulate cortex, bilateral parahippocampal regions, and the hippocampus. Moreover, a correlation analysis between differences in the cognitive performances during the two
recordings and LORETA-computed intracortical activity showed, in the alpha1 frequency band, better cognitive performance with increased cortical activity in the left insula. Conclusion The results point to a ‘normalization’ of the EEG power spectrum due to medication, and the intra-cortical localization of these effects showed an increase of cortical activity in frontal, parietal, and temporal regions that are well-known to be affected in Alzheimer’s disease. The topographic convergence of the present results with the memory network proposed by Vincent et al. (J. Neurophysiol. 96:3517–3531, 2006) leads to the speculation that in our group of patients, rivastigmine specifically activates brain regions that are involved in memory functions, notably a key symptom in this degenerative disease. Keywords Alzheimer’s disease . Rivastigmine . Cholinesterase inhibitors . EEG . Spectral analysis . Source localization . LORETA functional imaging
Introduction
Alzheimers’s disease (AD) is a degenerative process, characterized by the loss of cholinergic neurons in the basal forebrain nuclei (Whitehouse et al. 1981). This degeneration of cortical projection of cholinergic neurons results in a deficiency of acetylcholine in the neocortex and hippocampus (Geula 1998), and the deficit is, to some extent, responsible for the underlying cognitive and neuropsychiatric dysfunction.
Based on the cholinergic hypothesis, cholinesterase inhibitors (ChE-I) currently is the most frequently recom-mended symptomatic treatment (Doody et al. 2001). Clinical studies have confirmed the efficacy of ChE-I treatment in AD on cognitive and neuropsychiatric symptoms
L. R. R. Gianotti (*)
:
P. L. Faber:
D. Lehmann:
R. D. Pascual-Marqui:
K. KochiThe KEY Institute for Brain-Mind Research,
University Hospital of Psychiatry, University of Zurich, Lenggstrasse 31,
CH-8032 Zurich, Switzerland e-mail: [email protected] G. Künig
Department of Psychiatry, Division of Geriatric Psychiatry, University of Zurich,
CH-8032 Zurich, Switzerland U. Schreiter-Gasser
Praxis für Psychiatrie Rehalp, CH-8008 Zurich, Switzerland
(see Bullock and Dengiz2005, for a review) and a series of recent positron emission tomography (PET) and single photon emission computed tomography (SPECT) studies reported an increase of cortical activity due to ChE-I therapy at temporo-parietal and frontal regions (e.g., Bohnen et al. 2005; Ceravolo et al. 2004; Mega et al. 2001), in the hippocampus (Mega et al. 2001), and in the posterior cingulum (Bohnen et al. 2005; Ceravolo et al. 2004), i.e., in regions that have been shown to be the most affected cortical areas in AD (e.g., Jagust et al.1997).
Because electroencephalography (EEG), as a noninvasive method, can be applied repeatedly, it is a suitable tool to assess the course of the cortical activity during psychoactive medication. The spontaneous EEG, i.e., the recording of the brain electrical activity during resting, is a standard procedure. It is well established that patients with clinically diagnosed AD show a slowing of their EEG frequency during resting compared with healthy age-matched subjects: AD patients have increased power in slow frequency EEG activity (delta and theta frequency bands) and decreased power in fast frequency EEG activity (alpha and beta frequency bands; e.g., Gianotti et al.2007; Schreiter-Gasser et al.1993). Moreover, EEG has also been shown to reflect the progressive cortical dysfunctioning correlated with the cognitive impairment in AD patients (e.g., Gianotti et al.2007; Schreiter-Gasser et al.
1994).
Relationships between cholinergic system and EEG power spectrum, especially in slow EEG frequencies, have been recognized in a variety of animal (e.g., Crouzier et al. 2006; Keita et al.2000) and human studies (e.g., Riekkinen et al.1991; Hartikainen et al.1992). Treatment with ChE-I has been shown to decrease the amount of slow EEG activity, i.e., to‘normalize’ the EEG power spectrum (e.g., Adler and Brassen 2001; Balkan et al. 2003; Jelic et al. 1998; Kogan et al.2001).
Unfortunately, single or multichannel EEG has the limitation that the signals that are measured on the head surface do not directly indicate the location of the active neuronal generators in the brain. To solve this so-called ‘inverse problem’, the three-dimensional source localization method, low resolution electromagnetic tomography (LORETA, Pascual-Marqui et al.1994,1999), was used.
Using this method, Babiloni and colleagues showed correlations in the EEG delta and alpha frequency bands between the strength of the intracerebral sources and the severity of global cognitive decline (Babiloni et al.2006a), and the severity of focused attention decline (Babiloni et al. 2007). Of particular interest for the present investigation is the only previous LORETA ChE-I treatment study done by Babiloni et al. (2006b): Globally, they did not show any significant shift towards normalization in the cortical activity after 1 year of donepezil treatment, but dividing
their AD subjects into two groups based on their cognitive performance differences (‘responders’ vs. ‘nonresponders’), the authors found that‘responders’ showed a lesser reduction of occipital and temporal alpha1 activity compared to nonresponders, thus pointing to a correlation between the difference of cognitive performances and the difference of alpha1 cortical activity after 1 year of donepezil treatment.
All these LORETA studies used a macroregion rather than a voxel-wise approach, thus reducing the number of statistical tests but forgoing a higher spatial resolution.
Using a voxel-wise approach, a previous LORETA functional imaging study on a group of non-medicated mild to moderate AD patients specified that increases in slow frequency EEG activity (delta and theta frequency bands) and decreases in fast frequency EEG activity (alpha2, beta1, beta2, and beta3 frequency bands) affected different cortical areas while largely sparing prefrontal cortex (Gianotti et al. 2007); the study also showed that decreased delta activity at left parietal areas and increased alpha1 activity at left temporal areas correlated with better cognitive performance measured with the Mini Mental State Examination (MMSE, Folstein et al.1975).
In the present study, multichannel EEG was recorded in a group of 16 AD patients at baseline and after 3 months of rivastigmine treatment to monitor the electrocortical effects of ChE-I using LORETA functional imaging. A group of 16 matched controls was also recorded to confirm the typical reported aberrations of AD resting EEG (see above). Based on the studies reviewed above, we hypothesized that our patients under rivastigmine will show a ‘normal-ization’ of their power spectrum on the scalp, particularly a decrease of slow frequency activity and an increase of cortical activity at temporo-parietal, frontal, cingulate, and hippocampal regions. Furthermore, we hypothesized that the expected cognitive amelioration under rivastigmine will positively correlate with an increase of cortical activity localized in left-lateralized temporo-parietal areas as pre-dicted by our earlier LORETA study reviewed above.
Materials and methods Subjects
Sixteen patients with clinically diagnosed AD (mean age: 77.4 years, S.D.: 6.2; eight men and eight women; handedness: 5 right, 11 unknown) admitted to the Depart-ment of Geriatric Psychiatry at the University Hospital of Zurich, Switzerland, took part in the study. All patients met the diagnosis of probable or possible AD according to the NINCDS-ADRDA (McKahnn et al.1984) criteria and the ICD-10 Classification of Mental and Behavioral Disorders
(WHO 1993). Patients with possible vascular dementia, mixed AD-vascular dementia, and major depression were ruled out by neuropsychological testing, laboratory inves-tigations, and brain structural imaging (computed tomogra-phy or magnetic resonance tomogratomogra-phy). All patients were enrolled for the participation in an open-label treatment study with rivastigmine. The first, baseline EEG was recorded before rivastigmine therapy (session t0). The
second, follow-up EEG recording was done 3 months after treatment initiation (session t1). In all patients, other
centrally active medication was terminated 1 week before the EEG recordings. MMSE was administered at the beginning of both recording sessions to assess the severity of the disease and to monitor cognitive changes due to the medication. A group of 16 age- and gender-matched healthy volunteers was used as controls (mean age=74.0 years, S.D=8.5). Cognitive impairment was excluded by clinical interviews and neuropsychological testing. The study was approved by the Ethics Committee of the University Hospital Zurich. Written informed consent was obtained from all subjects.
EEG recordings
Vigilance-controlled multichannel EEG was recorded using a Nihon-Kohden“NeuroFile” system (electrode impedance <5 kOhm, 1–120 Hz bandpass, 256 samples/s). Nineteen electrodes covering the entire scalp were placed according to the International 10-20 System (Nuwer et al.1998) at the following locations: Fp1/2, F7/8, F3/4, FZ, T3/4, C3/4, CZ, T5/6, P3/4, Pz, O1/2. The average of F3 and F4 was used as recording reference. Electrodes at the left outer canthus and above and below the left eye were used to monitor vertical and horizontal eye movements. Subjects were seated in a sound- and electrically shielded chamber with dim illumi-nation. They were instructed that the experiment involved EEG recording during resting with open or closed eyes. The instructions about eye opening/closing were given via intercom. The following protocol was used for every subject: (1) 20 s eyes open, 20 s eyes closed; (2) 20 s eyes open, 80 s eyes closed; (3) 20 s eyes open, 80 s eyes closed; (4) 20 s eyes open, 20 s eyes closed. Only data from the total of 200 s eyes closed conditions were analyzed.
For each subject, the EEG recordings were carefully inspected off-line on a PC display for artifacts caused by eye and head movements, muscle activity, sweating, and technical problems. Using a moving, nonoverlapping win-dow, all artifact-free 2-s epochs were selected for further analyses. On the average across patients and sessions, there were 20.3 (SD=1.5) 2-s epochs available, and across controls there were 19.7 (SD=2.0), with no significant difference between the two sessions and between groups.
EEG data analysis Spectral analysis
The EEG data were recomputed against the average reference (Lehmann and Skrandies 1980). Fast Fourier Transformation (FFT using a square window) was applied to each epoch and channel to compute the spectral power density with 0.5-Hz frequency resolution. For each subject and for each session, the spectra for each channel were averaged over all epochs.
For descriptive statistics, mean power values over subjects were computed for each session.
Absolute spectral power values for each subject, session, and channel were integrated for the following seven independent frequency bands (Kubicki et al. 1979): delta (1.5–6 Hz), theta (6.5–8 Hz), alpha1 (8.5–10 Hz), alpha2 (10.5–12 Hz), beta1 (12.5–18 Hz), beta2 (18.5–21 Hz), and beta3 (21.5–30 Hz). Before statistical analysis, log trans-formation was applied to normalize the distribution of absolute power values (Gasser et al.1982).
A two-way analysis of variance (ANOVA) with groups (2 levels: AD patients and controls at time t0) as
between-subject factor and electrode location (19 levels: Fp1/2, F7/8, F3/4, FZ, T3/4, C3/4, CZ, T5/6, P3/4, Pz, O1/2) as within-subject factor was carried out for each frequency band separately.
Subsequently, only for the AD group, a two-way ANOVA with session (two levels: t0 and t1) and electrode
location (19 levels: Fp1/2, F7/8, F3/4, FZ, T3/4, C3/4, CZ, T5/6, P3/4, Pz, O1/2) as within-subject factors was carried out for each frequency band separately. Paired t tests were used as post hoc tests. Throughout, two-tailed p values are reported.
The MMSE data were normally distributed according to the Shapiro–Wilk test. Correlations between differences in power density in the seven frequency bands (session t1−
session t0) and differences in the clinical severity measured
with the MMSE (session t1−session t0) were computed
using Pearsons’ product-moment correlations.
LORETA functional images of electric neuronal activity From scalp-recorded electric potentials, LORETA (Pascual-Marqui et al. 1994,1999) estimates the distribu-tion of electric source activity by assuming similar activation among neighboring neuronal ensembles, an assumption implemented by computing the ‘‘smoothest’’ of all possible activity distributions.
This three-dimensional source localization technique has recently received important cross-modal validation from studies combining LORETA with functional magnetic
resonance imaging (MRI; Mulert et al.2004), structural MRI (Worrell et al. 2000), and PET (Oakes et al. 2004). Especially concerning AD, it has been shown that the spatial pattern of glucose metabolism correlates with the localiza-tion of intracerebral EEG generators (Dierks et al.2000).
The version of LORETA that was implemented in the present study uses a three-shell spherical head model that includes scalp, skull, and brain compartments. EEG electrode coordinates were derived from cross-registrations between spherical and realistic head geometry (Towle et al.1993). Both the head model and the electrode coordinates were coregis-tered to the Talairach brain atlas (Talairach and Tournoux 1988), digitized at the Brain Imaging Center of the Montreal Neurological Institute (MNI305; Collins et al. 1994). The source space (2,394 voxels at a voxel size of 7×7×7 mm) was restricted to cortical gray matter and hippocampi as defined by the digitized MNI probability atlas. The LORETA functional images represent the electrical activity at each voxel as squared magnitude (i.e., power) of computed current density (unit: amperes per square meter, A/m2).
The recorded scalp electric potentials were used for computing the LORETA functional images. These func-tional images were computed for each subject separately, for the seven classical frequency bands (for technical details, see Frei et al.2001).
The localization of the differences in activity between the two sessions in the seven frequency bands was assessed with voxel-by-voxel paired t tests of the log-transformed com-puted current density power. In addition, global, widespread differences (cluster analysis) were assessed by applying the exceedance proportion test (Friston et al. 1990). In all cases, the nonparametric randomization approach (Nichols and Holmes 2002) was used for estimating empirical probability distributions and the corresponding corrected (for multiple comparisons) critical probability thresholds.
Furthermore, for each of the seven frequency bands, Pearsons’ product-moment correlations between differences in current density (session t1−session t0) and differences in
the clinical severity measured with the MMSE (session t1−session t0) were computed.
Results
Cognitive impairment
The cognitive impairment was assessed with the MMSE where scores range from 0 to 30, the optimum. All controls had an MMSE score of 30. The MMSE scores of the AD patients at t0(i.e., without rivastigmine medication) ranged
between 10 and 27 (mean=19.1; SD=5.7), and was significantly lower compared to those of the controls (p< 0.001). At t1, the MMSE scores ranged between 10 and 29
(mean=19.2; SD=5.8): seven patients showed an improve-ment of their MMSE scores (mean score difference=+3.1 points; SD=2.41), and eight patients showed a worsening in their MMSE scores (mean score difference=−2.6 points; SD=2.07). One patient showed no difference between the two sessions. Across all patients, there was no difference of the MMSE scores between the two sessions. Table1shows the patient characteristics and MMSE scores at baseline and at the 3-months follow-up.
Spectral analysis
The comparison of the band power between the two groups at session t0, established the expected slowing of EEG
frequencies in the AD patients: delta and theta increased significantly (F(1,30) = 6.73, p = 0.015; F(1,30) = 9.32, p=0.005), and beta3 decreased significantly (F(1,30)=5.53, p=0.026) in AD patients compared to controls. Having confirmed the abnormal power spectrum of the AD patients, we focused on the rivastigmine effects in AD disease.
For AD patients, Fig. 1 exhibits the log-transformed mean power spectra across the 19 channels for sessions t0
and t1 (panel a), the mean values and 95% confidence
interval for the difference between sessions (panel b), and their corresponding p values at each frequency bin (panel c). The power spectrum of the AD patients in session t1
evidently shows lower values in the delta and theta frequency range. In the faster frequency range, the two distributions overlap, denoting similar values between the two sessions.
Comparing absolute band power between the two sessions, there was a significant decrease in delta (F(1,15)= 6.94, p=0.019) and in theta (F(1,15)=7.27, p=0.017) in session t1 compared to t0. No significant changes were
observed for the other frequency bands. There were no significant interactions between session X electrode location for delta or theta power. Figure 2 illustrates the significant differences of the follow-up t tests for the 19 channels: significant lower values in t1were observed for delta at ten
channels and for theta at eight channels.
The computation of correlations between differences in frequency band power and differences in the MMSE scores between sessions t0and t1did not yield significant results.
The smallest p value was reached in the delta frequency band (r=−0.40, p=0.13).
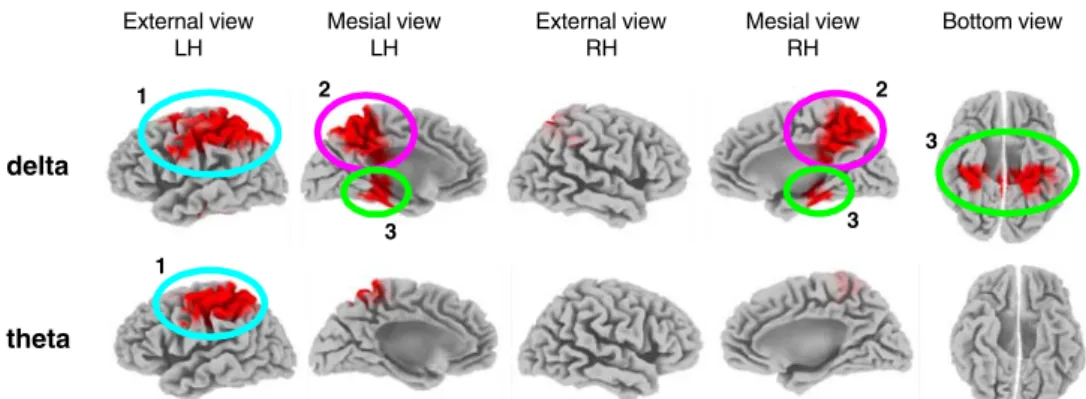
LORETA functional images of electric neuronal activity The LORETA image statistics showed significant differ-ences in cortical activity between the two sessions in two of the seven frequency bands, the two slow frequency bands of delta and theta. Figure3illustrates the brain areas where the AD patients had significantly weaker activity in session t1compared to session t0in these bands.
In the delta band, the cluster analysis resulted in the identification of three large clusters that reached p=0.016 (corrected). The largest cluster was localized at left-lateralized fronto-parietal regions. Voxel-by-voxel analysis in this cluster yielded p<0.05 (corrected) in Brodmann
Area (BA) 7 and BA 40 (superior parietal and inferior parietal, respectively). The second significant cluster grouped voxels at central parietal and cingulate regions, where the voxel-by-voxel analysis yielded p<0.05 (corrected) in BA 7 (precuneus). The third cluster included para-hippocampal regions and the hippocampus bilaterally, where the voxel-by-voxel analysis yielded p<0.05 (corrected) in hippocampus and BA 36 (parahippocampal region).
In the theta band, a unique large cluster (p=0.021, corrected) at left-lateralized fronto-parietal regions was identified. Voxel-by-voxel analysis in this cluster yielded p<0.03 (corrected) in BAs 4, 7 and 40 (precentral, superior and inferior parietal lobule, respectively).
Table2gives a complete listing of all BAs that contained significantly different LORETA voxels.
Figure4displays the LORETA results in the alpha1 band that showed significant correlations between voxel current density and MMSE scores. The alpha1 band showed positive correlations in the left insula with a maximum in BA 13 (r=0.57, p=0.02), indicating better cognitive performance with increased alpha1 band power in this area.
Discussion
Four main findings have emerged from the present study. The first finding is that before rivastigmine treatment, the
5 10 15 20 25 30 Hz -3 -2 -1 0 1 2 -1 0 1 .00 .05 .10 Session t0 Session t1 log-t ra n s form e d a b s o lute powe r mean
a
5 10 15 2 5 -3 -2 -1 0 1 2 5 10 15 20 5 -3 -2 -1 0 1 2 -1 0 1 .00 .05 .10 .00 .05 .10 Session t0 Session t1 Session t0 Session t1 p -v alu e mean diffe re n c eb
c
Fig. 1 Power spectra before and 3 months after rivastigmine therapy. a The log-transformed mean absolute power spectra across the 19 channels of the two sessions; b mean values (black line) and 95% confidence interval (grey area) for the dif-ference between sessions, and c their corresponding p values at each frequency bin
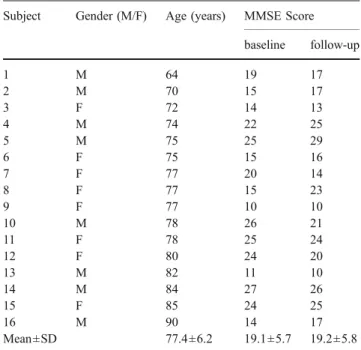
Table 1 Patient characteristics and MMSE scores at baseline and 3 months after the onset of rivastigmine medication
Subject Gender (M/F) Age (years) MMSE Score baseline follow-up 1 M 64 19 17 2 M 70 15 17 3 F 72 14 13 4 M 74 22 25 5 M 75 25 29 6 F 75 15 16 7 F 77 20 14 8 F 77 15 23 9 F 77 10 10 10 M 78 26 21 11 F 78 25 24 12 F 80 24 20 13 M 82 11 10 14 M 84 27 26 15 F 85 24 25 16 M 90 14 17 Mean±SD 77.4±6.2 19.1±5.7 19.2±5.8
16 mild to moderate AD patients compared with their matched controls showed the expected slowing of their EEG frequency, i.e., increased power in slow frequency EEG activity (delta and theta frequency bands) and decreased power in fast frequency EEG activity (beta3 frequency band), in keeping with previous quantitative EEG results (e.g., Gianotti et al.2007; Schreiter-Gasser et al. 1993), and thus validating the AD diagnosis of our patients from the electrophysiological perspective.
The other three findings concern the effects of 3 months of rivastigmine treatment in the AD patients, monitored with the MMSE that assessed global cognitive perfor-mance, and with the spontaneous EEG.
The global cognitive performance of the AD patients showed no significant differences between the two sessions, thus confirming the stabilizing effect of 3 months of rivastigmine on cognitive performances (e.g., Almkvist et al. 2004). In fact, the typical annual decline in untreated patients has been reported to be two to four points on the MMSE (Bullock and Dengiz2005). Specifically, 8 of our 16 AD patients cognitively benefited from the treatment, in
line with previous observations that a positive response to the medication occurs on average in 30–70% of treated patients (e.g., Farlow et al.2000; Feldman and Lane2007). Confirming our first hypothesis on spontaneous EEG, spectral analysis of the EEG data showed a significant power decrease in the delta and theta frequency bands during rivastigmine in our AD patients. These results agree with previous quantitative EEG studies that showed a shift of the power spectral EEG towards ‘normalization’. In particular, after short-term (5 days to 2 weeks) rivastigmine treatment, three previous studies showed a decrease of delta (Adler and Brassen2001) and of theta (Adler and Brassen2001; Adler et al.2004; Brassen and Adler2003). To our knowledge, the present paper is the first long-term (3 months) study that used rivastigmine and that reports a stabilization of these electrophysiological effects. Long-term studies conducted with other ChE-I (donepezil: Balkan et al.2003; Kogan et al. 2001; tacrine: Jelic et al.1998) also reported a ‘normaliza-tion’ of slow EEG frequency in AD patients.
Confirming our second hypothesis, LORETA localized long-term rivastigmine effects in a network that includes
1
External view LH
Mesial view Mesial view LH External view RH RH Bottom view delta theta 1 2 2 3 3 3
Fig. 3 LORETA-based statistical nonparametric maps (SnPM) illus-trating the differences at p<0.05 (corrected for multiple testing) of LORETA current density between the two sessions t0and t1in delta
(upper part) and theta (lower part). Results are displayed on the ‘fiducial cortical surface’ (boundary midway through cortical thick-ness, Dickson et al.2001). LH Left hemisphere, RH right hemisphere,
A anterior, P posterior, R right, L left. Cortex shown in gray scale; decreased activity in session t1compared to t0in red. Cluster no. 1:
left fronto-parietal regions (light blue); cluster no. 2: central parietal and cingulate regions (pink), cluster no. 3: parahippocampal regions and the hippocampus (light green)
Delta
Theta
-4 +4 t-value < p< 0.05 < p< 0.05Delta
Theta
-4 +4 t-value < p< 0.05 < p< 0.05 -4 +4 0 t-value < p< 0.05 < p< 0.05Fig. 2 T-maps illustrating the differences of EEG frequency band power between the two sessions t0and t1in delta and theta. Head seen
from above, left ear left, nose up; the 19 electrode positions are
indicated by open symbols. t values are color-coded in steps of t=1 (see calibration scale). Decreased EEG power in session t1compared
three spatial clusters in frontal, parietal, and temporal regions. Specifically, during medication, left fronto-parietal regions showed a significant decrease of delta and theta frequency activity. Moreover, delta activity significantly decreased in the posterior cingulate cortex, and bilateral in parahippocampal regions and in hippocampus. We note that a decrease of delta and theta activity corresponds to an increase of cortical activation in the concerned regions (Buchan et al.1997).
AD patients compared to healthy controls consistently showed decreased activity in medial temporal lobe structures such as parahippocampal regions and in the hippocampus as shown in fMRI studies (e.g., Celone et al.2006; Machulda et al. 2003; Small et al. 1999) and in SPECT and PET studies (e.g., Bradley et al. 2002; see Matsuda2001, for a review). Medial temporal lobe structures and the hippo-campus are among the first regions targeted by AD pathology (Braak and Braak 1991) and are key regions for memory functions, especially episodic memory, whose impairment is the hallmark of early AD (Hyman et al. 1984). Reduced metabolism in the posterior cingulate cortex and precuneus are also a common finding in early AD (Bradley et al.2002; Matsuda 2001; Minoshima et al.
1997).
The present results demonstrate an increase of cortical activity due to rivastigmine medication in regions that are well known to be affected in AD already at an early stage of the disease. In line with our EEG-based results, a series of PET and SPECT studies demonstrated hypermetabolism or hyperperfusion after ChE-I medication in AD patients in fronto-parietal regions (Bohnen et al. 2005; Ceravolo et al. 2004; Mega et al.2001; Stefanova et al.2006), in posterior cingulate (Bohnen et al.2005; Ceravolo et al.2004), and in parahippocampal or hippocampal regions (Mega et al.2001). The cortical regions that were affected by rivastigmine medication in the present study overlap with the recently proposed hippocampal-parietal memory network (Vincent et al.2006). Vincent et al. (2006) were concerned with the hypothesis that parietal cortex contains areas associated with the medial temporal lobe memory system. In their fMRI study, they examined correlations in spontaneous BOLD fluctuations in different brain areas. This novel approach focused on the surprising observation that spontaneous activity at resting state (i.e., in the absence of overt task performance) consistently and repeatedly exhibits a coactivation in a distributed network of cortical regions, the so-called default-mode networks (e.g., Gusnard and Raichle2001; Raichle et al.2001).
The topographic convergence of our results with the memory network proposed by Vincent et al. (2006) leads to the speculation that rivastigmine in our AD patients specifically activates brain regions that are involved in
Table 2 Voxels of interest of the LORETA-based statistical nonpara-metric maps for assessing differences of activation between sessions t0
and t1in AD patients in 2 EEG frequency bands
BA# LH LH 1 - - 1 -2 - 1 -3 - 5 -4 - 6 -5 3 3 -6 21 - 5 -7 65 23 22 -8 - - -9 - - -10 - - -11 - - -12 - - -13 - - -14 - - -15 - - -16 - - -17 - - -18 - - -19 3 - - -20 2 3 - -21 - - -22 - - -23 1 1 - -24 - - -25 - - -26 - - -27 1 1 - -28 - - -29 1 1 - -30 3 - -31 11 10 - -32 - - -33 - - -34 - - -35 4 3 - -36 9 9 - -37 4 2 - -38 - - -39 1 - - -40 42 - 32 -41 - - -42 - - -43 - - -44 - - -45 - - -46 - - -47 - - -hipp. 6 5 - -TOTAL 196 61 75 0 theta delta BA# L RH L RH 1 - - 1 -2 - 1 -3 - 5 -4 - 6 -5 3 3 -6 - 5 -7 23 22 -8 - - -9 - - -10 - - -11 - - -12 - - -13 - - -14 - - -15 - - -16 - - -17 - - -18 - - -19 3 - - -20 2 3 - -21 - - -22 - - -23 1 1 - -24 - - -25 - - -26 - - -27 1 1 - -28 - - -29 1 1 - -30 3 - -31 11 10 - -32 - - -33 - - -34 - - -35 4 3 - -36 9 9 - -37 4 2 - -38 - - -39 1 - - -40 42 - 32 -41 - - -42 - - -43 - - -44 - - -45 - - -46 - - -47 - - -hipp. 6 5 - -TOTAL 196 61 75 0 theta delta 7 8 4 3
The number of voxels sorted by Brodmann areas (BA number, first column) are listed separately for the left (LH) and for the right hemisphere (RH). Colors mark the different clusters, and refer to Fig.3.
memory functions, notably a key symptom in this degen-erative disease.
To our knowledge, this is the second EEG LORETA-based study focusing on ChE-I effects in AD. The other study (Babiloni et al.2006b) did not show any shift towards normalization in the cortical activity after 1 year of donepezil. Contrary, they reported a significant increase in the slow delta and theta frequencies and a significant decrease in the alpha band after treatment. These observa-tions actually indicate a progressive cortical degeneration during the study year despite of the treatment. The reason of the discrepant results between the two EEG LORETA studies is probably in part to refer to the different durations of the studies: AD is a progressive disease and even if ChE-I treatment has been reported to be useful in psychological and in physiological measurements, it is to be assumed that the degeneration of cortical projection of cholinergic neurons will progress, and therefore, after a certain time, the initial benefits of the treatment will vanish. Neverthe-less, Babiloni et al. (2006b) reported a less dramatic decrease of activity in the alpha1 band in occipital and temporal regions in the group of AD patients that were recognized as ‘responders’ (based on the MMSE scores) compared to the‘nonresponders’. This result is particularly interesting and very in line with the correlation results reported in the present study. Our data showed a significant correlation in the alpha1 band between the differences in the cognitive functions measured with MMSE during the two sessions and LORETA-computed intracortical activity in the left insula, indicating better cognitive performance with increased alpha1 current density.
A previous study by our group found that in a group of non-medicated mild to moderate AD, increased alpha1 activity in left temporal cortical areas was associated with better cognitive performances (Gianotti et al. 2007). It is worthy to note that, the insula is strongly reciprocally interconnected with temporal regions (Shelley and Trimble 2004). A volumetric MRI study showed that mild to moderate AD patients have significantly more atrophy of the insula (together with the hippocampus and the parietal
cortex) than healthy age-matched controls (Foundas et al. 1997). PET studies in healthy subjects have found that the activation of the insula was associated with verbal memory tasks (Grasby et al.1994; Paulesu et al.1993). Of particular interest for the present results, verbal memory impairment was shown after left but not right insular cortex infarction (Manes et al.1999). It appears that the left insula is part of a functional neuroanatomical circuit that is involved in verbal (semantic) memory and that is impaired in AD. Based on the present results, we speculated that AD patients that cognitively benefited from medication— possibly via a reduction of verbal memory impairment— showed an increase of alpha1 EEG activity in the left insula. In light of the present EEG results, the lack of a statistical significant global cognitive amelioration measured with the MMSE, might appear surprising at first sight. There are some indications that treatment with ChE-I not only stabilizes cognitive function in a global sense, but also has positive effects on specific cognitive functions such as attention rather than episodic memory (tacrine medication, Almkvist et al. 2001). As said above, we speculated based on the present neuroimaging results that rivastigmine possibly reduces the verbal memory impairment of mild to moderate AD patients. Future studies that combine neurophysiological measurements with cognitive/neuropsychiatric measure-ments should use a more detailed cognitive assessment. The latter should unfold the MMSE single measure into contributing subfactors so that the specific cognitive effects of treatment become available. Such widened cognitive assessment would offer an array of testable correlations between the spectrum of cognitive measurements and the spectrum of neurophysiological measurements, thereby possibly enhancing the agreement between measurements.
Acknowledgements The authors thank Mr. M. Manske and Mr. P. Lirgg for technical collaboration. The authors declare that this work was in part supported by NOVARTIS foundation (Grant no. CENA713IN01). PLF declares that in 2005 has received a 5% time compensation from NOVARTIS foundation, the manufacturer of rivastigmine, besides the 60% time income received from his primary employer. L R L R A P Alpha 1 L R L R A P Alpha 1
Fig. 4 Axial, sagittal, and vertical slices centered at the voxel of strongest correlation (X=−38, Y=−11, Z=1 in Talair-ach coordinates) showing in red results of voxelwise Pearsons’ product-moment correlation (p< 0.05) between difference in cur-rent density (session t1−t0) in
the alpha 1 band and difference in MMSE scores (session t1−t0)
References
Adler G, Brassen S (2001) Short-term rivastigmine treatment reduces EEG Slow-wave power in Alzheimer patients. Neuropsychobi-ology 43:273–276
Adler G, Brassen S, Chwalek K, Dieter B, Teufel M (2004) Prediction of treatment response to rivastigmine in Alzheimer’s dementia. J Neurol Neurosur Ps 75:292–294
Almkvist O, Darreh-Shori T, Stefanova E, Spiegel R, Nordberg A (2004) Preserved cognitive function after 12 months of treatment with rivastigmine in mild Alzheimer’s disease in comparison with untreated AD and MCI patients. Eur J Neurol 11:253–261 Almkvist O, Jelic V, Amberla K, Hellström-Lindahl E, Meurling L,
Nordberg A (2001) Responder characteristics to a single oral dose of cholinesterase inhibitor: a double-blind placebo-con-trolled study with tacrine in Alzheimer patients. Dement Geriatr Cogn Disord 12:22–32
Babiloni C, Binetti G, Cassetta E, Dal Forno G, Del Percio C, Ferreri F, Ferri R, Frisoni G, Hirata K, Lanuzza B, Miniussi C, Moretti DV, Nobili F, Rodriguez G, Romani GL, Salinari S, Rossini PM (2006a) Sources of cortical rhythms change as a function of cognitive impairment in pathological aging a multicenter study. Clin Neurophysiol 117:252–268
Babiloni C, Cassetta E, Dal Forno G, Del Percio C, Ferreri F, Ferri R, Lanuzza B, Miniussi C, Moretti DV, Nobili F, Pascual-Marqui RD, Rodriguez G, Romani GL, Salinari S, Zanetti O, Rossini PM (2006b) Donepezil effects on sources of cortical rhythms in mild Alzheimer’s disease: responders vs. nonresponders. Neuroimage 31:1650–1665
Babiloni C, Cassetta E, Binetti G, Tombini M, Del Percio C, Ferreri F, Ferri R, Frisoni G, Lanuzza B, Nobili F, Parisi L, Rodriguez G, Frigerio L, Gurzi M, Presia A, Vernieri F, Eusebi F, Rossini PM (2007) Resting EEG sources correlate with attentional span in mild cognitive impairment and Alzheimer’s disease. Eur J Neurosci 25:3742–3757
Balkan S, Yaraş N, Mihçi E, Dora B, Ağar A, Yargiçoğlu P (2003) Effect of denepezil on EEG spectral analysis in Alzheimer’s disease. Acta Neurol Belg 103:164–169
Bohnen NI, Kaufer DI, Hendrickson R, Ivanco LS, Lopresti BJ, Koeppe RA, Meltzer CC, Constantine G, Davis JG, Mathis CA, DeKosky ST, Moore RY (2005) Degree of inhibition of cortical acetylcho-linesterase activity and cognitive effects by donepezil treatment in Alzheimer’s disease. J Neurol Neurosur Ps 76:315–319
Braak H, Braak E (1991) Neuropathological stageing of Alzheimer-related changes. Acta Neuropathol 82:239–259
Bradley KM, O’Sullivan VT, Soper NDW, Nagy Z, King EM-F, Smith AD, Shepstone BJ (2002) Cerebral perfusion SPECT correlated with Braak pathological stage in Alzheimer’s disease. Brain 125:1772–1781
Brassen S, Adler G (2003) Short-term effects of acetylcholinesterase inhibitor treatment on EEG and memory performance in Alzheimer patients: an open, controlled trial. Pharmacopsychiatry 36:304–308
Buchan RJ, Nagata K, Yokoyama E, Langman P, Yuya H, Hirata Y, Hatazawa J, Kanno I (1997) Regional correlations between the EEG and oxygen metabolism in dementia of Alzheimer’s type. Electroenceph Clin Neurophysiol 103:409–417
Bullock R, Dengiz A (2005) Cognitive performance in patients with Alzheimer’s disease receiving cholinesterase inhibitors for up to 5 years. Int J Clin Pract 59:817–822
Celone KA, Calhoun VD, Dickerson BC, Atri A, Chua EF, Miller SL, DePeau K, Rentz DM, Selkoe DJ, Blacker D, Albert MS, Sperling RA (2006) Alterations in memory networks in mild cognitive impairment and Alzheimer’ disease: An independent component analysis. J Neurosci 26:10222–10231
Ceravolo R, Volterrani D, Tognoni G, Dell’gnello G, Manca G, Kiferle L, Rossi Logi C, Strauss HW, Mariani G, Murri L (2004) Cerebral perfusional effects of cholinesterase inhibitors in Alzheimer disease. Clin Neuropharmacol 27:166–170
Collins DL, Neelin P, Peters TM, Evans AC (1994) Automatic 3D intersubject registration of MR volumetric data in standardized Talairach space. J Comput Assist Tomogr 18:192–205
Crouzier D, Baubichon D, Bourbon F, Testylier G (2006) Acetylcho-line release, EEG spectral analysis, sleep staging and body temperature studies: a multiparametric approach on freely moving rats. J Neurosci Methods 151:159–167
Dickson J, Drury H, Van Essen DC (2001)‘The surface management system’ (SuMS) database: A surface-based database to aid cortical surface reconstruction, visualization and analysis. Philos T Roy Soc B 356:1277–1292
Dierks T, Vesna J, Pascual-Marqui RD, Wahlund LO, Julin P, Linden DEJ, Maurer K, Winblad B, Nordberg A (2000) Spatial pattern of cerebral glucose metabolism (PET) correlates with localization of intracerebral EEG-generators in Alzheimer’s disease. Clin Neuro-physiol 111:1817–1824
Doody RS, Stevens JC, Beck C, Dubinsky RM, Kaye JA, Gwyther L, Mohs RC, Thal LJ, Whitehouse PJ, DeKosky ST, Cummings JL (2001) Practice parameter: management of dementia (an evi-dence-based review). Report of the quality standards subcom-mittee of the American Academy of Neurology. Neurology 56:1154–1166
Farlow M, Anand R, Messin J Jr, Hartman R, Veach J (2000) A 52-week study of the efficacy of rivastigmine in patients with mild to moderately severe Alzheimer’ disease. Eur Neurol 44:236–241 Feldman HH, Lane R (2007) Rivastigmine: a placebo controlled trial of twice daily and three times daily regimens in patients with Alzheimer’s disease. J Neurol Neurosurg Psychiatry 78:1056– 1063
Folstein MF, Folstein SE, McHugh PR (1975)‘Mini’-mental state. A practical method for grading the cognitive state of patients’ for the clinician. J Psychiat Res 12:189–198
Foundas AL, Leonard CM, Mahoney SM, Agee OF, Heilman KM (1997) Atrophy of the hippocampus, parietal cortex, and insula in Alzheimer’s disease: a volumetric magnetic resonance imaging study. Neuropsychiatry Neuropsychol Behav Neurol 10:81–89 Frei E, Gamma A, Pascual-Marqui R, Lehmann D, Hell D,
Vollenweider FX (2001) Localization of MDMA-induced brain activity in healthy volunteers using low resolution brain electromagnetic tomography (LORETA). Hum Brain Mapp 4:152–165
Friston KJ, Frith CD, Liddle PF, Dolan RJ, Lammertsma AA, Frackowiak KS (1990) The relationship between global and local changes in PET scans. J Cerebr Blood-Flow Metab 10:458– 466
Gasser T, Bacher P, Mocks J (1982) Transformations towards the normal distribution of broad band spectral parameters of the EEG. Electroenceph Clin Neurophysiol 53:119–124
Geula C (1998) Abnormalities of neural circuitry in Alzheimer’ disease: hippocampus and cortical cholinergic innervation. Neurology 51:18–29
Gianotti LRR, Künig G, Lehmann D, Faber PL, Pascual-Marqui RD, Kochi K, Schreiter-Gasser U (2007) Correlation between disease severity and brain electric LORETA tomography in Alzheimer’s disease. Clin Neurophysiol 118:186–196
Grasby PM, Frith CD, Friston KJ, Simpson J, Fletcher PC, Frackowiak RS, Dolan RJ (1994) A graded task approach to the functional mapping of brain areas implicated in auditory– verbal memory. Brain 117:1271–1282
Gusnard DA, Raichle ME (2001) Searching for a baseline: functional imaging and the resting human brain. Nat Rev Neurosci 2:685– 694
Hartikainen P, Soininen H, Partanen J, Helkala EL, Riekkinen P (1992) Aging and spectral analysis of EEG in normal subjects: a link to memory and CSF AChE. Acta Neurol Scand 86:148–155 Hyman BT, Van Hoesen GW, Damasio AR, Barnes CL (1984) Alzheimer’s disease: cell-specific pathology isolates the hippo-campal formation. Science 225:1168–1170
Jagust WJ, Eberling JL, Reed BR, Mathis CA, Budinger TF (1997) Clinical studies of cerebral blood flow in Alzheimer’s disease. Ann NY Acad Sci 826:254–262
Jelic V, Dierks T, Amberla K, Almkvist O, Winblad B, Nordberg A (1998) Longitudinal changes in quantitative EEG during long-term tacrine treatment of patients with Alzheimer’s disease. Neurosci Lett 254:85–88
Keita MS, Frankel-Kohn L, Bertrand N, Lecanu L, Monmaura P (2000) Acetylcholine release in the hippocampus of the urethane anaes-thetised rat positively correlates with both peak theta frequency and relative power in the theta band. Brain Res 887:323–334
Kogan EA, Korczyn AD, Virchovsky RG, Klimovizky SS, Treves TA, Neufeld MY (2001) EEG changes during long-term treatment with donepezil in Alzheimer’ disease patients. J Neural Transm 108:1167–1173
Kubicki S, Herrmann WM, Fichte K, Freund G (1979) Reflections on the topics: EEG frequency bands and regulation of vigilance. Pharmakopsychiatr Neuropsychopharmacol 12:237–245 Lehmann D, Skrandies W (1980) Reference-free identification of
components of checkerboard-evoked multichannel potential fields. Electroenceph Clin Neurophysiol 48:609–621
Machulda MM, Ward HA, Borowski B, Gunter JL, Cha RH, O’Brien PC, Petersen C, Boeve BF, Knopman D, Tang-Wai DF, Ivnik RJ, Smith GE, Tangalos EG, Jack CR Jr. (2003) Comparison of memory fMRI response among normal, MCI, and Alzheimer’s patients. Neurology 61:500–506
Manes F, Springer J, Jorge R, Robinson RG (1999) Verbal memory impairment after left insular cortex infarction. J Neurol Neurosur Ps 67:532–534
Matsuda H (2001) Cerebral blood flow and metabolic abnormalities in Alzheimers disease. Ann Nucl Med 15:85–92
McKahnn G, Drachmann D, Folstein M, Katzman R, Price D, Stadlan EM (1984) Clinical diagnosis of Alzheimer’s disease: report of the NINCDS-ADRDA Work Group under the auspices of Department of Health an Human Services Task Force on Alzheimer’s disease. Neurology 34:939–944
Mega MS, Cummings JL, O’Connor SM, Dinov ID, Reback E, Felix J, Masterman DL, Phelps ME, Small GW, Toga AW (2001) Cognitive and metabolic responses to Metrifonate therapy in Alzheimer disease. Neuropsychiatry Neuropsychol Behav Neurol 14:63–68
Minoshima S, Giordani B, Berent S, Frey KA, Foster NL, Kuhl DE (1997) Metabolic reduction in the posterior cingulate cortex in very early Alzheimer’ disease. Ann Neurol 42:85–94
Mulert C, Jäger L, Schmitt R, Bussfeld P, Pogarell O, Möller H-J, Juckel G, Hegerl U (2004) Integration of fMRI and simultaneous EEG: towards a comprehensive understanding of localization and time-course of brain activity in target detection. NeuroImage 22:83–94
Nichols TE, Holmes AP (2002) Nonparametric permutation tests for functional neuroimaging: a primer with examples. Hum Brain Mapp 15:1–25
Nuwer MR, Comi G, Emerson R, Fuglsang-Frederiksen A, Guerit J-M, Hinrichs H, Ikeda A, Luccas FJ, Rappelsburger P (1998)
IFCN standards for digital recording of clinical EEG. Electro-enceph Clin Neurophysiol 106:259–261
Oakes TR, Pizzagalli DA, Hendrick AM, Horras KA, Larson CL, Abercrombie HC, Schaefer SM, Koger JV, Davidson RJ (2004) Functional coupling of simultaneous electrical and metabolic activity in the human brain. Hum Brain Mapp 21:257–270 Pascual-Marqui RD, Michel CM, Lehmann D (1994) Low resolution
electromagnetic tomography: A new method for localizing electrical activity in the brain. Int J Psychophysiol 7:49–65 Pascual-Marqui RD, Lehmann D, Koenig T, Kochi K, Merlo MCG,
Hell D, Koukkou M (1999) Functional imaging in acute, neuroleptic-naive, first-episode, productive schizophrenia. Psy-chiatr Res-Neuroim 90:169–179
Paulesu E, Frith CD, Frackowiak RSJ (1993) The neural correlates of the verbal component of working memory. Nature 362:342–345 Raichle ME, MacLeod AM, Snyder AZ, Powers WJ, Gusnard DA,
Shulman GL (2001) A default mode of brain function. P Natl Acad Sci USA 98:676–682
Riekkinen P, Buzsaki G, Riekkinen Jr P, Soininen H, Partanen J (1991) The cholinergic system and EEG slow waves. Electro-encephalogr Clin Neurophysiol 78:89–96
Shelley BP, Trimble MR (2004) The insular lobe of Reil—its anatamico-functional, behavioural and neuropsychiatric attributes in humans—review. World J Biol Psychiatry 5:176–200 Schreiter-Gasser U, Gasser T, Ziegler P (1993) Quantitative EEG
analysis in early onset Alzheimer’s disease: a controlled study. Electroencephalogr Clin Neurophysiol 86:15–22
Schreiter-Gasser U, Gasser T, Ziegler P (1994) Quantitative EEG analysis in early onset Alzheimer’s disease: correlations with severity, clinical characteristics, visual EEG and CCT. Electro-encephalogr Clin Neurophysiol 90:267–272
Small SA, Perera GM, DeLaPaz R, Mayeux R, Stern Y (1999) Differential regional dysfunction of the hippocampal formation among elderly with memory decline and Alzheimer’s disease. Ann Neurol 45:466–472
Stefanova E, Wall A, Almkvist O, Nilsson A, Forsberg A, Långström B, Nordberg A (2006) Longitudinal PET evaluation of cerebral glucose metabolism in rivastigmine treated patients with mild Alzheimer’s disease. J Neural Transm 113:205–218
Talairach J, Tournoux P (1988) Co-Planar Stereotaxic Atlas of the Human Brain. Stuttgart: Thieme
Towle VL, Bolanos J, Suarez D, Tan K, Grzeszczuk R, Levin D, Cakmur R, Frank SA, Spire JP (1993) The spatial location of EEG electrodes: Locating the best-fitting sphere relative to cortical anatomy. Electroencephalogr Clin Neurophysiol 86:1–6 Vincent JL, Snyder AZ, Fox MD, Shannon BJ, Andrews JR, Raichle
ME, Buckner RN (2006) Coherent spontaneous activity identifies a hippocampal-parietal memory network. J Neurophysiol 96: 3517–3531
Whitehouse PJ, Price DL, Clark AW, Coyle JT, DeLong MR (1981) Alzheimer disease: evidence for selective loss of cholinergic neurons in the nucleus basalis. Ann Neurol 10:122–126 WHO (1993) The ICD-10 Classification of mental and behavioral
disorders: diagnostic criteria for research. World Health Organi-zation, Geneva, Switzerland
Worrell GA, Lagerlund TD, Sharbrough FW, Brinkmann BH, Busacker NE, Cicora KM, O’Brien TJ (2000) Localization of the epileptic focus by low-resolution electromagnetic tomogra-phy in patients with a lesion demonstrated by MRI. Brain Topogr 12:273–282