The synergistic cooperation of NH
⋯O and CH⋯O hydrogen bonds in the
structures of three new phosphoric triamides
Anahid Saneeia, Mehrdad Pourayoubia, *, Jerry P. Jasinskib, Titus A. Jennyc, Aurelien
Crochetd, Katharina M. Frommd, Amanda C. Keeleyb
aDepartment of Chemistry, Faculty of Sciences, Ferdowsi University of Mashhad, Mashhad,
Iran, Tel: +985138805535, Fax: +985138807153, P.O. Box: 9177948974
bDepartment of Chemistry, Keene State College, 229 Main Street, Keene, NH 03435-2001, USA cDepartment of Chemistry, University of Fribourg, Rte du Musée 9 Ch-1700 Fribourg,
Switzerland
dFribourg Centre for Nanomaterial’s, FriMat, University of Fribourg, Chemin du Musée 3, CH-1700 Fribourg,
Switzerland
Email: [email protected]
Supplemental Materials
Background of the Hirshfeld surface analysis
Historically, the Hirshfeld surface (HS) emerged from an effort to define the space occupied by a molecule in a crystal for the purpose of partitioning crystalline electron density into molecular fragments.ES1 Such a surface was named in honor of F. L. Hirshfeld, who introduced the “stockholder partitioning” scheme.ES2 Afterwards, it was realized that the Hirshfeld surfaces possessed a number of attributes that make them attractive for identification of intermolecular interactions in the context of crystal packing.ES3 In a Hirshfeld surface, the parameters d
e and di
surface, respectively. The dnorm value is the sum of the normalised quantities of di and de by
considering the van der Waals radius of atoms involved. This value graphically highlights the regions of the surface involved in a specific type of intermolecular contact by a colored scheme: red regions represent contacts shorter than the sum of van der Waals radii; white regions represent intermolecular distances close to van der Waals contacts and blue regions represent contacts longer than the sum of van der Waals radii.ES4 The fingerprint plots (FPs) are introduced as the two-dimensional representations of the information provided by the generated HSs. The FPs are plotted on an XY-grid formed by de, di pairs (X = di and Y = de), where the frequencies of
occurrence of interactions (the number of points with a given de, di pair) are represented by
different colours. Moreover, the complementary regions are visible in the FPs where one molecule acts as a donor (de > di) and the other as an acceptor (de < di).ES5
Study of intermolecular interactions of compounds 1, 2 and 3 by Hirshfeld surface analysis
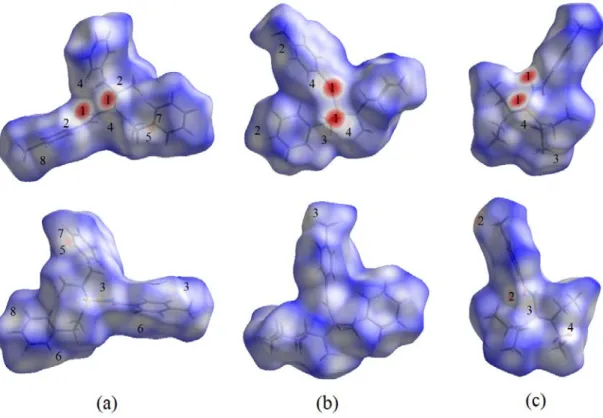
The Hirshfeld surfaces mapped with dnorm of 1–3 are given in Fig. 1a–c, in which the classical
and weak hydrogen bonds are identified with labels.
The features labeled 1 (a deep red area) in Fig. 1a–c are indicative of important interactions in all three structures, i.e. NCP–H⋯OP between one phosphoric triamide molecule and its
symmetry-related adjacent molecule. It is worth noting that in all three structures only the O atom of P═O group takes part in NH⋯O hydrogen bonding.
As mentioned in the section on X-ray crystallography, all three compounds contain weak CH⋯O intermolecular interactions with neighbouring molecules, which are monitored in the
related HS’s, as well. In this regard, the red spot marked with label 2 indicates the one remarkable CH⋯O interaction in the structure 1 (Fig. 1a), while such highlighted CH⋯O interactions in structures 2 and 3 are introduced by labels 3 and 4 in Fig. 1b and labels 2 and 3 in Fig. 1c. However, the CH⋯O contacts with lower degrees of importance also appear in the noted HS’s maps: labels 3 and 4 in Fig. 1a for 1 and label 4 in Fig. 1c for 3.
In structure 2, the very light red spot in Fig. 1b (label 2) is related to the only significant H⋯H contact which takes place between an H atom of an aromatic ring (C6H4) and an H atom of
an aliphatic ring (C6H11). The two other structures do not show such a highlighted H⋯H
interaction. Structure 1, with the most unsaturated systems with respect to two other structures, reveals weak C⋯H contacts shown as four small red regions (labels 5–8 in Fig. 1a), formed between the C and H atoms of unsaturated aromatic rings. The other structures do not show such highlighted C⋯H contacts in related Hirshfeld surfaces.
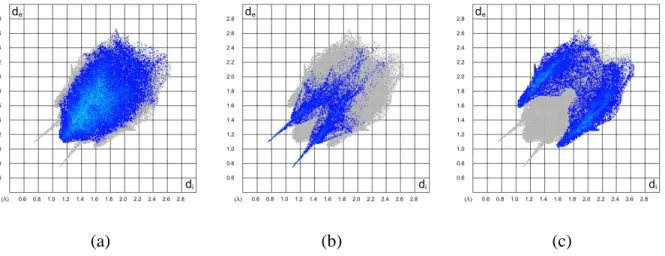
The full fingerprint plots of compounds 1–3 are illustrated in Figure S 2. These plots represent the total interactions which are also divided into the different types of interactions to show the contribution portion of each contact in the total Hirshfeld surface.
For 1–3, the H⋯H interactions, which cover the most surface area of the 2D fingerprint plot, exhibit the most significant contribution to the total Hirshfeld surface with respect to the other contacts (62.6%, 82.2% and 76.6%, respectively in Figs. S3a, S4a and S5a). The very high percentage of H⋯H interactions in 2 is due to the high number of hydrogen atoms and the bulk groups including hydrogen. A comparison of the H⋯H contacts in the structure 3 with the previously reported structure [2,6-F2C6H3C(O)NH]P(O)[N(C2H5)2]2,ES6 which is different by two
H⋯F interactions allows for a more contributed portion of weaker H⋯H interactions in the crystal packing of 3 (more about 20%).
Fingerprint plots of S3b, S4b and S5b show O⋯H contacts in structures 1 to 3, with two sharp spikes in the regions of the lower and upper sections of the figures. The O⋯H contacts include both NH⋯O and CH⋯O interactions and the highest percentage of O⋯H contacts was found for the structure 3 (9.4% 1, 9.5% 2 and 11.5% 3). The structure 1 with the highest numbers of unsaturated C atoms indicates the highest percentage of weak C⋯H contacts (26.5%, Figure S 3c). Besides these, there are also contacts with negligible contribution portions in all three structures, such as C⋯C and O⋯C, which are not shown in the related fingerprint plots.
IR and NMR Study
Stretching frequencies of the N–H units occur at 3087, 3077 and 3068 cm–1 for compounds 1, 2
and 3, respectively. The phosphorus chemical shifts of compounds 1, 2 and 3 are 14.76, 13.77 and 13.09 ppm, respectively.
Table 4 lists the 1H and 13C NMR assignments of both compounds, with the assignments
achieved by 2D experiments. In the 1HNMR spectra of 1, 2 and 3, the broad signals at 9.37, 8.89 and 8.98 ppm, respectively, are related to the corresponding C(O)NHP(O) protons.
The aromatic protons of the CH3–C6H4C(O) segment in 1–3 are revealed as two doublet
signals in the range of 7.78–7.86 ppm for H2 and H6 and 7.26–7.29 ppm for H3 and H5. In the 1HNMR spectrum of 1, the two benzylic protons of the CH
2–C6H5 section are observed
as two dd signals at δ = 4.24 and 4.16 ppm. This pattern is a result of geminal 2J
3J
PNCH couplings. The doublet signal at 2.54 ppm (3JPNCH = 10.1 Hz) is assigned to the N-CH3
protons.
The Haxial and Hequatorial signals of the cyclohexyl group in 2 are distinguished by their
different splitting patterns. Supported by the Karplus equationES7 and the different P–N–C–Haxial
and P–N–C–Hequatorial torsion angles, the doublet of multiplets at δ = 1.74, 1.72, 1.62, 1.59 and
1.55 ppm are assigned to Hequatorial and two qd signals at δ = 1.50 and 1.46 ppm and three qt at δ
= 1.22, 1.18 and 1.02 ppm can be attributed to the Haxial. The tdt pattern observed at δ = 3.31 ppm
is due to the spin coupling between H1′ with Hequatorial (3JHCCHeq = 11.9 Hz), Haxial (3JHCCHax = 3.5
Hz) and the phosphorous nuclei (3JPNCH = 9.3 Hz).
In compound 3, the qd at 3.07 ppm belongs to the CH2-protons of the N–Et group. This
splitting pattern is expected since the distance to 31P would yield a doublet signal with 3JPNCH =
11.1 Hz and also, two mutually quartets which are expected from the splitting by the methyl group (3JHCCH= 7.1 Hz).
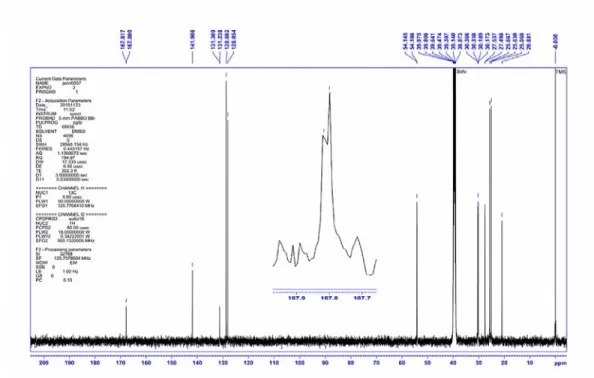
For compounds 1–3, the doublet signals in the 13CNMR spectra at δ = 168.31, 167.81, 167.82 ppm (with 2J
PC = 2.2, 2.2, 2.1 Hz, respectively) resulting from the coupling with P nuclei,
correspond to the C(O) groups. In all three molecules, the doublet signals at δ = 130.89 to 131.28 (3JPC in the range of 8.6–8.9 Hz) are assigned to the corresponding C1 atom of CH3-C6H4
segment. It should be noted that each carbon atom of N(CH3)(CH2C6H5), N(CH3)(C6H11) and
N(C2H5)2 moieties with two or three bond separations from the corresponding P atom are
observed as a doublet signal due to the P–C coupling.
References
ES2. Hirshfeld, F. L. Theor. Chim. Acta 1977, 44, 129–138.
ES3. McKinnon, J. J.; Spackman, M. A.; Mitchell, A. S. Acta Cryst. B 2004, 60, 627–668. ES4. Spackman, M. A.; Jayatilaka, D. CrystEngComm 2009, 11, 19–32.
ES5. Spackman, M. A.; McKinnon, J. J. CrystEngComm 2002, 4, 378–392.
ES6. Tarahhomi, A.; Pourayoubi, M.; Golen, J. A.; Zargaran, P.; Elahi, B.; Rheingold, A. L.; Leyva Ramírez, M. A.; Mancilla Percino, T. Acta Cryst. B 2013, 69, 260–270.
ES7. Drago, R. S. Physical Methods for Chemists, second ed., Saunders College Publishing, Florida, 1992.
Figure S 1: Two orientations of the Hirshfeld surfaces for molecules 1–3. Labels on HS’s are:
(a): NH⋯O (1), CH⋯O (2–4), CH⋯C (5–8); (b): NH⋯O (1), H⋯H (2), CH⋯O (3, 4); (c): NH⋯O (1), CH⋯O (2–4).
1 2 3
(a) (b) (c)
Figure S 3: Divided fingerprint plots for 1. Close contacts are as follows: (a) H⋯H (62.6%), (b)
O⋯H / H⋯O (9.4%) and (c) C⋯H / H⋯C (26.5%).
(a) (b) (c)
Figure S 4: Divided fingerprint plots for 2. Close contacts are as follows: (a) H⋯H (82.2%), (b)
(a) (b) (c)
Figure S 5: Divided fingerprint plots for 3. Close contacts are as follows: (a) H⋯H (76.6%), (b)
O⋯H / H⋯O (11.5%) and (c) C⋯H / H⋯C (11.8%).
Figure S 7: 1H NMR spectrum of compound 1 (DMSO-d6).
Figure S 9: 31P{1H} NMR spectrum of compound 2 (DMSO-d 6).
Figure S 11: 13C NMR spectrum of compound 2 (DMSO-d6).
Figure S 12: 31P{1H} NMR spectrum of compound 3 (DMSO-d 6).
Figure S 13: 1H NMR spectrum of compound 3 (DMSO-d6).