Genotyping
of Plasmodium
falciparum
infections
by PCR: a comparative
multicentre
study
A. F&nert1s2, A. P. Arez3, H. A. Babiker4, H. P. Beck*, A. Benito6, A. Bjiirkman*, M. C. Bruce’,
D. J. Conway, K. P. Day’, L. Henning’, 0. Mercereau-Puijalon 9, L. C. Ranford-Cartwright4t, J. M. Rubio6, G. Snounoul”t, D. Walliker4, J. Zwetyenga’ and V. E. do Rosario ‘Division of Infectious Diseases, Department of Medicine, Karolinska Institutet, Huddinge University Hospital, 14186 Huddinge, Sweden; 2 Division of Infectious Diseases, Department of Medicine, Karolinska Institutet, Karolinska Hospital, 17176 Stockholm, Sweden; 3Centro de Ma&a e outras Doencas Tropicais, Instituto de Higiene e Medicina Tropical, Universidade Nova de Lisboa, Rua da Junqueira 96, 1349-008 Lisboa, Portugal; 41nstitute of Cell, Animal and Population Biology, University of Edinburgh, Edinburgh EH9 3JT, UK; ‘Swiss Tropical Institute, Socinstrasse 57, CH 4002 Basel, Switzerland; 6Servicio de Parasitologia, Centro National de Microbiologia, Instituto de Salud Carlos ZZI, Majahonda, 28220 Madrid, Spain; ’ Wellcome Trust Centre for the Epidemiology of Infectious Diseases, University of Oxford, South Parks Road, Oxford OX1 3FY, UK; 8London School of Hygiene and Tropical Medicine, Keppel Street, London WC1 E 7HT, UK; 9 Unid d’ Immunologie Moliculaire des Parasites, Institut Pasteur, 25 rue du Dr Roux, 75015 Paris, France; “Depanment of Infection and Tropical Medicine, Imperial College School of Medicine, Northwick Park Hospital, Harrow, Middlesex HA1 3UJ, UK
Abstract
Genetic diversity of malaria parasites represents a major issue in understanding several aspects of malaria infection and disease. Genotyping of Plasmodium falciparum infections with polymerase chain reaction @‘CR)-based methods has therefore been introduced in epidemiological studies. Polymorphic regions of the mspl, msp2 and gluT genes are the most frequently used markers for genotyping, but methods may differ. A multicentre study was therefore conducted to evaluate the comparability of results from different laboratories when the same samples were analysed. Analyses of laboratory-cloned lines revealed high specificity but varying sensitivity. Detection of low-density clones was hampered in multiclonal infections. Analyses of isolates from Tanzania and Papua New Guinea revealed similar positivity rates with the same allelic types identified. The number of alleles detected per isolate, however, varied systematically between the laboratories especially at high parasite densities. When the analyses were repeated within the laboratories, high agreement was found in getting positive or negative results but with a random variation in the number of alleles detected. The msp2 locus appeared to be the most informative single marker for analyses of multiplicity of infection. Genotyping by PCR is a powerful tool for studies on genetic diversity of I? falciparum but this study has revealed limitations in comparing results on multiplicity of infection derived from different laboratories and emphasizes the need for highly standardized laboratory protocols. Keywords: malaria, Plasmodium fulciparum, genetic analysis, genotypes, polymerase chain reaction, mspl, msp2, ghp, multicentre study, interlaboratory variation
Introduction
The Plasmodium falciparum parasite has shown exten- sive polymorphism, and malaria infections consist mostly of multiple clones in high- (NTOUMI et al., 1995; BECK et al., 1997), medium- (KYES et al., 1993; ZWEXYENGA et al., 1998) and low-transmission areas (BABIKER etal., 1998; PAUL etal., ~~~~;HADDAD etal., 1999). The issue of diversity of malaria parasites needs to be addressed in different epidemiological settings in relation to transmission levels and acquisition of immu- nity, as well as control measures such as vaccine develop- ment, drug-efficacy trials and exposure-reducing in- terventions. Genotyping of l? falciparum infections has therefore been introduced in many epidemiological studies on malaria.
The most commonly used markers for the genotyping of I? falciparum populations are regions of genes coding for 3 surface antigens: the merozoite surface proteins 1 (MSPl) and 2 (MSP2) and glutamate-rich protein (GLURP). These have been considered suitable markers since they are unlinked single-locus genes which exhibit great polymorphism, both in length and sequence. The length variations of these genes are primarily due to
‘Current addresses: L. C. Ranford-Cartwright, Division of Infection and Immunity, Institute of Biomedical and Life Sciences, University of Glasgow, Glasgow G12 8QQ, UK, G. Snounou, Unite de Parasitologie Biomedicale, Institut Pasteur, 25 & 28 Rue du Dr Roux, 75724 Paris Cedex 15, France. Address for correspondence: Anna F&rnert, Division of Infec- tious Diseases, Department of Medicine, Karolinska Institutet, Karolinska Hospital, S-171 76 Stockholm, Sweden; phone +46 8 51771861 or +46 8 51773358, fax +46 8 51771806, e-mail [email protected]
tandemly repeated sequences, and alleles can be readily distinguished following electrophoresis of polymerase chain reaction @‘CR)-amplified products. With regard to mspl, such repeats occur in a region denoted ‘block 2’, and alleles can be further differentiated into 3 groups by sequence variations denoted Kl-, MAD20- and R033- types (KIMURA et al., 1990). msp2 alleles are classified similarly into 2 sequence groups denoted FC27- and ICI 3D7-types as well as by length polymorphisms (SMYTHE et al., 1990). For glurp, no allelic groups based on sequence have been identified, alleles being differen- tiated by size polymorphisms alone (BORRE et al., 199 1).
The use of PCR to detect alleles of the above genes has proven a powerful technique to characterize parasite populations even in small volumes of blood with low parasite densities. However, although the same marker genes may be targeted, different protocols are used by different research groups. To validate comparisons of results from different epidemiological studies, there is a need to estimate the comparability of results derived from different laboratories. A comparative methodolo- gical study was therefore conducted including labora- tories which regularly perform genotyping on mspl block 2, msp2 and/or glurp for studies of varying aspects of diversity of l? falciparum. The study derived from the Network on Molecular Epidemiology of Malaria in which the application of the genotyping method had been discussed (BJ~RKMAN et al., 1998). Blood samples were aliquoted and sent for genotyping analyses accord- ing to the protocols regularly used by the respective laboratories. Laboratory-cloned parasite lines were first analysed by 6 laboratories. Blood samples from field surveys were then analysed by 8 laboratories. The study included evaluations of both intra- and inter-laboratory variation and the results represented what would have been reported in a study on multiplicity of infection within the respective laboratories.
226 A. FiiRNERT ETAL.
Methods
Laborato y-cloned parasite lines
Dilutions and mixtures of 3 cloned parasite lines, 3D7, HB3, R033 (from the WHO malaria parasite repository, Edinburgh University), were aliquoted (20 &) and distributed to 6 laboratories (Labs l-3, 5, 6, 9). The clones were diluted in whole blood in 1 O-fold dilutions to final concentrations of 1000-O. 1 parasites/pL. Mixtures were made of 2 clones in different proportions (10:990, 500:500, 99O:lO parasites/&).
whole bloodfiomjkld surveys
Aliquots (25 ILL> from 40 frozen venous-blood sam- ples, obtained in epidemiological surveys in Tanzania (30) and Papua New Guinea (lo), were distributed to 8 laboratories (Labs l-8). Parasite densities, estimated by counting the number of parasites in 200 microscope fields of Giemsa-stained thick films (assuming that 200 fields represented 0.2 l,rL of blood), ranged from 0 to 29 571 parasites/pL. Nine samples were parasite negative by microscopy.
PCR geno typing
In both experiments the blood samples were coded. The laboratories performed PCR-based genotyping of P. falciparum populations according to their routine proto-
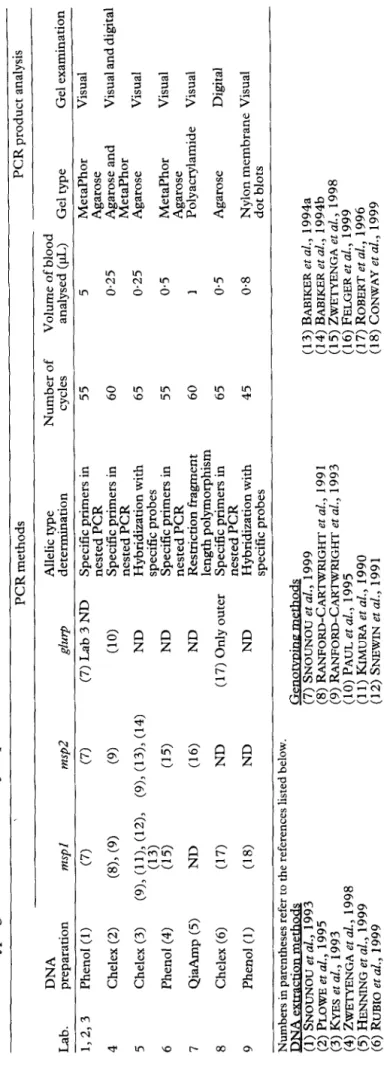
cols. Differences in DNA extraction, PCR methods (genetic markers analysed, number of amplification cycles, corresponding volume of whole blood analysed by PCR), and PCR-product analyses (type of gel and method of visualization) are shown in Table 1. Purifica- tion of DNA was performed by phenol extraction, Chelex-boiling or using QiaAmp Tissue Kits (Qiagen, Santa Clarita, CA, USA),
All laboratories performed an outer PCR of the respective markers. Different methods were then used for the determination of allelic groups of mspl block 2 and/or msp2: (i) a second nested PCR with family- specific primers, (ii) blotting of PCR products and hybridization with allelic group-specific probes, and (iii) analysis by restriction fragment length polymorph- ism (RFLP). An additional analysis of msp2 hybrids performed by Lab 6 was not included in comparison since this is a different type of analysis. A nested or semi- nested PCR was performed for analysis of the glurp gene. Analyses of PCR products were performed after gel electrophoresis in all laboratories. - Mainly Metaphor Aearose (FMC Biooroducts. Rockland. USA). but also regular agarose and-polyacrylamide gels were used. The enumeration of bands was generally done by eye, except for 2 laboratories which analysed by software (BioRad Gel Dot 1000 and Multi Analyst, BioRad, Hercules, CA, USA).
The PCR analyses of field samples were performed on 2 different occasions, by 1 investigator per laboratory and following the standard protocol of that laboratory. One analysis was performed per laboratory on the samples derived from the cloned lines.
Enumeration of alleles
The number of l? falciparum genotypes per isolate, i.e., the minimum number of genetically diverse para- sites, was defined as the highest number of bands identified for either mspl, msp2 or glurp (depending on what markers the respective laboratories analysed). The number of mspl and msp2 alleles was the sum of alleles detected within the Kl-, MAD20- and RO33-, and FC27- and IC/3D7-allelic groups, respectively.
The highest number of alleles detected in either of the 2 PCR analyses of 1 blood sample done in a single laboratory was selected for the comparisons between laboratories. This was believed to represent what each laboratory would have described if an individual sample had been analysed twice.
Statistical methods
ANOVA repeated measures were used for compari- sons of number of alleles detected between laboratories. This was followed by pairwise comparisons by a Tukey test (FLEISS, 1986) to analyse whether there were any systematic differences between the laboratories. Co- chran’s test (SIEGEL & CASTELLAN, 1988) was per- formed to detect systematic differences between laboratories with respect to positive or negative samples. Variations between 2 repeated PCR analyses within the respective laboratories were estimated byrepeatabil- itv coefficients (RC) calculated from ANOVA reoeated measures (Bti~, ‘1995) in which RC = 2 X 1 .&SD, using standard deviations (SD) within laboratories. The RCs thus represent the limits within which 95% of the differences between 2 measurements of number of alleles are expected.
Spearman rank order correlation coefficients (SIEGEL & CASTELLAN, 1988) were calculated to study the relations between interlaboratory variation (SD) per sample and mean number of alleles, and SD versus parasite density per sample. The Spearman rank order correlation coefficient was also used to estimate the correlation between multiplicity and parasite density for the respective laboratories.
Results
Cloned parasite lines
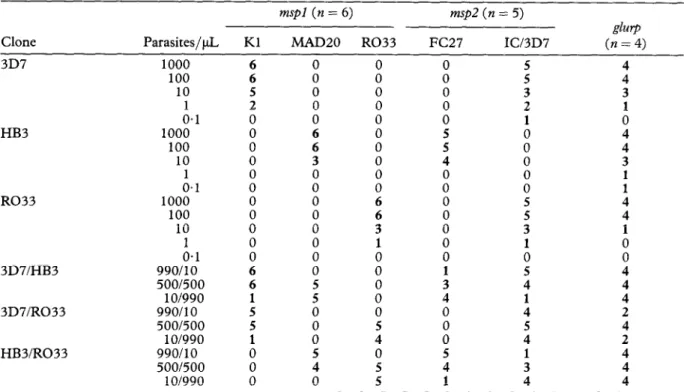
In an initial analysis of single cloned laboratory lines, determination of the allelic types of the mspl block 2 and msp2 regions revealed a high specificity of detection, i.e., all laboratories detected the same allelic types (Table 2). However, the level of detection varied for the different parasite lines and laboratories (0. l-l 00 parasites/yL). All laboratories generated positive results with the single- clone samples with 100 parasites/pL, and the majority (67-80%) also with the samples with 10 parasites/yL. In the investigation of mixed clones, all laboratories detected both genotypes of mixtures of 500:500 para- sites/pL. The uneven mixtures (99O:lO parasites/&) were found to be mostly positive for the high-concentra- tion clone only. At low parasite densities, parasites were thus more often detected in single compared to mixed infections. For example, the Kl-type of mspl was detected by 5 of 6 laboratories in single 3D7 infections (10 parasites/kL) but only by 1 laboratory when mixed with high numbers of HB3 or R033.
Blood samples>om field surveys
Variation within laboratoties. After DNA extraction, all PCR analvses of the 40 field samoles were oerformed twice in the respective laboratories. A high’degree of agreement (75-100%) in getting positive or negative results in both analyses was generally found within each laboratory (Table 3). One laboratory (Lab 4) was less consistent.
Repeatability coefficients (RC) were calculated to estimate to what extent the number of alleles detected varied within a laboratory when a sample was analysed twice (Table 4). This variation was not systematic, i.e., more bands were not detected more often in the first or the second analysis, indicating that it was randomly spread in all samples. The high RCs in some laboratories were not dependent on a few extreme values.
To assess variation in the internretation of gels, a blinded repeat reading of gel photographs was performed in 1 laboratory (Lab 3) by the same worker on 3 different occasions. Out of 200 readings (40 samples analvsed bv 3 - mspl and 2 msp2 allelic types), 22%showed-different results on 1 of the 3 occasions and 1.5% showed different results in all 3 readings.
Variation between laboratories. The total numbers of samples positive for the different markers are presented in Table 3. The laboratories detected parasites in 32-37 samples. All 40 samples were, however, found to be positive by at least 1 laboratory. In 5 samples, parasites
Table 1. Genotyping methods used for P. falciparum in the nine laboratories PCR methods PCR product analysis DNA Allelic type Number of Volume of blood Lab. preparation WEpI msp2 gluq determination cycles analysed (pL) Gel type Gel examination 1,223 Phenol (I) (7) (7) (7) Lab 3 ND Specific primers in 55 5 Metaphor Visual nested PCR Agarose 4 Chelex (2) (8)> (9) (9) (10) Specific primers in 60 0.25 Agarose and Visual and nested PCR Metaphor 5 Chelex (3) (9), ((‘1’4; (12), (9)> (13), (14) ND Hybridization with 65 0.25 Agarose Visual 6 specific probes Phenol (4) (15) (15) ND Specific primers in 55 0.5 Metaphor Visual nested PCR Agarose 7 Qi*p (5) ND (16) ND Restriction fragment 60 I Polyacrylamide Visual length polymorphism 8 Chelex (6) (17) ND (17) Only outer Specific primers in 65 0.5 Agarose Digital 9 nested PCR Phenol (1) (18) ND ND Hybridization with 45 0.8 Nylon membrane Visual specific probes dot blots Numbers in parentheses refer to the references listed below. m (7) SNOUNOU et ;.,‘I999 (13) BABIKER et al., 1994a (2) PLOWE et al., 1995 (8) RANFORD-CARTWRIGHT et al., 199 1 (14) BABIKER etal., 1994b (3) KYES et al., 1993 (9) RANFORD-CARTWRIGHT et al., 1993 (15) ZWETYENGA etal., 1998 (4) ZWJXYENGA etal., 1998 (10) PAUL et al., 1995 (16) FELGER et al., 1999 (5) HENNING et al., 1999 (11) KIMURA et al., 1990 (17) ROBERT et al., 1996 (6) RUBIO et al., 1999 (12) SNEWIN et al., 1991 (18) CONWAY et al., 1999 ND, not done.
228 A. FiiRNERT ETAL.
Table 2. Analyses of laboratory-cloned I? falca$arum lines in different dilutions and mixtures: number of laboratories with positive PCR results
Clone 3D7
mspl (n = 6) msp2 (n = 5)
&rp
Parasites/$ Kl MAD20 R033 FC27 ICi3D7 (n = 4)
1000 6 0 0 0 5 4 100 10 A.1 HB3 1000 100 10 A.1 R033 1000 100 10 A.1 3D7/HB3 QQOllO 500/500 1 O/990 3D7/R033 QQOllO 500/500 1 O/990 HB3/R033 QQO/lO 500/500 1 O/990 6 5 2 0 0 0 0 0 0 0 : 0 0 6 6 : : 0 0 0 0 0 0 0 6 6 3 0 0 0 : 0 0” 5 i 00 i 0 0 0 0 0 0 0 : 0 ii 3 1 0 0 0 0 0 5 4 0 5 5 0 0 : z 4 0 0 0 0 0 0 0 1 3 : i 5 4 1
s
3 2 1 0 0 0 : 5 5 1 z 4 : 5 4 1 3 44
3 1 0 4 4 3 1 : 4 1 0 : 4 4 2 4 2 4 4 4 Six laboratories analysed the mspl block 2, 5 the msp2 and 4 the glurp regions.Table 3. Intra-laboratory agreement (% of samples) between positive or negative results in two repeated PCR analyses of 40 field isolates for P. fakiparum and the total number of samples positive in the first and/or second analysis
Lab. Kl
mspl msp2 &rp No.
positive
No. No. No. by any
MAD20 R033 positive FC27 IC/3D7 positive positive marker
: 95 95 90 93 100 100 32 34 93 95 100 83 34 32 17050 3 4” lib I% lZ lz 90 88 35 ND 58 55 33 71 2 100 90 100 83 93 32 % i% 85 93 88 83 31 37 ii: 7 ND ND ND 8 95 83 100 31 I% I% I% 90 35 37 % 34 37 34 36 GE 37 32 ND 33 14 33
“Only 38 samples were analysed. ND, not done.
Table 4. Repeatability coefficients (RC) of P. falciparum gene analysis in eight laboratories: 95% of all differences are expected to be less than the RC level when a sample is analysed on two different occasions within the same laboratory
mspl msp2
Lab. Kl MAD20 R033 Total FC27 ICY3D7 Total &rp Total
: ;:;a Al: co.01 0.7 (g’ 2.1 1.3 2.7 0.3 2.1 0.8 ;:; 2.0 0.6
3 4 rtri rtr: l% A: 4-O 1.8 2.3 5.2 ;:; ND 3.1” ;:; 5 1.4 1.0 O-6 1.4 1:‘: 1.7 1.6 ND 1.7 6 AA lz 7% lz 1.7 E 1.4 7 1.8 ;:; 1.8 8 1.3 1.6 <O.Ol 1.4 li: . ND ND 0.7 0.7
were detected by only 1 or 2 laboratories. The same allelic types were generally detected within mspl and msp2 for the different samples. Discrepancies between laboratories were found mainly in samples with low parasite densities but they also occurred sporadically at higher parasite densities. In these samples, 1 allelic type was regularly found by all laboratories but additional types were found by only some.
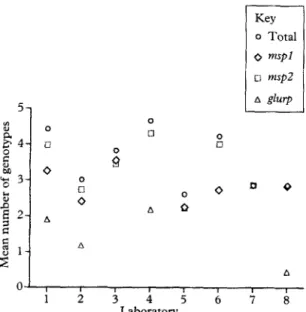
The number of identified alleles differed systemati- cally between the laboratories (P <O.OOl). The mean total number of alleles, i.e., multiplicity of infection, detected per laboratory ranged from 2.6 to 4.7 (Fig. 1). The differences were significant also within the respec- tive markers (P <O.OOl). Even when the 5 most dis- crepant samples, i.e., with the highest SDS, were excluded, the variation between laboratories remained significant for all markers (P CO.00 1). Pairwise com- parisons between laboratories showed that no single laboratory was responsible for the overall inter-labora- tory differences. Moreover, results from laboratories using the same method (Labs 1, 2 and 3) generally differed as much as results from laboratories using dif- ferent methods.
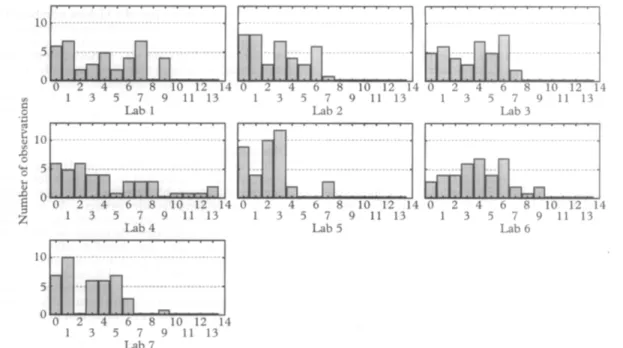
The distribution of observed number of alleles of the 3 markers showed somewhat different patterns, as illu- strated for the msp2 analysis in Figure 2. Some labora- tories detected a greater number of alleles than others. One laboratorv detected UD to 13 msv2 alleles in a single
sample whereas other laboratories identified no more than 7 alleles in any sample.
Analysis of laboratory differences in relation to multi- plicity of infection revealed that the variation (SD) increased with the number of alleles (rs = 0.56, P <O.OOl) (Fig. 3). This increase reflected what could be expected from a normal distribution, i.e., larger variation was found in higher numbers. The correlations between number of alleles and parasite density for the respective laboratories were estimated as rs = 0.48-0.70 (P <O.OOl), indicating a positive correlation between multiplicity and parasite density. A positive correlation was also found between parasite density and variation (SD) between laboratories ( rS = O-49, P = 0.00 1).
Analysis of the msp2 or the mspl markers revealed higher numbers of alleles than analysis of the glurp markers (Fig. 1). Inclusion of several markers generated
Key 0 Total 0 mspl iI1 mspz A dW A 0’ , I I 1 I I 1 I 1 2 3 4 5 6 7 8 Laboratory
Fig. 1. PCR-genotyping analysis, by 8 laboratories, of 40 blood samples from field sweys. Results on mean number of alleles of the I? falciparum m.spl block 2, msp2 and/or glurp regions and the total number defined as the highest number in all markers used by the respective laboratories.
higher total numbers since the highest number of alleles within any of the markers was chosen as the total number in a sample analysed. An analysis of how the total number was affected if 1 marker was removed from the multi- locus analyses revealed that msp2 generally contributed most. extent for 2 laboratories in which mspl was the mostOinformative marker. The glurp gene did not con- tribute to the total mean allele value, except in 1 laboratory.
Discussion
PCR is a sensitive method for studying polymorphic genes of malaria parasites in field samples. However, there are many variables involved in its use, such as the design of oligonucleotide primers, PCR conditions (master mix, cycle temperatures and time), and analysis of PCR products (gel type, detection method). The use of different protocols can therefore affect the level of sensitivity of the genotyping analysis, and is the most probable explanation of the differences in the results reported here. Since many methodological components differed among the laboratories, it was difficult to specify which factors were the most important in the respective protocols.
The specificity and sensitivity of detecting specific allelic types of mspl block 2 and msp2 were generally high in all laboratories for both the clones and field samples analysed. The main discrepancy was in the number of alleles detected in the field samples, which varied randomly within and systematically between labora- tories. These differences were difficult to evaluate fully since the exact compositions of parasite alleles in these samples were not known. Most samples were found to have mixed infections with multiple parasite clones. In these samples, the same 1 allelic type was regularly found by all laboratories whereas additional types were found by only some. The analyses of known parasite mixtures of laboratory-cloned linei revealed that clones at low con- centration were more difficult to detect in mixed infec- tions than as single-clone infections. This observation confirms a previous report by CONTAMIN et al. (1995), and a possible reason is assay-dependent competition. The findings indicate that genetic diversity is probably often underestimated in such field samples.
The volume of blood analysed could not explain the reported differences in mean number of alleles. Impor- tantly, different protocols could not alone explain the differences, sin&laboratories following the same proto- col also eenerated different results. Reseated thawing of frozen Good samples may also affect the detection of malaria parasites by PCR (F~~RNERT et al., 1999), but we do not think this played any significant role in this study since the samples were sent uniformly frozen to all laboratories.
Parasite density clearly affected the detection rate. Below densities of 100 parasites/pL, the reliability of getting positive results decreased, and at high parasite densities discrepancies were found in the number of alleles detected. The highest multiplicity, however, may not necessarily be the most correct result since, especially at high concentrations of DNA, the PCR might generate artefacts such as non-specific products that can be difficult to differentiate from ‘true’ products. The rela- tively higher number of alleles detected at high parasite densities might also mean that more diverse parasite populations per se are present in such infections. This view is partly supported by the finding that all the different allelic types were more often concurrently detected in the high-density samples. Increased variation in results among laboratories was seen with increasing level of multiplicity of the samples, i.e., the laboratories differed more in samples with high multiplicity. This was to be expected but it also reflects the relationship to high parasite densities.
Repeated analyses of the same samples often generated different results within a given laboratory, although this
230 A.FiiRNERT ETAL.
2 1 3 5 7 9 11 13 13 5 7 91113 1 3 5 7 9 11 13
.s Lab1 Lab2 Lab 3
ki e a, 10 z 3 5 . . . . ..__.___.~...~..” _.... ,._. _... .“_. . . ” _ 8 % O z 0 12 3 4 5 6 7 8 9 10 12 14 0 11 13 12 345 6 7 8 9 10 12 14 0 11 13 1 2 3 4 5 6 7 8 9 10 12 14 11 13
Lab4 Lab5 Lab6
I”. .‘.‘.“. .‘. I
o- ~
O 1 2 3 4 5 6 7 * 9 lo 11 13 l2 l4 Lab 7
Fig. 2. Distribution of number of P. fdciparum isolates (y-axis) in which a specific number of alleles of the msp2 gene (x-axis) were detected when 40 field isolates were analysed by 7 laboratories.
4
1
0 0 3- 2? 0 8 0 0 1 2- 0 0 0 a 63 0 ooo 0 O”o 00 00 00 0 o 00 0 l- 0 0 0 00 0 0 0 0 0 0 I I I I I I I I 0 1 2 3 4 5 6 7 8Mean number of alleles/sample
Fig. 3. Mean and variation (SD) of number of I? falciparum alleles in 40 field isolates analysed by 8 laboratories.
variation was mostly of the order of 1 genotype more or less. These differences were not found to be systematic and can therefore be considered as random assay varia- tion without any specific explanation. One source of intra-laboratory variation was represented by differences in the interpretation of the number of PCR fragments on gels, as was found here and by others (K. P. Day, unpublished data). The reproducibility of the PCR assays needs to be related to the level of detection, i.e., high reproducibility may be counteracted by low sensi- tivity. When reproducibility is low, at least 2 PCR analyses per sample are needed for analyses of individual samples. In epidemiological studies for estimating the
mean number of alleles in a population, 1 analysis per
sample may be sufficiently informative. However, re- peated analyses should, of course, provide a truer estimate.
The choice of marker genes for genotyping of Z?
falcibarum infections will obviouslv depend on the spe- “cific’ research questions asked. For estimation of m&i-
plicity of l? falciparum infection, the msp2 locus was generally found to be more informative than mspl block 2, and glurp showed least diversity. However, multi-locus analysis inevitably improves the estimated multiplicity of
infection. The use of several markers has proven parti- cularly useful for detailed studies on complex parasite- population structures and dynamics (VIRIYAKOSOL
et al., 1994; HILL & BABIKER, 1995; CONTAMIN et al., 1996; DAUBERSIES etal., 1996; FARNERT~~~~., 1997) as well as to assess the clonality of a P. falciparum population in a malaria outbreak (AREZ et al., 1999).
There are 2 principal outcomes of our work. First, PCR methodology has been validated as the most important current method for typing polymorphic genes of l? falciparum. The results obtained in each laboratory were broadly similar in their sensitivity when the labora- tory clones were examined, all detecting parasites at 100/~L, and most at lO/yL. With regard to specificity, all laboratories detected the major allele of each gene present in the field samples, together with a varying number of other alleles. Second, our results have shown that reports from different laboratories of variations in parasite-population structure in diverse geographical areas, or even over periods of time, might actually be due to technical differences between the laboratories rather than true epidemiological differences. No specific methodological reasons could be identified for these discrepancies, but they appeared to be mainly labora- tory-dependent. We recommend, therefore, that stan- dardized procedures should be used in such work, even though in practice this is probably difficult to achieve because of the large number of variables involved in PCR technology. It is quite clear, however, that for optimal comparisons of samples from different regions, analysis should preferably be carried out within a single labora- tory (e.g. BABIKER et al., 1997; KONATI? et al., 1999).
Our overall findings do not detract from the undoubted importance and practical value of PCR methodology in epidemiological studies on malaria.
Acknowledgements
We thank Jan Kowalski (Division of Medical Statistics, Karolinska Institute), Luzia Goncalves (UEI Biostatistica, IHMTAJNL), JoZo P. Pinto and Hemique Silveira (CMDT, UEI Malaria, IHMTUNL) for their assistance. This work was funded by Praxis XXI in Portugal, DGlZEuropean Commu- nion, the Swedish International Development Agency, the Wellcome Trust, the UK Medical Research Council, Fondo de Investigaciones Sanitarias in Spain and the Swiss National Foundation.
References
Arez, A. I?., Snounou, G., Pinto, J., Sousa, C. A., Modiano, D., Ribeiro, H., France, A. S., Alves, J. & do Rosario, V. E. (1999). A clonal Plasmodium falciparum population in an isolated outbreak of malaria in the Republic of Cabo Verde. Parasitology, 118,347-355.
Babiker, H. A. (1998). Unstable malaria in Sudan: the influence of the dry season. Plasmodium jalciparum population in the unstable malaria area of eastern Sudan is stable and geneti- callv comulex. Transactions of the Royal Society of Tropical Medicine&d Hwiene. 92. 585-589. - - - - Babiker, H. A., Ra.“nforkCartwright, L. C., Currie, D., Charl-
wood, J. D., Billingsley, I’., Teuscher, T. & Walliker, D. (1994aj. Random mating in a natural population of the malaria parasite Plasmodium falciparum. Parasitology, 109, 413-421.
Babiker, H. A., Ranford-Cartwright, L. C., Sultan, A., Satti, G. & Walliker, D. (199413). Genetic evidence that RI chloroquine resistance of Plasmodium falciparum is caused by recrudes- cence of resistant parasites. Transactions of the Royal Society of Tropical Medicine and Hygiene, 88, 328-33 1.
Babiker, H. A., Lines, J., Hill, W. G. & Walliker, D. (1997). Pouulation structure of Plasmodium falcioarum in villaaes with d&erent malaria endemicitv in east A&a. American-Yournal of Tropical Medicine and Hygiene, 56, 14 1 - 147. d Beck, H. I’., Felger, I., Huber, W., Steiger S., Smith, T., Weiss,
N., Alonso, I?. & Tanner, M. (1997). Analysis of mutiple Plasmodium jalciparum infections in Tanzanian children dur- ing the Phase III Trial of the malaria vaccine SPf66. Journal of Infectious Diseases, 175, 921-926.
Bjorkman, A., do Rosario, V. E., Snounou, G. & Walliker, D. (1998). Standardizing PCRfor molecular epidemiology stud- ies of malaria. Parasitology Today, 3, 85.
Bland, M. (1995). An Introduction to Medical Statistics. Oxford Medical Publications. 2nd edition. Oxford: Oxford Univer- sity Press.
Borre, M. B, Dziegiel, M., Hogh, B., Petersen, E., Rieneck, K., Riley, E., Meis, J. F., Aikawa, M., Nakamura, K., Harada, M., et al. (1991). Primary structure and localization of a conserved immunogenic i’lasmodium falciparum glutamate rich protein (GLURP) expressed in both the preerythrocytic and erythrocytic stages of the vertebrate life cycle. Molecular and Biochemical Parasitology, 49, 119- 13 1.
Contamin, H., Fandeur, T., Bonnefoy, S., Skouri, F., Ntoumi, F. & Mercereau-Puijalon, 0. (1995). PCR typing of field isolates of Plasmodium falciparum. Journal of Clinical Micro- biology, 33, 944-95 1.
Contamin, H., Fandeur, T., Rogier, C., Bonnefoy, S., Trape, J.-F. & Mercereau-Puijalon, 0. (1996). Different genetic characteristics of Plasmodium falciparum isolates collected during successive clinical malaria- episodes in Senegalese children. American Journal of Tropical Medicine and Hygiene,
54,632-643.
Conway, D. J., Roper, C., Oduola, A. M. J., Arnot, D. E., Kremsner, P. G., Grobusch, M. P., Curtis, C. F. & Green- wood, B. M. (1999). Hiah recombination rate in natural populations of Plasmodium falciparum. Proceedings of the National Academy of Sciences of the USA, 96,4506-45 11. Daubersies, P., Sallenave-Saies, S., Magne, S., Trape, J. F.,
Rogier, C., Contamin, H., Fandeur, T., Mercereau-Puijalon, 0. & Druilhe. P. (1996). Raoid turnover of Plasmodium jalciparum populations in’asymptomatic individuals living in a high transmission area. American.cfoumalof Tropical Medicine and Hygiene, 54, 18-26.
Farnert, A., Snounou, G., Rooth, I. & Bjorkman, A. (1997). Daily dynamics of Plasmodium jalciparum subpopulations in asymptomatic children in a holoendemic area. American 3ournal of Tropical Medicine and Hygiene, 56, 538-547. Farnert, A., Arez, A. P., Correia, A. T., Bjorkman, A., Snounou,
G. &do Rosario, V. E. (1999). Sampling and storage ofblood and the detection of malaria parasites by polymerase chain reaction. Transactions of the Royal Society of Tropical Medicine and Hveiene. 93. 50-53.
Felger, I.; Irion, A., Steiger, S. & Beck, H.-P. (1999). The epidemiology of multiple Plasmodium falciparum infections. 2. Genotypes of merozone surface protein 2 of Plasmodium jalciparum in Tanzania. Transactions of the Royal Society of
Tropical Medicine and Hygiene, 93, supplement 1, Sl133Sl19. Fleiss, J. F. (1986). The Design and Analysis of Clinical Experi-
ments. New York: John Wiley & Sons Inc.
Haddad, D., Snounou, G., Mattei, D., Enamorado, I. G., Figueroa, J., Stahl, S. & Berzins, K. (1999). Limited genetic diversity of Plasmodium jalciparum in field isolates from Honduras. AmericanJournal of Tropical Medicine and Hygiene,
60,30-34.
Henning, L., Felger, I. & Beck, H.-P. (1999). Rapid DNA extraction for molecular epidemiological studies of malaria. Acta Tropica, 12, 149-155.
Hill. W. G. & Babiker. H. A. (1995). Estimation of number of malaria clones in blood samples. Proceedings of the Royal Society oflondon, B, 262,249-257.
Kimura, E., Mattei, D., di Santi, S. M. & Scherf, A. (1990). Genetic diversityin the major merozoite surface antigen of Plasmodium jalciparum: high prevalence of a third poly- morphic form detected in strains derived from malaria pa- tients. Gene, 91, 57-62.
Konate, L., Zwetyenga, J., Rogier, C., Bishoff, E., Fontenille, D., Tall, A., Spiegel, A., Trape, J.-F. & Mercereau-Puijalon, 0. (1999). The epidemiology of multiple Plasmodium falci- parum infections. 5. Variation of Plasmodium jalciparum mspl block2 and msp2 allele prevalence and of infection complexity in two neighbouring Senegalese villages with different trans- mission conditions. Transactions of the Royal Society of Tropical Medicine and Hygiene, 93, supplement 1, SI121-S1/28. Kyes, S., Craig, A. G., Marsh, K. & Newbold, C. I. (1993).
Plasmodium jalciparum: a method for the amplification of S antigens and its application to laboratory and field samples. Experimental Parasitology, 71,473-483.
Kyes, S., Harding, R., Black, G., Craig, A., Peshu, N., New- bold, C. & Marsh, K. (1997). Limited spatial clustering of individual Plasmodium falciparum alleles in field isolates from coastal Kenya. American Journal of Tropical Medicine and Hwiene. 51. 205-215.
Ntoumi, F., Contamin, H., Rogier, C., Bonnefoy, S., Trape, J.-F. & Mercereau-Puijalon, 0. (1995). Age-dependent car- riaae of multiule Plasmodium falciparum merozoite surface a&gen-2 genotypes in asymptomatic malaria infections. AmericanJournal of Tropical Medicine and Hygiene, 52,8 l-88. Paul, R. E. L., Packer, M. J., Walmsley, M., Lagog, M.,
Ranford-Cartwright, L. C., Paru, R. & Day, K. (1995). Mating patterns in malaria parasite populations of Papua New Guinea. Science, 269, 1709-1711.
Paul, R. E. L., Hackford, I., Brockman. A., Muller-Graf, C., Price. R., Luxemburaer. C.. White, N. T., Nosten, F. & Dav, K. P,. (1998). Transmission intensity and Plasmodium jalci: parum diversity on the northwestern border of Thailand. American Journal of Tropical Medicine and Hygiene, 58,
195-203.
Plowe. C. V.. Diimde. A.. Bouare. M.. Doumbo. 0. St Wellems. T. E. (1995): Pyrimethamine and proguanil;esistance-con: ferring mutations in Plasmodium jalcipamm dihydrofolate reductase: polymerase chain reaction methods for surveil- lance in Africa. American Journal of Tropical Medicine and Hygiene, 52,565-568.
Ranford-Cartwright, L. C, Balfe, P., Carter, R. & Walliker, D. ( 199 1). Genetic hvbrids of Plasmodium falciparum identified by amplification of genomic DNA from’ single oocysts. Molecular and Biochemical Parasitology, 49, 239-244. Ranford-Cartwright, L. C., Balfe, P., Carter, R. & Walliker, D.
(1993). Frequency of cross fertilisation in the human malaria parasite Plasmodium jalciparum. Parasitology, 107, 1 l- 18. Robert, F., Ntoumi, F., Angel, G., Candito, D., Rogier, C.,
Fandeur, T., Sarthou, J. L. &Mercereau-Puijalon, 0. (1996). Extensive genetic diversity of Plasmodium falciparum isolates collected from uatients with severe malaria in Dakar. Seneeal. Transactions oj the Royal Society of Tropical Medicine &td Hygiene, 90,704-711.
Rubio, J. M., Benito, A., Roche P. J, Berzosa M. L., Garcia, M. L.. Mica M.. Edti. M. & Alvar 1. (1999). Semi-nested. multiplex polymerase chain reaction for detection of human malaria parasites and evidence of Plasmodium vivax infection in Equatorial Guinea. American Journal of Tropical Medicine andHwiene. 60. 183-187.
Siegel, s’.“& Castellan, N. J. (1988). Nonparametric Statistics for Behavioral Sciences, 2nd edition. New York McGraw Hill. International Edition.
Smythe, J. A.,Peterson, M. G., Coppel, R. L., Saul, A. J., Kemp, D. J. & Anders, R. F. (1990). Structural diversity in the 45- kilodalton merozoite surface antigen of Plasmodium falcipar- urn. Molecular and Biochemical Parasitology, 39, 227-234. Snewin, V. A., Herrera, M., Sanchez, G., Scherf, A., Langsley,
G. & Herrera, S. (1991). Polymorphism of alleles of the merozoite surface antigens MSAl and MSA2 in Plasmodium falciparum wild isolates from Colombia. Molecular and Bio-
chemical Parasitology, 49,265276.
Snounou, G., Viriyakosol, S., Jarra, W., Thaithong, S. &Brown, K. N. (1993). Identification of the four human parasite species in field samples by the polymerase chain reaction and detection of a high prevalence of mixed infections. Molecular and Biochemical Parasitology, 58, 283-292.
232 A. FARNERT ETAL.
Snounou, G., Zhu, X,., Siripoon, N., Jarra, W., Thaithong, S., Brown, K. N. & Vmyakosol, S. (1999). Biased distribution of mspl and msp2 allelic variants in Plasmodium falcipantm populations in Thailand. Transactions of the Royal Society of
Tropical Medicine and Hygiene, 93,369-374.
Viriyakosol, S., Siripoon, N., Ping Zhu, X., Jarra, W., Seugom, A., Brown, K. N. & Snounou, G. (1994). Plasmodium falciparum: selective growth of subpopulations from field
samples following in vitro cultures as detected by polymerase chain reaction, Experimental Parasitology, 79, 5 17-525.
Zwetyenga, J., Rogier, C.,Tall, A., Fontenille, D., Snounou, G., Trape, J.-F. & Mercereau-Puijalon, 0. (1998). No influence of age on infection complexity and allelic distribution in Plasmodium falciparum infections in Ndiop, a Senegalese village with seasonal, mesoendemic malaria. AmericanJournal of Tropical Medicine and Hygiene, 59, 726-735.
Received 7 Februa y 2000; revised 31 July 2000; acceptedfor publication 2 August 2000
Announcements
ROYAL SOCIETY OF TROPICAL MEDICINE AND HYGIENE
The Transactions
The Transactions of the Royal Society of Tropical Medicine and Hygiene is issued bi-monthly (six parts per year) and publishes not only papers presented at Society meetings and symposia but also papers and correspondence submitted by Fellows and non-Fellows from all over the world on every aspect of tropical medicine and international health. Supplements on specialist topics are published from time to time.
The annual subscription payable by Fellows is E60.00 which becomes due in advance on the first of April each year. Subscriptions may be taken out for a period of five years at five times the current fee. Applications for Fellowship must be made on the correct form, obtainable from the address below. There is a reduced subscription of &Z.OO for bonafide students which is limited to three years.
The Transactions may be purchased by those other than Fellows of the Society, at E26.00 per issue; E155.00 per volume. It is dispatched by accelerated surface mail (air freight) at no extra charge.
Further information and application forms for Fellowship can be obtained from:
The Honorary Secretaries
Royal Society of Tropical Medicine and Hygiene Manson House 26 Portland Place London, WlB lEY, UK Telephone +44 (0)20 7580 2127 Fax +44 (0)20 7436 1389 e-mail [email protected]
Subscription orders from libraries and non-Fellows should be sent to:
Royal Society of Tropical Medicine and Hygiene Subscription Department
Robquest Ltd, Triumvirate House Millbank Road Kingsnorth, Ashford Kent, TN23 3JD, UK Telephone +44 (0) 1233 6 11299 Fax +44 (0) 1233 639423 e-mail [email protected]
ROYAL SOCIETY OF TROPICAL MEDICINE AND HYGIENE
President’s Fund
The aim of the fund is to sponsor prospective Fellows from developing countries, who are at present unable to join because their country’s fiscal rules prevent them from paying the subscription.
The fund, known as The President’s Fundfor Overseas Fellows in Developing Countries, is used to sponsor deserving candidates for full Fellowship of the Society, initially for a period of three years.
The Society relies on donations from Fellows.
Any Fellow willing to donate to the President’s Fund in order to help sponsor a deserving Fellow from a developing country is asked to write to Manson House.