Supporting Information 1
2
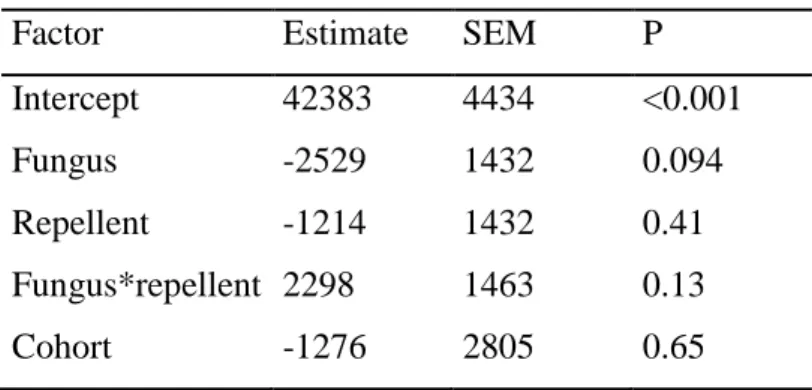
Table S1 Coefficients, standard errors of the mean, and P-values of the fitted linear models 3
on wireworm tunnelling in no-choice treatment combinations (0_0, R_R, F_F, RF_RF; see 4
Figure 2 for explanation) and the untreated control (0_0). Pixel counts per live wireworm 5
were used as dependent variable to account for the effect of wireworm mortality on 6
tunnelling activity within the 1st week 7
Factor Estimate SEM P
Intercept 42383 4434 <0.001
Fungus -2529 1432 0.094
Repellent -1214 1432 0.41
Fungus*repellent 2298 1463 0.13
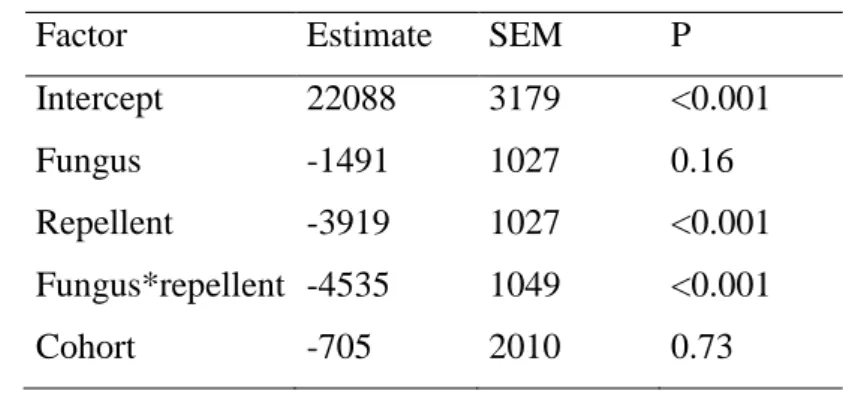
Table S2 Coefficients, standard errors of the mean, and P-values of the fitted alternative 1
linear models on wireworm tunnelling in choice treatment combinations (R_F, 0_F, R_0; see 2
Figure 2 for explanation) and the untreated control (0_0). Pixel counts per live wireworm 3
were used as dependent variable to account for the effect of wireworm mortality on 4
tunnelling activity in the 1st week 5
Factor Estimate SEM P
Intercept 22088 3179 <0.001 Fungus -1491 1027 0.16 Repellent -3919 1027 <0.001 Fungus*repellent -4535 1049 <0.001 Cohort -705 2010 0.73 6 7