The Crossed Projection to the Striatum in Two Species of
Monkey and in Humans: Behavioral and Evolutionary
Signi
ficance
Giorgio M. Innocenti
1,2
, Tim B. Dyrby
3,4
, Kasper Winther Andersen
3
,
Eric M. Rouiller
5
and Roberto Caminiti
6,7
1
Department of Neuroscience, Karolinska Institutet, Stockholm, Sweden,
2Brain and Mind Institute, EPFL,
Lausanne, Switzerland,
3Danish Research Centre for Magnetic Resonance, Centre for Functional and Diagnostic
Imaging and Research, Copenhagen University Hospital Hvidovre, Copenhagen, Denmark,
4Department of
Applied Mathematics and Computer Science, Technical University of Denmark, Kongens Lyngby, Denmark,
5Department of Medicine, Faculty of Sciences, Fribourg Cognition Center, University of Fribourg, Fribourg,
Switzerland,
6Department of Physiology and Pharmacology, University of Rome SAPIENZA, Rome, Italy and
7Department of Anatomy, Histology, Forensic Medicine and Orthopedics, University of Rome SAPIENZA, Rome,
Italy
Address correspondence to Giorgio M. Innocenti, Department of Neuroscience, Karolinska Institutet, Retziusväg 8, 171 77 Stockholm, Sweden. Email: giorgio.innocenti@ki.se
Abstract
The corpus callosum establishes the anatomical continuity between the 2 hemispheres and coordinates their activity. Using histological tracing, single axon reconstructions, and diffusion tractography, we describe a callosal projection to n caudatus and putamen in monkeys and humans. In both species, the origin of this projection is more restricted than that of the ipsilateral projection. In monkeys, it consists of thin axons (0.4–0.6 μm), appropriate for spatial and temporal dispersion of subliminal inputs. For prefrontal cortex, contralateral minus ipsilateral delays to striatum calculated from axon diameters and conduction distance are <2 ms in the monkey and, by extrapolation, <4 ms in humans. This delay corresponds to the performance in Poffenberger’s paradigm, a classical attempt to estimate central conduction delays, with a neuropsychological task. In both species, callosal cortico-striatal projections originate from prefrontal, premotor, and motor areas. In humans, we discovered a new projection originating from superior parietal lobule, supramarginal, and superior temporal gyrus, regions engaged in language processing. This projection crosses in the isthmus the lesion of which was reported to dissociate syntax and prosody. The projection might originate from an overproduction of callosal projections in development, differentially pruned depending on species.
Key words: axons, conduction delays, corpus callosum, diffusion tractography, language
Introduction
The dominant view is that the corpus callosum (CC) consists of commissuralfibers, that is, of axons which interconnect cortical
areas of the 2 hemispheres. At the end of the 19th century, though, a debate raged involving mainly Hamilton, but also Wer-nicke, Muratov, and several others on whether the CC contained decussating axons directed to the external and internal capsule
http://doc.rero.ch
Published in "Cerebral Cortex 27(6): 3217–3230, 2017"
which should be cited to refer to this work.
(Lévy-Valensi 1910). The controversy was mainly based on the identification of degenerating fibers in animals, including cats, dogs, and monkey, and in humans. The work ofLévy-Valensi (1910)in the monkey rejected this view. Accordingly, the behav-ioral or cognitive consequences of lesions of the CC are usually ascribed to the disconnection of cortical areas of the 2 hemi-spheres. This restrictive view of interhemispheric connections is incorrect.Künzle (1975)described a bilateral projection to the striatum following injections of anterogradely transported radio-active leucine and proline in motor cortex (area 4) in Macaca fasci-cularis.Jones et al. (1977), in Saimiri sciureus, described a crossed cortico-striatal projection following injections of the retrograde tracer horse radish peroxidase (HRP) in putamen and the head of n caudatus.McGuire et al. (1991)described, in the rhesus mon-key, a crossed projection to n caudatus and putamen from pre-frontal cortex and the supplementary motor area (SMA). The existence of crossed cortico-striatal projections is well documen-ted in the rodents (Carman et al. 1965;Wilson 1987;Morishima and Kawaguchi 2006;Alloway et al. 2009;Shepherd 2013) but somewhat neglected in primates (Lieu and Subramanian 2012). Given the current enhanced interest in the striatal and cortico-striatal functions (Kress et al. 2013;Smith and Graybiel 2013; Ste-phenson-Jones et al. 2013;Znamenskiy and Zador 2013;Reig and Silberberg 2014) also related to their role in psychosis (Koch et al. 2014;Burguière et al. 2014;Nakamae et al. 2014), we reinvesti-gated the crossed cortico-striatal connections using modern histological tract tracing in the monkey as well as diffusion trac-tography (DT) in monkeys and human. We describe a robust de-cussating callosal projection to the n caudatus and putamen, originating from prefrontal, premotor, and motor areas. Conduc-tion delays generated by this connecConduc-tion might explain the crossed–uncrossed differential delays measured in a behavioral task. Interestingly, in humans, but not in monkeys, this projec-tion seems to originate also from more caudal areas, involved in language.
Materials and Methods
Histology
Animals and Acquisition
Three adult male macaque monkeys (Macaca fascicularis, body weight: 4–6 kg) were used, 2 of them (CC2 and CC3) from the ani-mal facility of the Department of Physiology and Pharmacology of the University of Rome SAPIENZA. The third (M93-80) from the Cognition Center, University of Fribourg, was a male of 4 years of age (4.5 kg body weight). Other connections of thefirst 2 mon-keys were published (Caminiti et al. 2009;Tomasi et al. 2012; In-nocenti et al. 2013) and the methods reported therein. Briefly, surgery was performed by a professional human neurosurgeon under strict sterile conditions. Animals were preanesthetized
with ketamine (10 mg/kg, i.m.) and anesthetized with isoflurane (Abbott) through a constantflow of a mixture of isoflurane/air. During surgery, pain was also prevented through a constant rate infusion (CRI) of fentanyl (6 μg/kg/h). Each animals received three 0.3–0.5 μL injections of BDA MW 10 000 (10% in 0.01 M phos-phate buffer) at cortical locations (seeSupplementary Fig. 1) through a 5μL Hamilton microsyringe (# 85) with a sharp needle (P/N: 7803-05/00). After 17 days of survival, the monkeys were deeply anesthetized with ketamine (5–10 mg/kg, i.m.) and meto-midine (30μg/kg, i.m) and perfused transcardially with isotonic saline followed by 4% paraformaldehyde in 0.1 M phosphate buf-fered saline (PBS). Animal surgery, pre- and postoperative care were according to Italian (DL.vo 116/92) and European (Directive 86–609; directive 63–210) guidelines for animal experimentation on primates. The brains were postfixed overnight in the same so-lution, cryoprotected by immersion in 30% sucrose in PBS, and sectioned frozen on the coronal plane, except for the CC of the in-jected hemisphere, which was cut sagittally. Section thickness was 34μm. Sections were reacted for BDA, and alternated sec-tions were counterstained with cresyl violet or with the Gallyas method for myelin as inCaminiti et al. (2009).
Data Analysis
All analyses were performed with the Neurolucida 7 software (MBF Biosciences, Williston, VT) and a digital camera-mounted Olympus BX51 microscope. The distribution of axons labeled with BDA was initially charted at ×260 magnification on coronal sections, and the borders of the terminal territories of the axons were traced in consecutive sections. Axon diameters were subsequently measured at ×2900. Axons directed to the n caudatus or to the putamen were sampled at the periphery of the nuclei. Only axonal segments crossing the border of the nu-clei or aimed at this border and terminating within 10μm from the borders were taken. Axons’ profiles were approximated to cir-cles whose size was incremented in 0.09μm steps. The consist-ency of measurement was previously tested by repeated measurements at 1-year interval (Tomasi et al. 2012). No correc-tion for shrinkage was applied to the measurements. Since the same shrinkage should apply to the radial dimension of the axon and to its length, this would not affect the conduction delays estimates (below). Nevertheless if the conduction velocity of the axons should be inferred from these data, correction for the shrinkage should be applied. The shrinkage of the BDA material was previously estimated to be about 30% in the monkey (Innocenti et al. 2013).
Both the linear and the curvilinear distances between the site of injection and those of termination were measured (Tables1
and2). Thefirst (not shown) was the distance between the sec-tion containing the center of injecsec-tion and that containing the bulk of axon terminals. The second was the length of the
Table 1 Diameter, computed conduction velocity, pathway length and delays in projections from cortical areas to contralateral striatum, in monkeys
Origin Termination n Mean diameter Velocity Path from CC μm Path to CC From injection Delay min max
μm m/s μm μm μm ms
Area 9 Caudate 169 0.51 4.0 6863 13 442 20 305 5.1
Premotor F7 Caudate 93 0.54 4.2 7035–8347 12 579 19 614–20 926 4.6 4.9 Premotor F7 Putamen 104 0.52 4.1 11 096–13 039 12 579 23 675–25 618 5.8 6.3 Area 4 Putamen 98 0.43 3.4 11 010–14 855 16 902 27 102–30 947 8.0 9.2 Note: Values uncorrected for shrinkage (∼30%): range of path length depends on more or less distal access to the structures;
delays are calculated from injection sites; and standard deviations of axon diameters are 0.18 (a9 to caudate); 0.3 ( pm to caudate); 0.15 ( pm to putamen); 0.13 (a4 to putamen).
pathway reconstructed with the Neurolucida software from the center of injection (in layers 3–4) to the target, by following the trajectory of the bulk of axons in serial sections. The curvilinear distance was adjusted by stretching the Z values of the histologic-al section back to 34 μm, corresponding to section thickness at cutting. Conduction velocity of the axon was estimated from the formula: Vc= (5.5/g)d [m/s] (Caminiti et al. 2009), with g being the ratio between axoplasm d andfiber diameter d inclusive of the myelin sheath, with g set at 0.7. Conduction delay was es-timated as:δt = L/Vc[μs].
To evaluate statistical differences in axonal diameters and conduction delays, we applied nonparametric statistics (Mann– Whitney test, P < 0.05), since the distribution of samples is not normally distributed.
Diffusion Tractography
Subjects
One perfusion-fixed healthy adult vervet monkey brain (Chloroce-bus sabeus) and 1 macaque (Macaca fascicularis) were used for this study. Thefirst animal was obtained from the Behavioral Science Foundation, St Kitts and was socially housed in enriched envir-onments. The experimental protocol was reviewed and approved by the Institutional Review Board of the Behavioral Science Foun-dation acting under the auspices of the Canadian Council on Animal Care. The second animal was from the Department of Physiology and Pharmacology of the University of Rome SAPIENZA.
Six healthy right-handed young human adults (3 females; age range = 20–27 years) were studied. All participants gave oral and written consent, and the study was approved by the Ethical Com-mittees of the Capital Region of Denmark (H-1-2013-007). MRI Acquisition and Processing
The monkey magnetic resonance (MRI) datasets were acquired with a 4.7 Tesla Agilent MRI scanner using quadrature RF volume coil (Rapid) and maximum gradient strength of 600 mT/m. The setup followed the preparation stages in Dyrby et al. (2011)
where freefixative was washed out to increase T2-relaxation using PBS. The brain was placed in a sealed plastic bag with min-imal PBS surrounding the brain tissue. Before scanning, the brain was stabilized to room temperature, and placed in the middle of the volume coil using a mechanically stable setup. While scan-ning, a conditionedflow of air around the fixed brain ensured constant temperature. A diffusion weighted imaging (DWI) pre-scan of at least 6 h ensured removal of any short-term mechanic instabilities (Dyrby et al. 2011). Single-shell whole-brain DWI was acquired in 0.5 mm isotropic image resolution with a Pulse Gradi-ent Spin Echo (PGSE) sequence and single line read-out. The ac-quisition for both ex vivo monkey brains included a single shell with 128 noncollinear directions obtained from the Camino diffu-sion toolkit (http://cmic.cs.ucl.ac.uk/camino/). Due to different duty cycle limitations, the b value used for the vervet was
7500 s/mm2and for the macaque 6500 s/mm2(delta = 9.5 ms, DELTA = 16 ms, TR = 6500 ms, TE = 35 ms, matrix = 128 × 256) using a gradient strength of 300 and 280 mT/m. Whole-brain coverage was ensured acquiring 86 and 95 axial slices, and with 4 and 2 repeats for the Vervet and Macaque, respectively. Visual inspection of the ex vivo monkey DWI datasets revealed no need for further motion correction between the repeated measure-ments that were averaged offline to increase SNR. The raw ex vivo diffusion MRI dataset of the Vervet monkey brain can be downloaded fromhttp://dig.drcmr.dk.
The in vivo human MRI datasets were acquired with a 3.0 Tesla Philips Achieva scanner using a 32-channel head coil. Sin-gle-shell whole-brain DWI was acquired in 2 mm isotropic image resolution with a PGSE Echo Planar Imaging (EPI) sequence. The shell included 62 noncollinear directions acquired with b value = 3000 s/mm2
(TR = 15 050 ms, TE = 102.73 ms, slices = 66, matrix = 112 × 112). Two datasets each with 5 b = 0 s/mm2were acquired with opposite phase-encoding directions for retrospective sus-ceptibility corrections. A high-resolution T1-weighted image (TR = 6045 ms, TE = 2.71 ms, 0.85 mm isotropic voxels) was acquired for tissue segmentation.
Human DWI datasets were corrected for subject head motion, eddy currents, and susceptibility distortions using FSL’s Topup and Eddy (Andersson et al. 2003;Smith et al. 2004). The correction transformations were applied and images were resliced using 3rd order spline interpolation as implemented in FSL.
Probabilistic Tractography
For probabilistic tractography, the corrected human and ex vivo monkey DWI datasets were processed in similar ways using the MRtrix package (http://www.brain.org.au/software/, version 0.2.12, revision 410) (Smith et al. 2004). Constrained Spherical Deconvolution (CSD) with a maximum harmonic order of 8 was used for voxel-wise estimation of thefiber orientation distribu-tion (FOD). Unidirecdistribu-tional probabilistic FOD-based tractography from a seed ROI was performed using MRtrix’s streamtrack func-tion. Standard parameters were used except that the FOD ampli-tude threshold was 0.05 and minimum curvature radius was 0.5 and 1 mm for monkey and human, respectively. The latter ensured the projection of streamlines initiating within gray mat-ter seed ROIs. For all human experiments, 1 million streamlines were initiated (however, not all streamlines were accepted, see below), and for the monkey experiments, the number of accepted streamlines was set to 5000.
Cortico-striatal projections were obtained by seeding tracto-graphy from delineated putamen and n caudatus ROIs in, respectively, the right and left hemisphere. The seed ROIs n cau-datus and putamen were in the monkey dataset manually drawn on T2-weighted MRI. In the human datasets, they were automat-ically delineated from the T1-weighted MRI using FSL’s FIRST method for segmenting subcortical gray matter structures (Patenaude et al. 2011) (http://fsl.fmrib.ox.ac.uk/fsl/fsl-4.1.9/first/
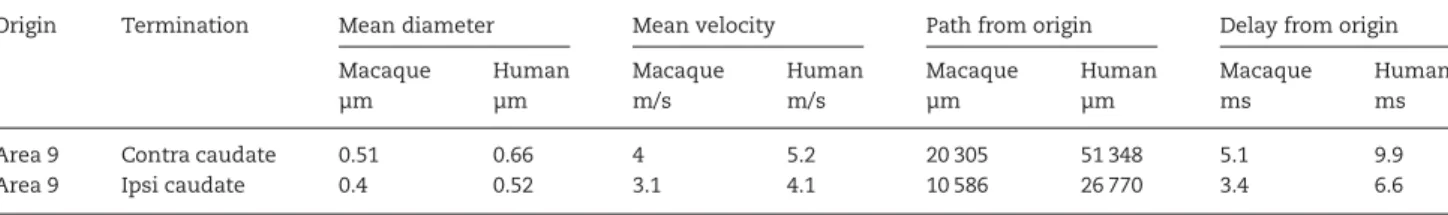
Table 2 Diameter, computed conduction velocity, pathway length and delays in projections from cortical areas to ipsilateral and contralateral striatum in monkeys, adjusted to humans
Origin Termination Mean diameter Mean velocity Path from origin Delay from origin Macaque Human Macaque Human Macaque Human Macaque Human
μm μm m/s m/s μm μm ms ms
Area 9 Contra caudate 0.51 0.66 4 5.2 20 305 51 348 5.1 9.9
Area 9 Ipsi caudate 0.4 0.52 3.1 4.1 10 586 26 770 3.4 6.6
Note: Values uncorrected for shrinkage (∼30%).
index.html). The segmented putamen and n caudatus ROIs were then manually edited to ensure that the ROIs did not include surrounding white matter. The n caudatus and putamen ROIs were then transformed into the subject’s diffusion space by rigidly aligning the T1-weighted image to thefirst corrected b = 0 s/mm2image and applying the transformation to the n caudatus and putamen ROIs.
To constrain tractography to ipsilateral or contralateral corti-co-striatal projections, 3 ROIs were manually drawn on the mid-sagittal slice in the human and the monkey datasets. One ROI included the mid-sagittal corpus callosum (mid-CC), which was used as exclusive or inclusive for obtaining ipsi- or contralateral cortico-striatal projections, respectively. Streamlines reaching exclusive ROIs were eliminated for further analysis, while inclu-sion ROIs are used to ensure that streamlines must pass though this ROI. The second ROI was used as an exclusive ROI and in-cluded the lower part of the mid-sagittal brain from beneath the mid-CC ROI for excluding those streamlines crossing this re-gion. The third ROI included the area from above the mid-CC ROI and was used to stop streamlines from crossing the hemispheres (but still include them in the analysis). Finally, an exclusive ROI covering the brain stem region was manually drawn and used to exclude non-cortico-striatal streamlines. The exclusive ROI included also parts of the fornix, thalamus, and the cingulum bundle in both hemispheres to avoid inclusion of their nonre-lated projections. The ROIs were drawn using Fslview (http://fsl. fmrib.ox.ac.uk/fsl/fslview).
In the human, similar ROIs were drawn, and in addition, right and left cortical gray matter ROIs were used to stop streamlines when reaching cortical gray matter. These mask were generated with FreeSurfer (http://freesurfer.net) using the subjects’ T1-weighted images. In addition, ROIs including the brain stem, thalamus, and lateral ventricles (extracted using FSL’s FIRST as described above) were excluded for further analysis.
Results
Histological Findings in Macaque Monkey
The Callosal Tract to the Contralateral Striatum
Callosal projections to the striatum originate in the case CCT2 from the prefrontal (area 9), premotor (area 6, F7), and primary motor (area 4) cortex (seeSupplementary Fig. 1). In CCT3, they originate from prefrontal cortex at the border between areas 9 and 46 and in ventral premotor cortex area 6 (F4). In this animal area 2 was also injected.
The axons cross the midline in 3 anteroposterior separate bundles reflecting the anteroposterior location of the injections and the corresponding topography of callosal connections docu-mented among others byTomasi et al. 2012(see their Supple-mentary Fig. 2). Each bundle contains both cortico-cortical and cortico-striatal axons (Fig.1). The cortico-striatal axons from area 9 or 9/46 separate from cortico-cortical axons within a few mm from their exit from the CC, on the dorsal aspect of n cauda-tus from where most of them enter this structure, while a few fibers, enter ventrally. The axonal bundles travel on the dorsal as-pect of the n caudatus and extend ventrally, in the external cap-sule, toward the putamen. At each rostro-caudal level, the axons are sparse. Axons from area 6 (F7 or F4) travel as those from area 9, but at more caudal levels. At these levels, the putamen has grown in size, and more axons are directed to this structure. The trajectory of axons from area 4 resembles that from area 6 but an even larger fraction of them reaches the putamen. At all levels, the axons approach the putamen mainly from its lateral aspect although a few axons, interspersed within the termina-tions and hence difficult to follow, might cross from the n cauda-tus to putamen along the bridges of gray matter that connect the 2 structures. The axons from area 2, unlike those from F4, do not reach the striatum; they stream dorsal to the caudo-putamen (seeSupplementary Fig. 2).
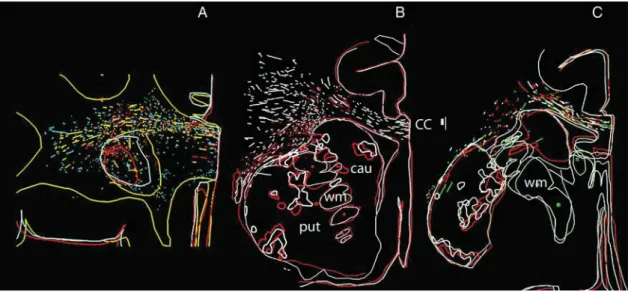
Figure 1. Cortical projections to contralateral striatum in experiment CCT2. Drawings of BDA-labeled projections from contralateral area 9 (A), area 6 (B), and area 4 (C) at rostral (A) to caudal (C) levels in striatum, roughly corresponding to interaural levels 29, 24, and 15 inPaxinos et al. (2000). Each section shows, in the same colors, the outlines of the section, of n caudatus (cau) and putamen ( put), segments of axons exiting the CC (CC) and, with thicker outlines, the bulk of their terminal territories. White matter (wm) spaces between n caudatus and putamen are marked by asterisks. Calibration is 1000 μm. The sequential rostral-to-caudal order of section is in A: red, blue, and yellow; in B: red and white; in C: white, green, and red (all spaced 340 μm apart). Top is up, medial to the right. Calibration is 1000 μm. Notice that the projection separates from the callosal stream of axons within a few millimeter from the midline, on the dorsal aspect of the striatum. The terminal territory at all levels consists of patches aligned dorsomedially to ventrolaterally in a discontinuous“columnar” way from caudate to putamen (core projection) and of patches near the contours of striatum (shell projection).
The Termination of the Interhemispheric Cortico-striatal Projection Most of the axons entering caudo-putamen are sparse andfine. Some of them may be collaterals of axons which continue to ter-minate in the claustrum. Axons terter-minate in the gray matter of both n caudatus and putamen as well as in the bridges of gray matter which connect the 2 across the internal capsule (Fig.2
and below).
The projection (Fig.1) terminates in the n caudatus, anteriorly, and progressively moves more laterally and ventrally at more posterior levels. The pattern of termination differs in the n cau-datus and in putamen. In n caucau-datus, axons terminate in mul-tiple clusters whose peripheries can merge. At more posterior levels, the axons converge into the gray matter bridges which also contain axons coursing between n caudatus and putamen. In putamen, axons terminate in 2 ways, on the dorsal and lateral surface of the nucleus, in patches consisting of thin discrete layers (shell projection), and at more central, locations, (core projection) consisting of multiple clusters. At the most posterior levels, these clusters become dorsomedially to ventrolaterally oriented patchy“columns,” continuous with the gray matter bridges.
Since the axonal trajectories to and within the striatum might be rather complicated, to avoid the possibility that the terminal territories in the experiment CCT2 might have been the result of convergence of axons originating in area 9, 6, and 4, we charted the axonal distribution in the case M93-80 which had received injections in area 4, in the hand representation. The axonal trajectories and distribution of terminal territory correspond well to those illustrated in Figure1C.
Comparison of Interhemispheric and Ipsilateral Projections
The ipsilateral projection to the caudo-putamen (Fig.3) separates from the main axonal bundle originating at the injection where the axons to the CC turn medially. From here, 2 axonal tracts originate. One enters the head of n caudatus dorsally and lateral-ly; the other travels laterally and ventrally, in the external capsule, toward the putamen and claustrum but along its trajec-tory gives rise to a massive projection to the internal capsule. Such a projection is absent in the contralateral hemisphere. Otherwise, the ipsi- and contralateral projections are essentially mirror symmetric. As for the contralateral projection, the axons are thin or very thin (Innocenti et al. 2013).
Cortico-cortical callosal projections often terminate in specif-ic subregions of an area. These include the representation the vertical meridian of the visualfield, that of the body midlines or the representation of parts that cooperate during bimanual ex-ploration, such as thumb, index, and middlefinger of the hand. Similar principles may apply to the crossed cortico-striatal pro-jections. Indeed, the terminal territory of the ipsilateral projec-tion occupies wider porprojec-tions of the n caudatus and putamen (cf. Fig.1B,C with Fig.3A,B) and persist in n caudatus at more cau-dal levels than the contralateral projections (cf. Fig.1C with Fig.3C). Otherwise, the distinctive features of the 2 projections are the same. Namely, the access to the structures is similar. In putamen, the projection consists of a central patchy core and a patchy shell, and the central core of the projection is continuous with that of the n caudatus through the gray matter bridges which interconnect the 2.
Analysis of Individual Axons
Five axons from the bundle of prefrontal cortex origin were re-constructed from serial sections. The reconstructions are ex-tremely time consuming and therefore started near the entrance into the striatum.
Two axons (ax 1; Fig.4A,C, and ax 5, not shown) entered the lateral surface of putamen; the others (ax 2 and 3; Fig.4B,D,E and ax 3, not shown) entered the ventral/lateral aspect of n cau-datus; all had long intrastriatal trajectories. The total arbor of these axons was between 3.5 and 21 mm, the main part of which was due to the long trajectory of the axon within the stri-atum, rather than to the branches. The axons had several fea-tures in common. They distributed a rather simple terminal arbor, but, along their striatal trajectory they projected a number of small branches and carried several swellings, some of which may be passing boutons. This suggests that the projection has a modulatory rather than a powerful driving action on striatal neurons in line with previously proposed concepts (Tettoni et al. 1998).
Diameter of Axons and Conduction Delays
Four hundred sixty-four CC axons were measured at their en-trance into the n caudatus or the putamen (Table1). Of these, 169 axons originated from prefrontal cortex and entered the rostral pole of the n caudatus. Other axons originated from the bundle issued from premotor cortex and entered the n caudatus
Figure 2. Cortical axons terminate in the gray matter bridges between n caudatus and putamen (A) and in the core of n caudatus (B). Calibration bars are 100 μm. Up is to the top, medial to the right.
(93 axons) or the putamen (104). In addition, 98 axons originated from motor cortex and entered the putamen. The axon diameters ranged on average between 0.43 and 0.54 μm with the thinnest axons being in the order of 0.22 μm and the thickest 3.7 μm. No differences were found between the axons originating from pre-frontal cortex and going to n caudatus and those originating from premotor cortex and directed to n caudatus or putamen. Instead, the axons from motor cortex area 4 to the putamen were signifi-cantly thinner (<0.005) than those to the same structure but ori-ginating from premotor cortex (Wilcoxon–Mann Whitney test).
The length of the pathways leading to the different structures ranged between 6863 μm from the CC midline to the caudatus for axons of prefrontal origin and 14 855 μm for axons from motor cortex to the more lateral part of putamen. The total distance from the prefrontal cortex to the contralateral n caudatus can be estimated to be 6863 + 13 442 μm to the callosal midline and that from the motor cortex to the lateral putamen 14 855 + 16 902 μm (Tomasi et al. 2012). The corresponding pathway length for the ipsilateral projections from area 9 to the n caudatus is 10 586 μm (Innocenti et al. 2013; Table2).
The calculated conduction delays in these projections range between 4.6 ms from premotor cortex to n caudatus and 9.2 ms from motor cortex area 4 to the distal entrance in putamen (Table1). To these delays, one should add those generated by in-tranuclear trajectories, which vary across axons.
The ipsilateral and contralateral cortical projections to mon-key striatum are summarized in Figure5where differences be-tween monkey and humans are also mentioned.
It is interesting to compare the computed delays from the in-jection sides to the ipsilateral and contralateral striatum and to extrapolate thefindings to the human brain. In the monkey, the delays from prefrontal cortex are 3.4 ms for the ipsilateral ( Inno-centi et al. 2013) and 5.1 ms for the contralateral projection to n caudatus (this paper). By taking into account an increase in axon diameters in humans in the order of 30% (compatible with
macaque/human comparative data;Caminiti et al. 2009) and of conduction distance proportional to the cubic route of brain volumes, validated by DT tracing (Caminiti et al. 2009,2013) the ipsi- and contra-calculated values in humans are 6.6 and 9.9 ms (Table2). This means an average difference of 3.3 ms between the ipsilateral and the contralateral projection.
Tractography
The Callosal Projection to Contralateral Striatum in Macaque and Vervet Monkeys
Tractography in the 2 ex vivo monkeys was compared with the anatomical results. An attempt to seed the projection from the cerebral cortex produced ambiguous results due to the difficulties in tracking the relatively few axons originating in each area among the other subcortical axonal systems. However, since dif-fusion MRI is bidirectional, projections could be traced from seeds placed into the head of n caudatus and in putamen (below). Projections to the striatum could also be traced from the anterior sectors of the CC (seeSupplementary Fig. 3). Consist-ent with anatomical data, streamlines (defined in Discussion) from the CC reach the n caudatus and then some continue to the putamen which they reach dorsally as well as laterally. Some streamlines proceed from caudatus to putamen along the bridges of gray matter which connect the two.
More informative, because complementary to the histological data, was the tracking from seeds placed in the head of n cauda-tus and in putamen (Fig.6). From both hemispheres, streamlines could be tracked to the cerebral cortex with a prevalence for the prefrontal and premotor cortex for seeds placed in the n caudatus and for the motor cortex for seeds placed in the putamen (Fig.6). Streamlines from the basal ganglia reached all the tracer-injected areas, that is, area 9 and 9/46, F7, F4, and area 4. They were not restricted to these areas; they also reached area 8, the other sub-divisions of premotor cortex (F2 and F5), as well as the cortex in
Figure 3. Cortical projections to ipsilateral striatum in experiment CCT2. Drawings of BDA-labeled projections from ipsilateral area 9 (A), area 6 (B), and area 4 (C) to n caudatus (cau), putamen ( put), and internal capsule (ic) in color-coded sequential sections as in Fig.1. The sequential rostral-to-caudal order of section is A, white, green, and red; in B, green, white, and red; in C, green, red, and white. Sections are spaced 408 μm apart in A and B, 680 μm in C. Levels of section in A and B correspond to B and C in Figure1. C is more caudal, roughly corresponding to interaural level 12 inPaxinos et al. (2000). Top is up, medial to the left. Calibration is 1000 μm. Notice that the terminal territory consists of core and a shell projection as the contralateral projection, but it occupies a wider portion of the striatum and it reaches more rostral levels. A substantial stream of axons enters the internal capsule.
the frontoparietal operculum, hence presumably, areas 3a and, with a few stream lines, the cortex in the superior temporal gyrus. A few streamlines also reach the superior and inferior par-ietal lobules. The highest density of streamlines reaches the pre-motor subdivisions of area 6, and area 8, followed by the prefrontal cortex, the frontoparietal opercula, the motor cortex, andfinally the temporal and parietal areas. These projections were found in both the macaque and the vervet brain, but with some differences. In the vervet, streamlines clearly reach the post central gyrus at locations corresponding to areas 1 and 2 (Fig.6H) while this is less clear in the macaque (Fig.6D). Also, in the vervet, not in the macaque, streamlines reach the location of SMA. Notice, however, that the mean fractional anisotropy (FA)
across mid-sagittal CC, possibly due tofixation and/or tissue quality differences, is slightly lower in macaque (0.57) than in vervet (0.61) which might increase tracking uncertainty in the macaque. Furthermore, since we only used 1 animal per species, we cannot rule out the existence of small within species differences.
As expected from the anatomical and tractography literature, the ipsilateral projections have a broader anteroposterior distribution. In monkey, they extend as far back as the occipital pole (seeSupplementary Fig. 4). They are also denser. We found a general difference of about a factor of 50 in the number of streamlines reaching the ipsilateral versus the contralateral hemisphere.
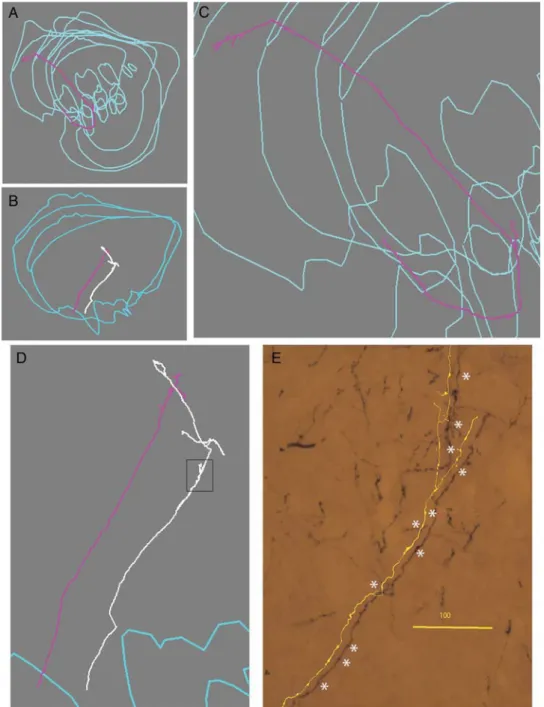
Figure 4. Cortical axons distribute few branches and varicosities over long trajectories in the striatum. Examples of single callosal axons, probably from area 9, to striatum, reconstructed from serial sections. A and B are coronal views of the axons enlarged in C and D. E, photomicrograph and partial reconstruction corresponding to the boxed region of the white axon in D showing small branches and varicosities, some of which might be passing synapses (asterisks). Calibration is 100 μm.
The Callosal Projection to Contralateral Striatum in Humans Contralateral projections to the striatum were tracked in 6 human subjects from seeds in the n caudatus and in putamen, and the projections resemble those in the monkey. Namely the connec-tions were mainly with the prefrontal and frontal areas of the contralateral hemispheres, including the presumptive (Sallet et al. 2013) human equivalent of area 9, premotor area 6 and SMA, and primary motor cortex area 4. No projections crossing in the genu nor the trunk of the CC reached the postcentral gyrus (Fig.6).
In humans, the striatal connections are densest with the pre-central gyrus, hence, presumably with primary motor cortex. Also, projections traveling through the anterior two-thirds of the CC are mainly with areas on the dorsal–lateral convexity of the hemisphere while in the monkey some streamlines extend to the frontal operculum and below to the temporal cortex.
Interestingly, in all the human cases, unlike in the monkey, a projection, mainly to putamen, was also observed, crossing through the isthmus and anterior splenium of the CC (Figs7–9). To challenge the existence of such a contralateral projection, we used the same setup but only included streamlines projecting through isthmus (Fig.8). This visualized a sparse projection em-anating from a rather medial caudo-putamen location that via external capsule follows the inferior frontooccipital fasciculus (IFOF) and separates in the temporal white matter projecting dir-ectly toward the CC. Streamlines connect to the superior parietal lobule, the supramarginal gyrus, the superior temporal gyrus (Figs8and9), all regions engaged in language processing (Discus-sion), as well as to the paracentral lobule and the most dorsal part of the postcentral gyrus, close to the border with the superior parietal lobule (Figs8and9). This projection was found in all humans in both hemispheres.
There are individual differences in the human DT results. The number of streamlines (Fig.10) varies across subjects but within each subject the highest density of streamlines connect to the su-perior and middle frontal gyri particularly in their posterior por-tion, corresponding to premotor cortex, followed by the precentral gyrus and then unexpectedly, the superior parietal and marginal gyri and the inferior frontal gyrus. Fewer
streamlines connect to the superior temporal gyrus and to the postcentral gyrus.
Discussion
The 2 methodologies used in this study, the anterograde transport of BDA and DT, provided new and complementary information along the lines discussed by Jbabdi et al. (2015). The high-resolution tracing with BDA allowed the characterization of the axons involved in the projection and prompted hypotheses on the computations performed by the projections in the temporal domain. The extrapolation of DT data from the monkey to the human brain identified new and important species differences which might be implemented by different developmental trajec-tories adjusted to the emergence of language in humans.
BDA Tracing
The BDA tracing identified the course taken by individual axons from selected cortical sites to and into n caudatus and putamen, and it delineated the terminal territory of the projections. Our re-sults confirm and extend earlier work based on anterograde de-generation methods (Kemp and Powell 1970;Fallon and Ziegler 1979), and anterograde transport of radioactive aminoacids ( Kün-zle 1975;McGuire et al. 1991) in that the contralateral projection reaches both the n caudatus and putamen, where it terminates in a patchy manner. We also see (c.f. Figs1and3) a stronger and more widely distributed ipsilateral than contralateral projection.
The cells of origin of the crossed cortico-striatal projection in areas 8 and 6 (Jones et al. 1977) are small or medium size (on aver-age 14.6 μm in diameter) pyramids, and this is compatible with the small diameter of the descending axons originating in pre-frontal and premotor area in our study (around 0.5 μm) and with the previously reported linear relation between axon and soma diameters in the callosal projection of the monkey (Tomasi et al. 2012). The small diameter of the cortico-striatal projecting neurons in comparison with those of other descending projec-tion was taken to mean that the projecprojec-tion originates from a spe-cific neuronal population and not as collaterals of other descending projections. We have argued along similar lines con-cerning the ipsilateral cortico-striatal projection (Innocenti et al. 2013). In rodents, the situation appears to favor the collateraliza-tion hypothesis although quantitative data seem to be missing. Nevertheless, we cannot exclude that some of thefinest corti-co-striatal axons we have measured might indeed be collateral of other descending projections. These conclusions are on line with a recent review striatal connections (Parent and Parent 2016).
The single axons reconstructed resemble those from motor cortex traced byParent and Parent (2006). The axons show a very circumscribed terminal arbor and distribute both terminal boutons and varicosities which may represent passing synapses over long intrastriatal trajectories. This suggests that the projection has a spatially distributed, modulatory rather than powerfully driving action on striatal neurons in line with previously proposed concepts (Tettoni et al. 1998).
Since BDA tracing allowed to estimate the diameter and length of the axons, the conduction velocities and delays they generate can be calculated (Caminiti et al. 2009;Tomasi et al. 2012;Innocenti et al. 2013). Comparing the delays in the ipsilat-eral versus contralatipsilat-eral cortico-striatal projection might provide an answer to the question:“why a cortico-striatal callosal projec-tion?” also raised byMcGuire et al. (1991).
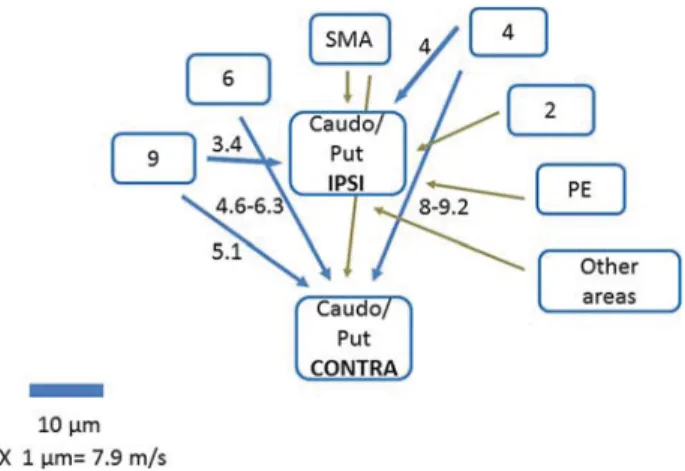
Figure 5. Summary diagram of cortical connections to ipsilateral and contralateral caudo-putamen in the monkey. Areas are denoted according to Brodmann. PE is parietal areas. Blue arrows represent connections studied and measured in this paper and inInnocenti et al. (2013). Brown arrows are from data in the literature (discussion). Thickness of blue arrows is proportional to median axon diameter in the projection; length is proportional to pathway length. Numbers are computed conduction delays in millisecond (text). Notice that a contralateral projection from a 2 cannot be entirely ruled out. In humans, projections from PE (and other areas) were seen with DT (text).
The anterior portion of the striatum, connected with prefront-al and premotor structures, is activated bilaterprefront-ally during the ac-quisition of unilateral motor tasks, while the posterior part, involved in sensorimotor functions, is activated at advanced stages of learning (Lehéricy et al. 2005). The learning and execu-tion of movements might require the temporal coordinaexecu-tion, with minimal delays between the hemispheres that the bilateral projection affords. Numerous studies have measured the delays caused by interhemispheric transmission using the so-called Poffenberger’s paradigm, that is, the latency difference of hand responses to visual stimuli presented to the contralateral versus the ipsilateral hand-controlling hemisphere (reviewed inMarzi
2010). This latency difference has been interpreted as a measure of cortico-cortical transmission delay through the CC. It is im-portant to stress that this paradigm is the only attempt, we know, to assess cortico-cortical delays by a neuropsychological test. One difficulty with the above interpretation is that the con-tra–ipsi latency difference is shorter than the conduction delays between cortical areas of the 2 hemispheres measured electro-physiologically or calculated from anatomical data (Tomasi et al. 2012). The differences in the Poffenberger’s paradigm are in the order of 3–5 ms (but can be as low as 2.65 ms) ( Westerhau-sen et al. 2006;Florio et al. 2013) while the cortico-cortical delay calculated from anatomical data is in the order of 10 ms for the
Figure 6. Cortical projections to contralateral striatum originate from frontal areas in monkeys and in humans. Left panel: DT, ex vivo tracing of contralateral projections in the macaque (left) and vervet (right) monkeys, seeded from n caudatus (red) and putamen (blue) in serial slices from anterior (A,E) to posterior (D,H). From dorsal to ventral, in A and E streamlines to areas 9, 9/46D, 46D, 46 V,9/46 V (and 47L ?). In B,F, streamlines to area 6DR (F7), 8, and 6VR (F5). In C,G, streamlines to rostral most area 4 and to area 3. In D,H, streamlines to areas 1 and 2 in vervet. In B,F,G, a few streamlines reach anterior temporal cortex. Principal sulcus ( ps), superior arcuate (sar), lateralfissure (lf), and central sulcus (cs). According toPaxinos et al. (2000). Right panel: DT in vivo tracing of contralateral projections in a human case (HC02) seeded from n caudatus (red) and putamen (blue) in serial slices from anterior (A) to posterior (D). In A, streamlines mainly from caudate to (anterior) superior frontal gyrus, presumably area 9 (Sallet et al. 2013). In B, streamlines from caudate and putamen to ( posterior) superior frontal gyrus, presumably premotor area PMd (Sallet et al. 2013). In C, streamlines from putamen to paracentral lobule and precentral gyrus, presumably area 4. In D, notice absence of streamlines to postcentral gyrus. Superior frontal sulcus (sfs), intermediate frontal sulcus (imfs), inferior frontal sulcus (ifs), central sulcus (ce), postcentral gyrus (PoG), and postcentral sulcus ( pocs) lateralfissure (lf). Nomenclature according toMai et al. (2008).
prefrontal and motor cortex and of 13 ms for the parietal cortex. These values are in agreement with electrophysiological esti-mates (Tomasi et al. 2012), including an assessment (12.1 ms) of contra–ipsi P100 latency at parietal locations (Westerhausen et al. 2006). On this issue,Marzi (2010)wrote:“This discrepancy has been widely discussed but a parsimonious explanation is that behavioral reaction time by definition represents the ultim-ate event of a process which, on every trial through a horse-race mechanism selects the fastest response. In neurophysiological terms, this means that reaction time reflects the shortest and quickest circuit, presumably made up by large myelinated axons, which subserve the speeded behavioral response.” The present data offer an alternative explanation. The uncrossed
and crossed conditions in Poffenberger’s paradigm probably use the cortico-striatal rather that the cortico-cortical interhemi-spheric route. It is indeed likely that the highly automated response required in that paradigm may be mediated by corti-co-striatal rather than by cortico-cortical routes. The areas strongly activated in the crossed condition of Poffenberger’s paradigm, prefrontal, dorsal premotor, and superior parietal are also those which give raise to crossed cortico-striatal projections in humans (below;Iacoboni and Zaidel 2004).
We have calculated the delays generated in the ipsilateral and contralateral cortico-striatal projection from area 9 in humans by taking into account an increase in axon diameters in the order of 30% (compatible with macaque-human comparative data
Figure 7. Cortical projections to contralateral striatum cross in the isthmus and anterior splenium in humans, not in monkeys. DT in vivo (human cases) and ex vivo (monkeys) tracing of contralateral projections in sagittal views of the CC. In humans, red streamlines are from left caudate and blue streamlines from left putamen. In monkeys, red is from left caudate, yellow from left putamen. Notice the rough topography of the projection in humans, with streamlines from caudate predominantly rostral, and from putamen, caudal; less clear segregation in the monkeys. Notice also that the projections extend to the isthmus of the CC and anterior splenium in humans, not in monkeys.
(Caminiti et al. 2009)) and of conduction distance proportional to the cubic route of brain volumes. The ipsi- and contra-calculated values thus obtained in humans are 6.6 and 9.9 ms (Table2). The difference of 3.3 ms falls exactly within the range of those mea-sured by Poffenberger’s paradigm.
DT Topography
A previous study using retrograde transport in the squirrel mon-key(Jones et al. 1977) identified neurons projecting to the
contra-lateral striatum in the superficial part of layer V, in frontal areas 8, 6, and 4, but the projection stopped in somatosensory areas. This distribution is compatible with what we observed with the ana-tomical tracing.
DT confirmed the trajectory of the tracer labeled axons and the cortical origin of the projections in the monkey, although a few streamlines reach 3a and 3b. With both techniques, wefind evidence of a rough rostro-caudal topography in the striatum
similar to that documented in the ipsilateral projections(Jarbo and Verstynen 2015). As revealed with the tracer, the contralat-eral cortico-strial projections includes a relatively sparse set of axons. The question is how reliably can a sparse set of axons be identified with DT from low-resolution MR images (i.e., isotropic 0.5 mm3voxel). DT identifies brain connections by using math-ematical streamlines that from a seed region draws a connection in steps by following the directionality of voxel-wise maximal anisotropy of water diffusion formed by tissue density, that is, bundles of axons. In contrast to tracers visualizing the full projec-tion of specific axons, DT provides a mathematical representa-tion of brain connectivity where the likelihood for the existence of brain connections traditionally is related to the number of streamlines. However, many challenges exist to obtain reliable DT results in both the data acquisition (e.g., image resolution, b value, number of diffusion encoding directions) and processing steps (e.g., the choice offiber reconstruction model, tracking strategy used, etc.). How to disentangle the false positives that
Figure 8. Abundant projections to contralateral striatum crossing in the isthmus and anterior splenium originate from parietal cortex in humans, not in monkeys. Top panel: DT, in vivo tracing of contralateral projections from left (blue) and right (red) putamen coursing in the posterior corpus callosum in 2 human cases (HC02, left and HC08, right). From dorsal to ventral, in A,D and B,E streamlines to, supramarginal gyrus (SMG), superior parietal lobule (SPL) at the border with postcentral gyrus, and superior temporal gyrus (STG). Nomenclature according toMai et al. (2008). Notice that posteriorly abundant streamlines from putamen, crossing through the isthmus of CC, also reach the superior parietal lobule.
also can appear with high likelihood is a widely recognized chal-lenge (Jones et al. 2013;Jbabdi et al. 2015;Knösche et al. 2015;
Azadbakht et al. 2016). Because of the significantly reduced frac-tion of streamlines in contralateral- compared with ipsilateral
corticostriatal connections, our DTfindings may appear specula-tive. Fortunately, we have shown that diffusion MRI is sensitive to even a small fraction of anisotropic diffusion. Using a similar ex vivo setup, but on the spinal cord of monkey, we demonstrated
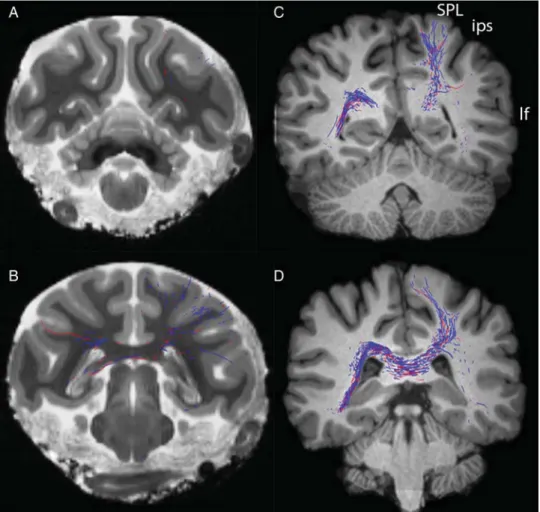
Figure 9. In human (right) but not in macaque (left) streamlines from putamen course through isthmus and splenium of CC to the superior parietal lobule (SPL) and at the border between SPL and postcentral gyrus. Interparietal sulcus (ips), lateralfissure (lf). Nomenclature according toPaxinos et al. (2000);Mai et al. (2008).
Figure 10. Individual variability in the number of streamlines connecting to contralateral striatum in human cases.
that the anisotropic diffusion signal formed by the small fraction of axonal collaterals in the dense white matter could be detected with simple DT(Lundell et al. 2011). Finally, although the fact that tractography produces robust results across subjects do not guar-antee the validity of thefindings (Dyrby et al. 2007), the consist-ency of results obtained with tracing and DT encouraged extending the study to the in vivo human brain.
Three DTfindings point to the existence of possible species differences in the projection, although individual differences cannot be ruled out. First, there appears to be a crossed projection from the contralateral somatosensory areas 1 and 2 in the vervet monkey, not in the macaque. Also, in humans, a projection from the dorsal part of the postcentral gyrus seems to exist at the bor-der with the superior parietal lobule. A crossed projection from somatosensory cortex was described in mice(Reig and Silberberg 2014). Second, in humans, the projection crossing in the genu and trunk of the CC is restricted to the dorsal cortex above the Sylvian sulcus. Not so in the macaque nor in the vervet monkey where some streamlines extended below the Sylvian sulcus and into the temporal cortex.
Third, a far more robustfinding is that in all human cases some axons cross through the isthmus of CC and the anterior portion of the splenium. These streamlines reach the superior parietal lobule, the supramarginal gyrus, and the superior tem-poral gyrus, areas involved in language, including speech pro-duction (for data and references, seeHartwigsen et al. 2010;
Friederici 2011; Geranmayeh et al. 2014; Kamali et al. 2014) while lesion of the isthmus itself cause dissociation of syntax and prosody (Friederici 2011). It is appealing to speculate that this projection might be unique to humans because specifically involved in language. Differences between the human and non-human primates can be expected considering that there are additional human-specific traits (Clowry et al. 2010) and many molecular and cellular differences even between close relatives such as chimpanzees and humans (Geschwind and Rakic 2013). In particular, other connectional differences between the human and the monkey brains are beginning to emerge.Rilling et al. (2008)described an enhanced frontotemporal component of the arcuate fasciculus in humans, possibly related to lan-guage functions.Neggers et al. (2015)described more extensive overlap between eyefield and M1 projections to the striatum in humans than in monkey.
Cortical connectivity, in particular callosal connectivity, is ex-uberant (i.e., more diffuse) in early development (reviewed in In-nocenti and Price 2005), a concept that specifically applies to primates where exuberant projections were described in several structures, notably the corpus callosum (Chalupa and Killackey 1989;LaMantia and Rakic 1990). The existence of differences be-tween monkeys and humans such as those mentioned above seems to indicate that the sculpting out of the initially exuberant, juvenile callosal connections undergoes species-specific regula-tion in development, apparently attuned to the emergence of language.
Supplementary Material
Supplementary material can be found at: http://www.cercor.
oxfordjournals.org/.
Funding
K.W.A. and the human MRI datasets were funded by a project grant from the Lundbeck Foundation (grant nr R48 A4846).
Notes
GMI is grateful to Gilad Silberberg who drew attention to the im-portance of the crossed cortico-striatal projection in rodents. Dedi-cated to the late Edward G Jones (Ted) an immense pioneer in neuroanatomy and to the late Patricia (Pat) Goldman-Rakic, both prematurely lost to the neurosciences. We are grateful to Drs Rob-erta Palmour and Maurice Ptito and the Behavioral Science Foun-dation of St-Kitts (West Indies) for providing the Vervet monkey specimen used in this study. Conflict of Interest: None declared.
References
Alloway KD, Smith JB, Beauchemin KJ, Olson ML. 2009. Bilateral projections from rat MI whisker cortex to the neostriatum, thalamus, and claustrum: forebrain circuits for modulating whisking behavior. J Comp Neurol. 515:548–564.
Andersson JLR, Skare S, Ashburner J. 2003. How to correct suscep-tibility distortions in spin-echo echo-planar images: applica-tion to diffusion tensor imaging. NeuroImage. 20:870–888. Azadbakht H, Parkes LM, Haroon HA, Augath M, Logothetis NK, de
Crespigny A, D’Arceuil HD, Parker GJM. 2016. Validation of high-resolution tractography against in vivo tracing in the Macaque visual cortex. Cereb Cortex. 25:4299–4309.
Burguière E, Monteiro P, Mallet L, Feng G, Graybiel AM. 2014. Stri-atal circuits, habits, and implications for obsessive-compul-sive disorder. Curr Opin Neurobiol. 30:59–65.
Caminiti R, Carducci F, Piervincenzi C, Battaglia-Mayer A, Confalone G, Visco-Comandini F, Pantano P, Innocenti GM. 2013. Diameter, length, speed, and conduction delay of callo-sal axons in macaque monkeys and humans: comparing data from histology and magnetic resonance imaging diffusion Tractography. J Neurosci. 33:14501–14511.
Caminiti R, Ghaziri H, Galuske R, Hof PR, Innocenti GM. 2009. Evo-lution amplified processing with temporally dispersed, slow neuronal connectivity in primates. PNAS. 106:19551–19556. Carman JB, Cowan WM, Powell TP, Webster KE. 1965. A bilateral
cortico-striate projection. J Neurol Neurosurg Psychiatry. 28:71–77.
Chalupa L, Killackey H. 1989. Process elimination underlies ontogen-etic change in the distribution of callosal projection neurons in the postcentral gyrus of the fetal monkey. PNAS. 86:1076–1079. Clowry G, Molnár Z, Rakic P. 2010. Renewed focus on the
develop-ing human neocortex. J Anat. 217:276–288.
Dyrby TB, Baaré WF, Alexander DC, Jelsing J, Garde E, Søgaard LV. 2011. An ex vivo imaging pipeline for producing high-quality and high-resolution diffusion-weighted imaging data sets. Hum Brain Mapp. 32:544–563.
Dyrby TB, Søgaard LV, Parker GJ, Alexander DC, Lind NM, Baaré WFC, Hay-Schmidt A, Eriksen E, Pakkenberg B, Paulson OB, et al. 2007. Validation of in vitro probabilistic trac-tography. NeuroImage. 37:1267–1277.
Fallon JH, Ziegler BTS. 1979. The crossed cortico-caudate projec-tion in the rhesus monkey. Neurosci Lett. 15:29–32.
Florio V, Savazzi S, Conca A, Marzi CS. 2013. Differential impair-ment of interhemispheric transmission in bipolar disease. Exp Brain Res. 230:175–185.
Friederici AD. 2011. The brain basis of language processing: from structure to function. Physiol Rev. 91:1357–1392.
Geranmayeh F, Wise RJS, Metha A, Leech R. 2014. Overlapping networks engaged during spoken language production and its cognitive control. J Neurosci. 34:8728–8740.
Geschwind DH, Rakic P. 2013. Cortical evolution: judge the brain by its cover. Neuron. 80:633–647.
Hartwigsen G, Baumgaertner A, Price CJ, Koehnke M, Ulmer S, Siebner HR. 2010. Phonological decisions require both the left and right supramarginal gyri. PNAS. 107:16494–16499. Iacoboni M, Zaidel E. 2004. Interhemispheric visuo-motor
inte-gration in humans: the role of the superior parietal cortex. Neuropsychologia. 42:419–425.
Innocenti GM, Price DJ. 2005. Exuberance in the development of cortico-cortical networks. Nat Neurosci Rev. 6:955–964. Innocenti GM, Vercelli A, Caminiti R. 2013. The diameter of
cor-tical axons depends both on area of origin and termination. Cereb Cortex. 24:2178–2188.
Jarbo K, Verstynen TD. 2015. Converging structural and function-al connectivity of orbitofrontfunction-al, dorsolaterfunction-al prefrontfunction-al, and posterior parietal cortex in the human striatum. J Neurosci. 35:3865–3878.
Jbabdi S, Sotiropoulos SN, Haber SN, Van Essen DC, Behrens TE. 2015. Measuring macroscopic brain connections in vivo. Nat Neurosci Rev. 18:1546–1555.
Jones DK, Knösche TR, Turner R. 2013. White matter integrity, fiber count, and other fallacies: The do’s and don’ts of diffu-sion MRI. NeuroImage. 73:239–254.
Jones EG, Coulter JD, Burton H, Porter R. 1977. Cells of origin and terminal distribution of corticostriatalfibers arising in the sensory-motor cortex of monkeys. J Comp Neurol. 173:53–80. Kamali A, Sair HL, Radnabesh A, Hasan KA. 2014. Decoding the superior parietal lobule connections of the superior longitu-dinal fasciculus/arcuate fasciculus in the human brain. Neurosci. 277:577–583.
Kemp JM, Powell TPS. 1970. The cortico-striate projection in the monkey. Brain. 93:525–546.
Knösche TR, Anwander A, Liptrot L, Dyrby TB. 2015. Validation of tractography: comparison with manganese tracing. Hum Brain Mapp. 36:4116–4135.
Koch K, Rus OG, Reeß TJ, Schachtzabel C, Wagner G, Schultz CC, Sorg C, Schlösser RG. 2014. Functional connectivity and grey matter volume of the striatum in schizophrenia. Br J Psychiatry. 205:204–213.
Kress GJ, Yamawaki N, Wokosin DL, Wickersham IR,
Shepherd GM, Surmeier DJ. 2013. Convergent cortical innerv-ation of striatal projection neurons. Nat Neurosci. 16:665–667. Künzle H. 1975. Bilateral projections from precentral motor cortex to the putamen and other parts of the basal ganglia. An auto-radiographic study in Macaca fascicularis. Brain Res. 88:195–209. LaMantia AS, Rakic P. 1990. Axon overproduction and elimination in the corpus callosum of the developing rhesus monkey. J Neurosci. 10:2156–2175.
Lehéricy S, Benali H, Van de Moortele PF, Pélégrini-Issac M, Waechter T, Ugurbil K, Doyon J. 2005. Distinct basal ganglia territories are engaged in early and advanced motor sequence learning. PNAS. 102:12566–12571.
Lévy-Valensi J. 1910. Le corps calleux. Paris (France): Steinheil. Lieu CA, Subramanian T. 2012. The interhemispheric
connec-tions of the striatum: implicaconnec-tions for Parkinson’s disease and drug-induced dyskinesias. Brain Res Bull. 87:1–9. Lundell H, Nielsen JB, Ptito M, Dyrby TB. 2011. Distribution of
collateralfibers in the monkey cervical spinal cord detected with diffusion-weighted magnetic resonance imaging. NeuroImage. 56:923–929.
Mai J, Paxinos G, Voss T. 2008. Atlas of the human brain. London (UK): Academic Press/Elsevier.
Marzi CA. 2010. Asymmetry of interhemispheric communication. Wiley Interdiscip Rev Cogn Sci. 1:433–438.
McGuire PK, Bates JF, Golman-Rakic PS. 1991. Interhemispheric in-tegration:II. Symmetry and convergence of the corticostriatal
projections of the left and right prinical sulcus (PS) and the left and right supplementary motor areas (SMA) of the rhesus monkey. Cereb Cortex. 1:408–417.
Morishima M, Kawaguchi Y. 2006. Recurrent connection patterns of corticostriatal pyramidal cells in frontal cortex. J Neurosci. 26:4394–4405.
Nakamae T, Sakai Y, Abe Y, Nishida S, Fukui K, Yamada K, Kubota M, Denys D, Narumoto J. 2014. Altered fronto-striatal fiber topography and connectivity in obsessive-compulsive disorder. PLoS One. 9:e112075.
Neggers SFW, Zandbelt BB, Schall MS, Schall JD. 2015. Compara-tive diffusion tractography of corticostriatal motor pathways reveals differences between humans and macaques. J Neurophysiol. 113:2164–2172.
Parent M, Parent A. 2016. The primate basal ganglia connectome as revealed by single-axon tracing. In: Rockland K, editor. Axons and brain architecture. Amsterdam: Academic Press. p. 27–48.
Parent M, Parent A. 2006. Single-axon tracing study of corticos-triatal projections arising from primary motor cortex in pri-mates. J Comp Neurol. 496:202–213.
Patenaude B, Smith SM, Kennedy D, Jenkinson M. 2011. A Bayes-ian model of shape and appearance for subcortical brain. NeuroImage. 56:907–922.
Paxinos G, Huang XF, Toga AW. 2000. The rhesus monkey brain. London (UK): Academic Press.
Reig R, Silberberg G. 2014. Multisensory integration in the mouse striatum. Neuron. 83:1200–1212.
Rilling JK, Glasser MF, Preuss TM, Ma X, Zhao T, Hu X, Behrens TE. 2008. The evolution of the arcuate fasciculus revealed with comparative DTI. Nat Neurosci. 11:426–428.
Sallet J, Mars RB, Noonan MP, Neubert FX, Jbabdi S, O’Reilly JX, Filippini N, Thomas AG, Rushworth MF. 2013. The organiza-tion of dorsal frontal cortex in humans and in macaques. J Neurosci. 33:1255–1274.
Shepherd GM. 2013. Corticostriatal connectivity and its role in disease. Nat Rev Neurosci. 14:278–291.
Smith KS, Graybiel AM. 2013. A dual operator view of habitual be-havior reflecting cortical and striatal dynamics. Neuron. 79:361–374.
Smith SM, Jenkinson M, Woolrich MW, Beckmann CF, Behrens TE, Johansen-Berg H, Bannister PR, De Luca M, Drobnjak I, Flitney DE, et al. 2004. Advances in functional and structural MR image analysis and implementation as FSL. NeuroImage. 23:208–219.
Stephenson-Jones M, Kardamakis AA, Robertson B, Grillner S. 2013. Independent circuits in the basal ganglia for the evalu-ation and selection of actions. Proc Natl Acad Sci USA. 110: E3670–E3679.
Tettoni L, Gheorghita-Baechler F, Bressoud R, Welker E, Innocenti GM. 1998. Constant and variable aspects of axonal phenotype in cerebral cortex. Cereb Cortex. 8:543–552. Tomasi S, Caminiti R, Innocenti GM. 2012. Areal differences in
diameter and length of corticofugal projections. Cereb Cortex. 22:1463–1472.
Westerhausen R, Kreuder F, Woerner W, Huster RJ, Smit CM, Schweiger E, Wittling W. 2006. Interhemispheric transfer time and structural properties of the corpus callosum. Neurosci Lett. 409:140–145.
Wilson CJ. 1987. Morphology and synaptic connections of crossed corticostriatal neurons in the rat. J Comp Neurol. 263:567–580. Znamenskiy P, Zador AM. 2013. Corticostriatal neurons in audi-tory cortex drive decisions during audiaudi-tory discrimination. Nature. 497:482–485.