Belgium, Canada and Switzerland: Are There
Differences in the Contributions of Selected Variables
on Self-Reported Property-Related
and Violent Delinquency?
Nicole Egli&Nicole Vettenburg&Josée Savoie&
Sonia Lucia&Claire Gavray&Klarka Zeman
Published online: 8 June 2010
# Springer Science+Business Media B.V. 2010
Abstract Three countries with different sociodemographic characteristics and different school and criminal justice systems are compared using data from Belgium, Switzerland, and Canada with respect to juvenile delinquency as measured by the International Self-Reported Delinquency questionnaire (ISRD-2). Following a brief presentation of descriptive statistics of the different samples, multivariate analyses including basic variables such as gender, age, family composition, immigrant status, school attachment, victim-isation, and family and peer relationships make up the core of this study. The contributions
DOI 10.1007/s10610-010-9126-7
Canada refers to the city of Toronto. To facilitate the reading we use country.
In Switzerland, this research was supported by a grant from the Swiss National Science Foundation (FNS no. 100015-116554)
N. Egli (*)
:
S. LuciaSchool of Criminal Sciences, University of Lausanne, Bâtiment Batochime 1015, Lausanne-Dorigny, Switzerland
e-mail: [email protected] N. Vettenburg
Department of Social Welfare Studies, University of Ghent, Henri Dunantlaan 2, 9000 Gent, Belgium e-mail: [email protected]
J. Savoie
National Crime Prevention Centre, NCPC National Office, 269 Laurier Avenue, West, Ottawa, ON K1A 0P8, Canada
C. Gavray
Département de Personne et Société, Bât. 33 Psycho. de La Délinquance Et Du Développement Psychosocial, University of Liège, Boulevard Du Rectorat 3, 4000 Liège 1, Belgium
K. Zeman
Centre for Education Statistics, Statistics Canada, 150 Tunney’s Pasture Driveway, Ottawa, ON K1A 0T6, Canada
of these selected variables are then compared between the participating countries. Between these three countries we find similarities and differences in explaining self-reported property-related and violent delinquency. In the final part of the article, the implications of these findings are discussed.
Keywords Cross-national comparison . Juvenile delinquency . Property offences . Violent offences
Introduction
Scientific endeavour is in constant evolution. It depends on questioning and fears that emerge in the population, political choices of the moment, scientific and technological progress, and sensitivities and scientific discipline of the researcher. The need for a comprehensive comparative analysis of juvenile delinquency on an international level was felt quite early. This is why the first International Self-Report Delinquency study (ISRD-1) was launched in 1992 by the Research and Documentation Centre of the Dutch Ministry of Justice (WODC). The study was based on self-report delinquency data collected in 13 countries, most of which are EU Member States (Junger-Tas et al.1994,2003). The ISRD questionnaire was conceived in a collegial fashion on the basis of the different theoretical and empirical elements from both the Anglo-Saxon and French-speaking approaches to juvenile delinquency (Junger-Tas et al.1994,2003; ). The ISRD-1 variables with theoretical significance were primarily drawn from the social bonding theory (Hirschi2002) and took into consideration parents, school, friends, aspirations and leisure activities. The choice of these measurements conditioned the analyses considered necessary in the beginning when data were available. In 2003, the idea of repeating the study and starting a series of such surveys emerged. Thirty-one countries participated in ISRD-2. The survey was carried out in 2006 using a standardised questionnaire (Junger-Tas et al.2009).
Studies concerning juvenile delinquency have classically focused either on individual characteristics or on context, and most importantly on the principal places of socialisation (Born & Thys2001; Galand et al.2004; Pellegrini et al.1999). Nevertheless, in the context of ISRD-2, new indicators have been used in relation to psychological (Blatier 2002; Le Blanc & Morizot2001), sociological (Filleule2001) and integrative (Vettenburg et al.2008; Wikström and Farrington 2005) theories. The main focus is therefore on self-esteem capacities and attitudes of youths, with respect, for example, to violence (Enzmann & Wetzels2003).
One theory that focuses on the interaction between individual characteristics and context is the situational action theory (Wikström and Farrington2005). In this theory, offending is not about certain kinds of individuals or certain kinds of settings but it is about“kinds of individuals in kinds of settings” (Wikström and McCord2004, p. 19). According to this theory, lifestyles of adolescents are to be considered as important indicators, since the lifestyle led by adolescents influences exposure to different types of settings, which in turn produces different types of situations (Wikström and Sampson2003).
Between ISRD-1 and ISRD-2, the desire to assess the impact of variables related to size, social and demographic characteristics of the city or region of residence has emerged. Each country is, for example, touched in some way by important migration movements, over which it has only a limited amount of control (Mucchielli2003). The question of gender has emerged as well. Whereas initial studies focused chiefly on delinquency of boys (Loeber & Dishion1983), those that followed started to compare the nature and seriousness
of acts committed by both boys and girls. Some authors did not consider the possibility of parallels between female and male delinquent behaviour during adolescence, and the debate as to whether the differences observed are innate or acquired continues (Gavray2009).
ISRD research proves to be an interesting tool to compare delinquency trends between countries. The approach followed here applies to Belgium, Canada (Toronto) and Switzerland. This choice was motivated by an article written by Smit et al. (2008) titled “An Empirical Approach to Country Clustering” that shows interesting similarities via a cluster analysis. The suggested country clustering is supported both empirically and conceptually. The so-called North-West country cluster is, for example, characterised by a strong sense of insecurity and a low level of satisfaction with the police and a low level of homicides and high proportions of juvenile and female offenders. Moreover, in these three countries, a significant part of the population is of French culture and language; it is to be noted, however, that this segment of the population is a minority in all three countries. Nevertheless, each country and each sample has its own characteristics.
The three selected countries were compared with respect to the prevalence of delinquency and links between delinquency and standardised independent variables pertaining to general demographic description, family, school, lifestyle and substance consumption. The comparative analysis of these samples is expected to result in a novel view on differences such as those presented here: for example, whether or not a migrant background has an influence on deviant behaviour can reasonably be expected to be linked to the percentage of migrants present. Here, three samples from countries or cities with very different proportions of immigrants are compared and may therefore be expected to give indications with respect to such a relationship. The global parallels between the three countries are quite important: the per capita gross domestic product (GDP) [as published in the Central Intelligence Agency (CIA) Factbook 2006] are of 31,400 euros for Belgium, 34,000 for Canada and 32,300 for Switzerland and therefore similar in comparison with the differences observed internationally. The same is true with respect to the Gini indexes as of 2000 that are 33.0 for Belgium, 33.7 for Switzerland and 32.6 for Canada (Watkins et al. 2006). The percentage of single-parent families is 16% in Belgium, 15.2% in Switzerland, and 19.7% in Toronto (in Canada, it is 15.6%). Differences between countries are visible for immigration statistics: 8.4% in Belgium, 49% in Toronto and 20.6% in Switzerland. So, whereas the general social situation is rather similar in all three countries, there are some differences. There are more single-parent families in Toronto than in Switzerland and Belgium, as well as a larger proportion of immigrants. There is also a difference in the proportion of immigrants living in Belgium and living in Switzerland. Of course, the one major difference is due to the sample; whereas in all samples school classes were sampled, they were chosen as a national sample in Switzerland, a city sample in Belgium and only from Toronto in Canada.
Two types of delinquent behaviour are analysed: the variable“property-related offences” measures whether or not youths reported committing at least one property-related delinquent act in the 12 months prior to the survey. Behaviours considered to be property-related delinquent acts are vandalism, shoplifting, burglary, bicycle theft, car theft, motorbike theft and stealing from a car. The variable“violent offences” measures whether or not youths reported committing at least one violent delinquent act in the 12 months prior to the survey. Acts included in violent delinquent behaviours are bag-snatching, carrying a weapon, group fights, robbery and assault.
In this article, we examine the similarities and differences between the three selected countries. The goal of the study was to determine whether the factors associated with delinquency vary from one country to another. This study will help us better understand
teenagers’ delinquent trajectories with regard to what is specific to a country or what they have in common between countries. This, in turn, will allow the development of more effective strategies in delinquency prevention.
Sample Characteristics
The Belgian Sample
In Belgium, four cities—two in Wallonia and two in Flanders—with quite similar character-istics were chosen. Two of the selected cities were medium-sized (Gent and Liege, approximately 200,000 inhabitants each) and two were small (Aalst and Verviers, around 60,000 inhabitants each). The school systems are very similar in the Flemish and the Walloon regions because they were set up before the skills and training teaching goals were regionalised (1980). There are no private schools, but school organisation boards may differ. Secondary education consists of 6 years, divided into three cycles of 2 years each. Starting the second cycle of secondary education, students continue in General Secondary Education (GSE), or they change to Technical Secondary Education (TSE) or Vocational Secondary Education (VSE) in which students follow courses that prepare them for a specific occupation.
Within the framework of this survey, we surveyed both male and female students attending the 7th, 8th and 9th year of schooling according to the international code. The paper version was chosen for the questionnaires because most schools did not have sufficient technical possibilities to do otherwise. Regarding sample selection, all secondary schools located within the four cities received a letter and a phone call, which informed them about the survey and asked them to participate; 46.3% agreed to participate. A random sample of one to three classes was taken from each participating school. The number of classes in each school sample depended on the number of study years offered by that school. Beyond this point, on the basis of available data such as number of classes, type, grade and number of students in each class, the Belgian team completed the sample randomly and tried to avoid having missing class profiles. We strived to get a very close view of the global school population based on school year and education type (seven categories). In all, we visited 148 classes.1 A letter was also sent to the students’ parents informing them about the survey (passive consent), and we received 38 refusals. The Belgian database comprises 2,247 completed questionnaires.2 The sampling and the methodology are described elsewhere (Vettenburg et al.2010) .
The Canadian Sample
In Canada, the ISDR was conducted with the collaboration of the Toronto District School Board and certain private schools. The target population consisted of students in years 7, 8 and 9 attending schools in the Toronto census subdivision.
Sampling was carried out according to a stratified cluster sampling frame. Schools were first stratified by grade and geographic area, and a sample of schools was selected
1It is to be noted that, with regard to the Belgian schooling system, it can be extremely difficult to calculate
the exact number of students per class because each class is made up of a number of students who coincidently follow the same course but who may actually be part of different curricula. As a result, the number of students in each class may vary considerably and/or be a form of administrative grouping.
2
In reality, the questionnaire was administered to 2,249 students, but on two questionnaires the gender of the respondent was not indicated.
systematically in each stratum with probability proportional to size, where the size measure was determined by the number of students in the grade. This strategy aimed at providing an adequate representation of the various neighbourhoods in Toronto and therefore of the city’s demographic and socioeconomic characteristics. Statistics Canada interviewers visited the selected schools to ask for consent from the principal. If consent was granted, the interviewer listed the classes and randomly selected one class in the desired grade. Students in the selected class were given consent forms for their parents to sign (active consent). Only students who presented consent forms signed by their parents were permitted to participate.
In total, 210 classes were selected, five of which were determined to be out-of-scope, meaning that the school did not include the grade for which it was selected. The breakdown of the 205 within-scope classes was as follows: 70 grade 7 classes, 69 grade 8 classes, and 66 grade 9 classes.
Of the 205 within-scope classes, 177 participated, resulting in a class response rate of 86% (89% for grade 7, 84% for grade 8 and 86% for grade 9). Within these classes, a total of 3,290 paper-and-pencil questionnaires were completed from 4,553 listed students, yielding a student response rate of 72% (72% for grade 7, 74% for grade 8 and 70% for grade 9). The overall response rate was 62% (64% for grade 7, 62% for grade 8, and 60% for grade 9). More information about sampling and methodology can be found elsewhere (Savoie2010).
The Swiss Sample
In Switzerland, a representative sample was drawn. A list of all schools was obtained. For practical reasons, only three of nine sparsely populated and rural cantons were selected and oversampled. Therefore, 20 of 26 cantons were included in the national sample. In each canton, the number of schools to be sampled was determined according to canton size. The corresponding number of schools was then sampled for each canton, with sampling probabilities calculated based on the total number of students in the schools. Seventy-two schools were randomly selected according to these criteria, four of which refused to participate, and two of these were substituted with other schools as a consequence of the legitimacy of the reason given for refusing to participate (they participated in a different study in the same year). From each of the participating schools, one class was randomly chosen from each 7th, 8th and 9th grade (if each grade consisted of several class units). All students in the chosen classes were asked to participate.
The survey was carried out using the Computer-Assisted Web Interview method (CAWI) (Lucia et al. 2007). Due to technical problems, 97 interviews were conducted using the paper-and-pencil instrument, and 65 questionnaires were lost. Parents of students from the selected classes were informed about the survey beforehand and asked to inform the school should they not wish their child to participate (passive consent). There were no such refusals. There was a low rate of absentees (6.3%) and overall, 3,648 questionnaires were received (Killias et al.2010).
Final Samples for All Three Countries
Respondents who had missing values for any of the derived variables used in the logistic regression analysis were excluded. This reduced the sample size by 16% in Canada (from approximately 3,290 youths to 2,778 youths). In Switzerland, the sample was also reduced by 16% (from 3,648 to 3,065), whereas in Belgium, the sample was reduced by 20.8% (from 2,247 to 1,779).
Analytical Techniques
Different groups of factors related to youth delinquency (i.e., demographic, family, school, peer, self-control, attitude to violence scores and lifestyle-related factors) were inserted as blocks into separate logistic regression models. Each block comprised a set of relevant variables. A description of the different variables is included in theAppendix. To determine the order of the blocks, the theoretical framework of the situational action theory of Wikström was used (Wikström and Farrington2005). As a result, the lifestyle model has been added to the last block. In this model, the sociodemographic context characteristics have, at most, an indirect impact on the frequency of delinquent behaviour. The final and complete model allows assessment of the blocks’ relative importance in explaining the likelihood of self-reporting youth reporting delinquency. Odds ratios (ORs) were used to assess whether youths with specific characteristics are more or less likely to engage in delinquent behaviour than those in another (reference) group.
Results
The 12 months prevalence rates for violent and property-related delinquent behaviours are shown in Table1. Whereas no comparison between these rates was carried out per se, due to sample differences, one discrepancy is to be noted: whereas in Belgium and Canada delinquent acts involving violence were more frequent than delinquent acts involving property, the same cannot be said for Switzerland, where results show the opposite. The prevalence rates of having committed at least one property-related or violent offence are quite similar between all three countries. Due to the varying sampling strategies, differences between these prevalence rates were not statistically tested for significance.
Property-Related Offences
When sociodemographic covariates are taken into account, gender is significantly linked to property-related offences in all three countries; this correlation is stronger in Belgium and Switzerland than in Canada. Whereas results show that migrant status is not significant in Belgium, it is significant in Switzerland, with an increase in the prevalence of property-related offences for second-generation migrants with respect to natives. In Canada, migrant status is also significantly linked to property-related offences, but negatively: first-generation migrants commit fewer of these offences than natives when sex and age are controlled for. Results also show that age is significant in Belgium and Canada but not in Switzerland; furthermore, the ORs for Canada and Belgium are very similar (Table2).
Table 1 Last-year prevalence of delinquent behaviour (percent)
Belgium Canada Switzerland
Property-related offencesa 12.8 11.4 15.1
Violent offencesb 18.6 13.3 13.4
Property-related or violent offences 24.1 19.0 22.5
a
Vandalism; shoplifting; burglary; bicycle, car or motorbike theft; stealing from a car
b
As expected, demographic characteristics have a strong link with youth delinquency prevalence rates in all three countries, although this relationship differs considerably between these countries with regard to immigration status and age. Results show that when taking into consideration variables included in the demographic block, in Canada, immigrant status negatively influences prevalence rates.
Table3shows the results obtained once the second block of variables, which consists of related variables, has been added. Most importantly, the addition of these family-related variables did not produce much change in the ORs previously obtained; the only change from significance to nonsignificance with the addition of these new variables was observed for migrant status in Switzerland. This variable is no longer significant (although being second generation is still linked significantly to property-related offences) once the family’s structure and quality of the relationship created with parents are taken into account. As predicted, these family-related variables are linked to the rate of property-related offences: a broken home and/or a weak relationship between the youth and his/her parents increase the propensity to commit such delinquent acts. Significance for all three factors is present in both Belgium and Switzerland, whereas in Toronto, the quality of the relationships created between a youth and his/her parents is apparently less important; the relationship between a youth and his/her father is, in this subsample, not significantly linked to property-related offences.
Table 3 Odds ratios of logistic regression for property-related delinquent behaviours on demographic and family-related variables
Belgium Toronto Switzerland
Block 1: demographic
Male 1.93 *** 1.41 ** 1.67 ***
Age 1.40 *** 1.36 *** 1.04
Migrant (ref = native)
First generation 1.23 0.84 1.31 *
Second generation 0.64 0.53 *** 1.06
Block 2: family
Broken home 1.52 ** 2.04 *** 1.33 *
Weak relationship with mother 2.13 ** 1.33 * 2.17 *** Weak relationship with father 2.08 *** 0.97 2.33 *** * p≤0.05, ** p ≤0.01,*** p ≤0.001
Table 2 Odds ratios of logistic regression for property-related delinquent behaviours on demographic indicators
Belgium Toronto Switzerland
Block 1: demographic
Male 1.74 *** 1.35 * 1.57 ***
Age 1.45 *** 1.40 *** 1.06
Migrant (ref = native)
Second generation 1.19 0.84 1.38 **
First generation 0.63 0.49 *** 1.16
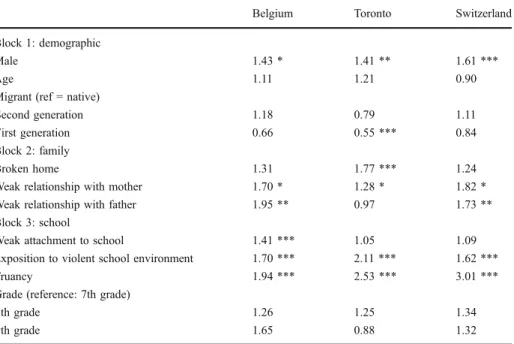
Table 4presents the ORs obtained when the third block of variables was introduced. The third block consists of school-related variables. By inserting these variables, gender becomes less important in Belgium, whereas no great change appears in either Toronto or Switzerland. Age is no longer significant in any of the three samples due to the insertion of grade, which shows correlation with age. Being in the 8th grade with respect to the 7th grade just exceeds the critical value for significance in Switzerland (p = 0.053), but neither in Belgium nor in Toronto. Whether the family is intact or not also loses importance in all three countries: results show that it is no longer significant in Belgium or Switzerland, whereas in Toronto, it conserves its significance and the OR only slightly decreases towards 1. Concerning school-related variables inserted in the model, a weak attachment to school is significant only in Belgium. In both Switzerland and Toronto, this variable is not significant, and the estimator of the OR is also very close to 1, with a confidence interval (CI) of 0.88–1.25; the lack of significance is therefore most probably truly due to the absence of a link between this variable and the dependent variable. Conversely, the school environment is significant in all three countries, and the ORs are very similar. Truancy is also significant in all three countries, although its link to property-related offences is strongest in Switzerland, followed by Toronto and then Belgium.
The fourth block introduced is related to individual variables (Table5). A low level of self-control and a positive attitude to violence increase the risk of committing property-related offences in all three countries.
By introducing these variables, the OR of the gender groups decreases in all three countries and is no longer significant. As positive attitudes towards violence are more common in male youths, this observation is not surprising. Weak relationships between
Table 4 Odds ratios of logistic regression for offences against property on demographic-, family- and school-related variables
Belgium Toronto Switzerland Block 1: demographic
Male 1.43 * 1.41 ** 1.61 ***
Age 1.11 1.21 0.90
Migrant (ref = native)
Second generation 1.18 0.79 1.11
First generation 0.66 0.55 *** 0.84
Block 2: family
Broken home 1.31 1.77 *** 1.24
Weak relationship with mother 1.70 * 1.28 * 1.82 * Weak relationship with father 1.95 ** 0.97 1.73 ** Block 3: school
Weak attachment to school 1.41 *** 1.05 1.09
Exposition to violent school environment 1.70 *** 2.11 *** 1.62 ***
Truancy 1.94 *** 2.53 *** 3.01 ***
Grade (reference: 7th grade)
8th grade 1.26 1.25 1.34
9th grade 1.65 0.88 1.32
youths and their parents also lose importance once these individual variables have been introduced; in particular, a weak relationship between a youth and his/her mother is no longer significant in any of the three counties. Moreover, the OR of truancy continues to decrease in all three countries and becomes insignificant in Belgium. Scores referring to attitudes towards violence and self-control are significantly linked to truancy. Therefore, respondents who show a higher score with regard to their self-control (indicating a low level of self-control) or their attitude towards violence (a higher score indicates a positive attitude towards violence) are more likely to have skipped school. Finally, being a 9th-grade student is now significant in both Belgium and in Switzerland; this was not the case in Table4.
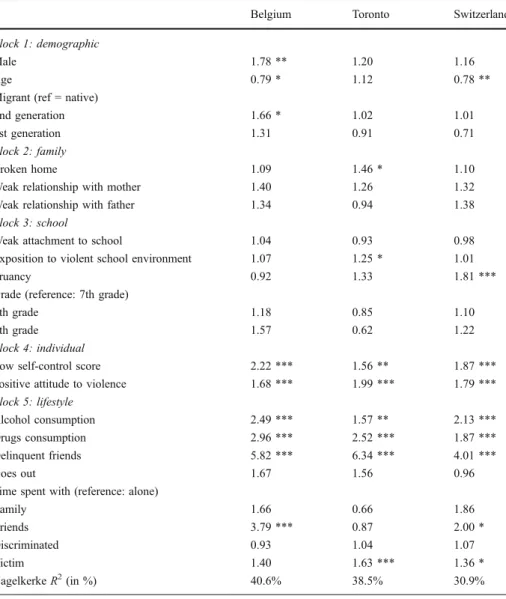
The last block to be included in the model comprises variables concerning lifestyles led by adolescents. These variables highly increase the risk of having committed a property-related offence in all three countries (Table6). Leisure-time activities and attitudes play a paramount role: having experiences with alcohol and/or drugs, and having delinquent friends on one hand; showing low self-control and valorising violence on the other hand, increase the probability of committing a delinquent act. A certain subculture of peer group appears. In Belgium and Switzerland, the impact of the number of hours a youth spent with friends compared with time spent alone is significant. Moreover, going out at night and spending time with the family are not significant in any of the three countries. Finally, having been victimised increases the risk of committing property-related offences in Toronto and in Switzerland.
Table 5 Odds ratios of logistic regression for property-related delinquent behaviours in relation to sociodemographic, family- and school-related and individual variables
Belgium Toronto Switzerland Block 1: demographic
Male 1.27 1.11 1.15
Age 1.02 1.18 0.86
Migrant (ref = native)
2nd generation 1.18 0.78 0.99
1st generation 0.69 0.52 *** 0.61 *
Block 2: family
Broken home 1.30 1.72 *** 1.24
Weak relationship with mother 1.44 1.19 1.52
Weak relationship with father 1.80 * 0.96 1.51 * Block 3: school
Weak attachment to school 1.24 * 0.96 1.00
Exposition to violent school environment 1.24 * 1.58 *** 1.17
Truancy 1.21 1.90 *** 2.27 ***
Grade (reference: 7th grade)
8th grade 1.40 1.26 1.41 *
9th grade 2.34 ** 1.06 1.70 *
Block 4: individual
Low self-control score 3.03 *** 2.04 *** 2.29 *** Positive attitude to violence 1.72 *** 2.19 *** 1.91 *** * p≤ 0.05, ** p ≤ 0.01,*** p ≤ 0.001
A salient change occurs for truancy. In Table 4, this variable is significantly and positively linked to property-related offences in all three countries. It then became influential only in Toronto and Switzerland (Table 5), whereas with the addition of the lifestyle variables, it is significant only in Switzerland. Moreover, the OR of the variable grade decreases in all three countries once lifestyle variables have been added. Also, the introduction of lifestyle variables shows rather surprising results in a significant link between gender and property-related delinquency in Belgium; this variable lost importance once individual variables were added to the model. This effect is not observed in Switzerland and Toronto, where the ORs for gender remain not significant with the addition of lifestyle variables.
Table 6 Odds ratios of logistic regression for property-related delinquent behaviours on sociodemographic, family- and school-related and lifestyle variables as well as individual descriptors
Belgium Toronto Switzerland Block 1: demographic
Male 1.78 ** 1.20 1.16
Age 0.79 * 1.12 0.78 **
Migrant (ref = native)
2nd generation 1.66 * 1.02 1.01
1st generation 1.31 0.91 0.71
Block 2: family
Broken home 1.09 1.46 * 1.10
Weak relationship with mother 1.40 1.26 1.32
Weak relationship with father 1.34 0.94 1.38
Block 3: school
Weak attachment to school 1.04 0.93 0.98
Exposition to violent school environment 1.07 1.25 * 1.01
Truancy 0.92 1.33 1.81 ***
Grade (reference: 7th grade)
8th grade 1.18 0.85 1.10
9th grade 1.57 0.62 1.22
Block 4: individual
Low self-control score 2.22 *** 1.56 ** 1.87 *** Positive attitude to violence 1.68 *** 1.99 *** 1.79 *** Block 5: lifestyle
Alcohol consumption 2.49 *** 1.57 ** 2.13 ***
Drugs consumption 2.96 *** 2.52 *** 1.87 ***
Delinquent friends 5.82 *** 6.34 *** 4.01 ***
Goes out 1.67 1.56 0.96
Time spent with (reference: alone)
Family 1.66 0.66 1.86 Friends 3.79 *** 0.87 2.00 * Discriminated 0.93 1.04 1.07 Victim 1.40 1.63 *** 1.36 * Nagelkerke R2(in %) 40.6% 38.5% 30.9% * p≤ 0.05, ** p ≤ 0.01,*** p ≤ 0.001
The Nagelkerke R2varies between 30% and 40%, showing that this last model fits better in Belgium and Toronto than in Switzerland.
Violent Offences
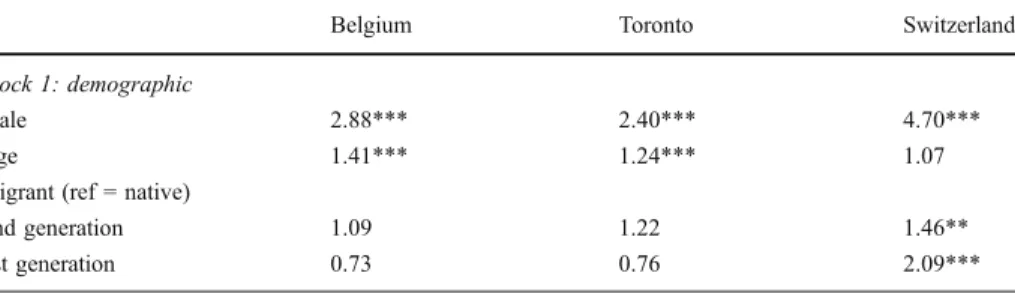
In accordance with the gender theory, gender is significantly linked to the commission of violent offences in all three countries (Table 7), and this link is noticeably stronger for violent offences than what was observed for property-related offences (Table 2). An important difference between the three samples is that the link between migrant status and delinquency is significant only in Switzerland. Being a first- or second-generation migrant is linked to the commission of violent offences when only gender and age are taken into account as other independent variables. In Belgium, a recent study found that adolescents’ tendency to behave violently depends significantly on social origin (i.e. socioeconomic and cultural level of the family) but not on migration (Gavray et al.2009).
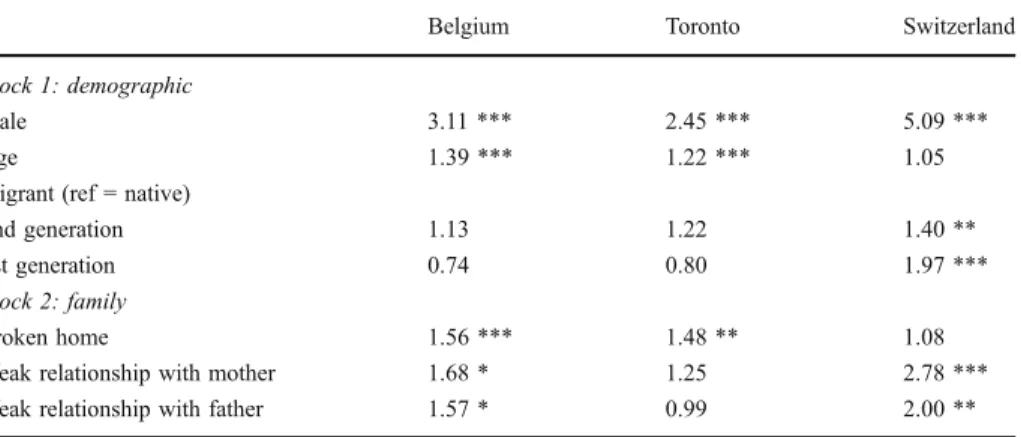
With the addition of family-related variables (Table8), the OR of committing an offence when being a male rather than a female increases in both Belgium and Switzerland; otherwise, the ORs remain stable. The family structure is not significant in Switzerland, but it is in both Belgium and Canada; coming from a broken home is linked to the commission of violent acts. The relationship created between youths and their parents is not significantly linked to violent acts in the Canadian sample, although such a link does exist in both the Swiss and Belgian samples. In Switzerland, the relationship between a youth and his/her mother is particularly important.
Overall, these results echo what has been observed for property-related offences; the addition of family-related variables causes little variation in coefficients obtained for the demographic variables.
The introduction of school-related variables (Table 9) reduces the importance of both demographic and family-related variables. For instance, being male becomes less important, although only in Belgium. In Switzerland, the link becomes insignificant (p=0.094) for second-generation migrants. Family structure was significant in both Belgium and Canada, but this significance is lost once the new school-related variables are introduced. Also, this loss of significance corresponds to a decrease in ORs towards 1; therefore, it is not necessarily only due to an estimation of coefficients from a lower number of cases. With the introduction of these variables the relationship existing between youths and both of their parents also loses significance: in Belgium, the type of relationship existing between a youth and his/her mother and father is no longer significant in the new analysis, whereas in Switzerland the relationship existing between a youth and his/her father is no longer significant.
Table 7 Odds ratios of logistic regression for violent delinquent behaviours on demographic indicators
Belgium Toronto Switzerland
Block 1: demographic
Male 2.88*** 2.40*** 4.70***
Age 1.41*** 1.24*** 1.07
Migrant (ref = native)
2nd generation 1.09 1.22 1.46**
1st generation 0.73 0.76 2.09***
Taking into consideration the new variables, attachment to school is significant (and the estimated ORs are very similar) in both Belgium and Toronto but not in Switzerland. This variable seems to be an important explanatory element of the violent experience but can also be reinforced by this experience. Nevertheless, a weak attachment to school does not necessarily imply the existence of bad relations with the other students or with the professors. In general, boys–especially the most deviant ones–have a utilitarian vision of their interlocutors within the private sphere, although this also applies with regard to school
Table 9 Results of logistic regression for violent delinquent behaviours on sociodemographic, family- and school-related variables
Belgium Toronto Switzerland Block 1: demographic
Male 2.30 *** 2.53 *** 5.08 ***
Age 1.35 *** 1.38 ** 0.94
Migrant (ref = native)
2nd generation 1.01 1.17 1.24
1st generation 0.61 0.83 1.76 **
Block 2: family
Broken home 1.30 1.26 0.99
Weak relationship with mother 1.33 1.20 2.38 ***
Weak relationship with father 1.47 0.98 1.45
Block 3: school
Weak attachment to school 1.28 ** 1.24 ** 1.13 Exposition to violent school environment 1.92 *** 2.26 *** 1.85 ***
Truancy 2.15 *** 2.46 *** 2.24 ***
Grade (reference: 7th grade)
8th grade 0.73 0.82 1.48 *
9th grade 0.64 0.38 *** 1.26
* p≤ 0.05, ** p ≤ 0.01,*** p ≤ 0.001
Table 8 Odds ratios of logistic regression for violent delinquent behaviours on demographic and family-related variables
Belgium Toronto Switzerland
Block 1: demographic
Male 3.11 *** 2.45 *** 5.09 ***
Age 1.39 *** 1.22 *** 1.05
Migrant (ref = native)
2nd generation 1.13 1.22 1.40 **
1st generation 0.74 0.80 1.97 ***
Block 2: family
Broken home 1.56 *** 1.48 ** 1.08
Weak relationship with mother 1.68 * 1.25 2.78 *** Weak relationship with father 1.57 * 0.99 2.00 ** * p≤ 0.05, ** p ≤ 0.01,*** p ≤ 0.001
and/or the neighbourhood (Gavray & Vettenburg 2009). Being in a violent school environment produces a larger OR in Canada than in Switzerland and Belgium; this variable is, however, significant in all three countries. The same is true for the variable concerning truancy. Grade is highly significant in Canada, with the higher grades committing less violent offences than 7th graders; in Switzerland, the variable grade is significant, but with respect to the dummy variables, only the difference between 7th and 8th grades is significant, with 8th-graders committing more delinquent acts than 7th graders.
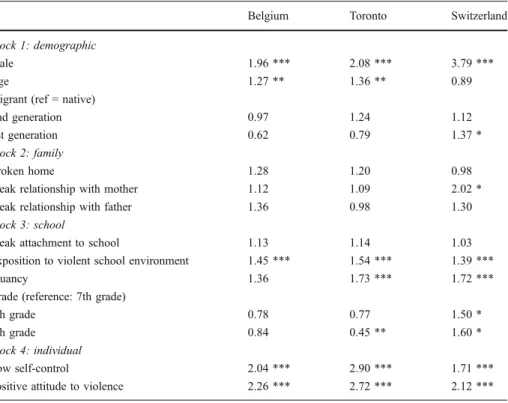
With the addition of individual variables (Table 10), the importance of gender group diminishes in all three countries, the largest decrease being observed in Switzerland. With the addition of individual variables, the variable concerning attachment to school becomes insignificant in all three countries. Truancy becomes less important, although it is still significant in both Toronto and in Switzerland. Moreover, in all three countries, it appears that being in a violent school environment is significant, even though the OR decreased. As was the case for property-related offences, low self-control and a positive attitude to violence increase the risk of committing violent offences.
On introducing lifestyle variables (Table11), the ORs for the gender variable increase again, whereas the ORs for age decrease; age is now significantly and negatively linked to violence in Switzerland and is no longer significant in Toronto. Variables related to the family block are stable. Regarding school-related variables, in all three countries, the ORs tend to decrease once the lifestyle variables have been inserted in the model. However, exposition to a violent school environment remains significant in each country. The ORs of
Table 10 Odds ratios of logistic regression predicting violent offences by demographic, family- and school-related and individual variables
Belgium Toronto Switzerland Block 1: demographic
Male 1.96 *** 2.08 *** 3.79 ***
Age 1.27 ** 1.36 ** 0.89
Migrant (ref = native)
2nd generation 0.97 1.24 1.12
1st generation 0.62 0.79 1.37 *
Block 2: family
Broken home 1.28 1.20 0.98
Weak relationship with mother 1.12 1.09 2.02 *
Weak relationship with father 1.36 0.98 1.30
Block 3: school
Weak attachment to school 1.13 1.14 1.03
Exposition to violent school environment 1.45 *** 1.54 *** 1.39 ***
Truancy 1.36 1.73 *** 1.72 ***
Grade (reference: 7th grade)
8th grade 0.78 0.77 1.50 *
9th grade 0.84 0.45 ** 1.60 *
Block 4: individual
Low self-control 2.04 *** 2.90 *** 1.71 ***
Positive attitude to violence 2.26 *** 2.72 *** 2.12 *** * p≤ 0.05, ** p ≤ 0.01,*** p ≤ 0.001
the self-control variable decrease slightly but remain significant, whereas the weight of attitude towards violence appears to be very high. In fact, the results produced from the completed model are very similar to those obtained in relation to property-related offenses. With regard to the new variables included in this block, alcohol and/or drug consumption and the presence of delinquent friends all significantly increase the risk of commission of a violent offence. Going out at night appears to be significantly linked to violent offences, although only in Belgium. With whom the youth spends his or her time does not show a demonstrable effect in these samples, except in Toronto with reference to youths spending more time with friends compared with those spending more time alone. Finally, having been a victim of discrimination significantly increases the risk of having
Table 11 Odds ratios of logistic regression for violent delinquent behaviours on demographic, family- and school-related, individual descriptors and lifestyle variables
Belgium Toronto Switzerland Block 1: demographic
Male 2.42 *** 2.32 *** 3.98 ***
Age 1.08 1.32 * 0.80 *
Migrant (ref = native)
2nd generation 1.29 1.48 * 1.16
1st generation 0.98 1.13 1.57 *
Block 2: family
Broken home 1.10 1.00 0.86
Weak relationship with mother 1.01 1.16 1.76 *
Weak relationship with father 1.03 0.96 1.09
Block 3: school
Weak attachment to school 1.02 1.15 1.03
Exposition to violent school environment 1.28 * 1.29 * 1.25 *
Truancy 1.16 1.28 1.40 *
Grade (reference: 7th grade)
8th grade 0.69 0.57 ** 1.25
9th grade 0.60 0.29 *** 1.32
Block 4: individual
Low self-control 1.50 * 2.55 *** 1.40 *
Positive attitude to violence 2.27 *** 2.69 *** 2.01 *** Block 4: lifestyle
Alcohol 2.39 *** 2.00 *** 2.32 ***
Drugs 2.28 *** 2.75 *** 1.74 ***
Delinquent friends 2.23 *** 1.76 *** 2.00 ***
Goes out 1.75 ** 1.55 1.49
Time spent with (reference: alone)
Family 0.99 1.39 0.65 Friends 1.42 1.51 * 0.70 Discriminated 1.20 1.84 *** 1.21 Victim 1.48 * 1.52 ** 1.68 *** Nagelkerke R2(in %) 38.6% 42.2 % 33.0% * p≤ 0.05, ** p ≤ 0.01,*** p ≤ 0.001
committed a violent offence in Toronto, whereas having been the victim of theft, assault or robbery increases this risk in all three countries.
As was the case for property-related offences, the model fits better for Belgium and Toronto than for Switzerland.
Comparison of the Final Models
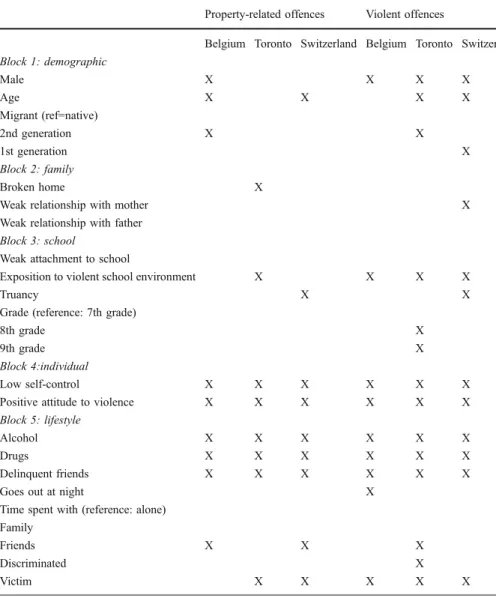
In Table 12, the significant variables in the final models of property-related and violent offences are represented by an X
Demographic characteristics are not linked in a similar way to these two types of offences. Being male significantly increases the risk of reporting having committed a violent delinquent act over the 12 months prior to the survey in all three countries, but this
Table 12 Significant variables in the final model of property-related and violent offences Property-related offences Violent offences
Belgium Toronto Switzerland Belgium Toronto Switzerland Block 1: demographic Male X X X X Age X X X X Migrant (ref=native) 2nd generation X X 1st generation X Block 2: family Broken home X
Weak relationship with mother X
Weak relationship with father Block 3: school
Weak attachment to school
Exposition to violent school environment X X X X
Truancy X X
Grade (reference: 7th grade)
8th grade X
9th grade X
Block 4:individual
Low self-control X X X X X X
Positive attitude to violence X X X X X X
Block 5: lifestyle
Alcohol X X X X X X
Drugs X X X X X X
Delinquent friends X X X X X X
Goes out at night X
Time spent with (reference: alone) Family
Friends X X X
Discriminated X
is not the case for property-related offences, where gender is only significant in Belgium. In all three countries, no factors mitigated the effect of gender on violent delinquency. Even after taking into consideration age, migrant background and positive attitudes to violence and self-control, the odds of male youth reporting violent delinquency were more than four times those of female youths in Switzerland and approximately double those in Belgium and Canada. Again, age is significant in Belgium and Switzerland as far as property-related offences are concerned, whereas this variable is significant in both Toronto and Switzerland in relation to violent offences. Results regarding the variable migration are not consistent between the three countries or between offences.
Family related characteristics have a reduced effect in the final models. The family structure and the relationship created between a youth and his/her father are not significant in any of the three countries. This outcome is obtained for both types of delinquency. On the other hand, in Switzerland, the relationship created between a youth and his/her mother is significant, although only in relation to violent delinquency. Clearly, the variables related to the family context do not seem important once others variables are taken into account.
School-related characteristics The variable that takes into consideration school attachment is not significantly linked to either offence, in any of the three countries. On the other hand, youths attending a violent school environment show higher odds of violent behaviour in all three countries. This is also observed in Toronto in relation to property-related offences. In other words, the level of attachment to the school is far less important than the actual characteristics of the school. Truancy is, in the final models, only significantly related to both offences in Switzerland. One explanation for the absence of a link between delinquency and truancy in Belgium may have to do with a regulation presently enforced according to which students who have missed more than 10 half days loose their student status unless they provide a reasonable excuse for being absent. However, this regulation is often considered by students as a right to be absent for 10 half days, and therefore, truancy figures may be inflated. The last variable in this block concerns the grade being attended by the student. Results show that this variable is significant only in Toronto and only in relation to violent offences. With regard to Belgium, results show that a high percentage of pupils have had to repeat a year, which may explain that age is significant in this country but not grade.
Individual variables (self-control and attitudes towards violence) are significantly related to violent and property-related offences in all three countries. These variables refer to a way of thinking and the perception one has of his/her place in the social world. They are linked to lifestyle related characteristics. Results show that the consumption of drugs and alcohol, together with the presence of delinquent friends, increases the odds of having committed a delinquent act in the 12 months prior to the survey. These results remain unvaried even after having included other factors. Results also show that going out at night is only significant in relation to violent offences. This means that going out at night increases the risk of committing violent offences. Spending most of one’s free time with the family appears to have no influence with regard to the risk of partaking in deviant acts, whereas spending most of one’s free time with friends is more important, even if mitigated. In Belgium and Switzerland, time spent with friends increases the odds of having committed a property-related offence, whereas in Toronto, this variable increases the odds of having committed a violent act. In Toronto, youths who have been victims of discrimination at least once in their lifetime have significantly higher odds of having committed a least one violent offence; however, this is not the case in Switzerland or Belgium. When all factors are taken into account, youths who have been victimised (theft, assault or robbery in the 12 months prior to the survey) are more likely to report having committed at least one violent act. This
result applies to all three countries. This, however, has not been verified in a recent Belgian study that questioned adolescents’ violent behaviour. In that study, we observed that victimisation had no influence on the total sample (boys and girls together) nor among boys alone, although such an association was observed in the female subsample (Gavray et al. 2009). This result emphasises the importance of continuing to conduct comparative research in the light of gender theory and to perform separate analyses on boys and girls, thus enabling researchers to verify whether the same dynamic of variables facilitates delinquent behaviour in each group. Finally, results show that victimisation increases property-related delinquency only in Toronto and in Switzerland.
Conclusion
Overall, the results indicate that delinquent behaviour is associated with multiple factors linked to different domains. Once other contexts are taken into account, the family context seems to be less important when compared with the so-called individual characteristics or lifestyle. This result is consistent with the fact that adolescents reorient their affective investment in peers and are very sensitive to recognition by friends—to their opinion and influence. These two categories of items (individual characteristics and lifestyle) are in fact very similar as a consequence of the relationship between the way of thinking, attitudes and behaviour. The fact that family-related variables are no longer significant in the final model does not mean that we should consider the family context as being unimportant. It simply means that other contexts have more of an impact on deviant behaviour at this stage of life. However, as the present results are not issued from a longitudinal study, an underlying causal structure for delinquency, which could involve family-related factors, cannot be discounted on their basis.
The results provide evidence that drugs and alcohol consumption has very important implications with regard to behaviour. Many studies have shown strong links between such consumption and delinquency. Delinquent peer networks also have a crucial impact on delinquent behaviour. This finding is consistent with research suggesting that the influence of peer groups in which delinquent behaviour is accepted may facilitate the development of delinquent behaviour among youth (Cohen & Felson1979). These results confirm the role of a deviant lifestyle and indicate that, when juvenile crime is studied, the priority is perhaps not to categorise the kind of facts or behaviour (e.g. property-related or violent delinquency) but rather to understand the meaning young people give to their behaviour. Through this study, we verify that a similar internal and interpersonal core dynamic explains the two kinds of delinquent acts. The company of delinquent friends emerges as a very important correlate of both property-related and violent delinquency after taking into account all other factors in the study. This variable is, however, more significant for property-related than for violent delinquency. This is perhaps due to the content of dependent variables used in the analysis. Carrying a weapon and group fighting, which are the most frequent acts composing the variable of violent delinquency, are somewhat trivialised acts, which may explain this difference in the importance of peer networks for the two types of delinquency studied. These acts can be considered as part of the growing process, which involves the development of the teenagers’ personal identity, particularly for boys. Gender norms and education may also help explain violent delinquency and give a more comprehensive understanding of the way in which girls and boys think and choose to act.
Being in a violent environment, which in our study was measured in the school context, also increases the risk of committing offences, especially violent ones. These findings are
related to the “broken-windows theory”, which mentions that if disorder is accepted, informal social controls diminish, and offenders “invade” the area because they face no threat of punishment, and thus crime increases (Shaw & McKay1942). On the other hand, the fact that there is no significant correlation with the level of attachment to school may be explained by the fact that most deviant students feel comfortable at school, since they consider school to be a place where they can meet girls and friends and organise (illegal) leisure time activities (Gavray & Vettenburg2009). The impact exposure to violence has on committing violent acts is also apparent from the correlation between delinquent behaviour and personal victimisation.
A number of limitations must be acknowledged in considering the results in this paper. First, and as already said, the ISRD has a cross-sectional design. As a result, it is not possible to determine either timing or causal order of events. It must be taken into account that in our model, we can find mutual causal relations between the various studied factors. For example, committing delinquent acts increases the probability of encountering delinquent peers. Second, an important limitation is the lack of information on the socioeconomic characteristics of families, such as household income, educational level and occupational status.3Another restriction lies in the definition of the respondents’ age. The study confines itself to the 7th, 8th and 9th grades, which means that most of the respondents are 15 years old or younger. Previous research shows that after a period of relatively trivial offences spread over time, the frequency of delinquent behaviour and the use of violence increase from about the age of 16 (Fayolle1981; Osborn & West1978). If the study were to extend the age of respondent to 18, further patterns in delinquent behaviour and their explanation could be produced. However, we feel that a comparative analysis between different countries constitutes an added value and will stimulate further in-depth research.
This study shows the role of individual characteristics and lifestyle variables in relation to delinquency in all three countries. We now make two reflections in this regard. Our first concerns the explanation of delinquent behaviour on the basis of individual character traits. Several studies established a relationship between delinquent behaviour and individual character traits, such as intelligence (Hirschi & Hindelang1973; Maguin & Loeber1996), impulsiveness, hyperactivity (Farrington 1992; Krueger et al. 1996), extreme distrust (Leblanc & Frechette 1987) and a distorted processing of social stimuli so that the individual feels almost constantly as though he or she is being treated in a hostile manner (Dodge & Schwartz1997). Gottfredson and Hirschi even base their general theory of crime on one single psychological character trait, low self-control (1990). It is very hard to assess the extent to which this involves either intrinsically individual character traits or the impact of the environment; each of these individual traits can be perceived of as being at least partly due to external influences. A distrustful attitude may result from a series of negative experiences in social relationships; low self-control can, to a large extent, be related to a nonrestrictive education (Rutter et al. 1998). However, the relative importance in the development of antisocial behaviour of individual temperament cannot be assessed.“There is not a gene for crime… genetic influences operate through effects on vulnerability to environmental adversities and stressors, and some through their role with respect to behaviours concerned with shaping and selecting of environments.” (Rutter et al.1998, pp. 165-166). The question remains in what ‘environments’ these decisive experiences are lived. Typically, one focuses on the family context (Patterson & Fisher2002). Our analyses
3
It should be noted that questions related to such information were included in the Belgian questionnaire, although it is not possible to carry out a comparative analysis.
show that, especially with regard to violent offences, exposure to violence—in particular, criminality at school and personal victimisation—is a significant factor. In light of this finding, we believe it is important that the individual traits found—namely, the young person’s self-control and attitude towards violence—be explored in greater depth and that they are related to environmental factors.
A second reflection concerns potential preventive actions that can be linked to our findings. Since our results show a strong link to lifestyle variables, it can be deduced that useful crime prevention efforts could be focussed on these factors. Three of the most stable factors are drug consumption, alcohol consumption and delinquent peers. Whereas the association with delinquent peers is not easily controlled by the state, the levels of drug and alcohol consumption can be controlled (and are in most countries, particularly for the age group considered here). The strong link between drug and alcohol consumption indicates that efforts implemented to reduce consumption levels, especially with regard to the age group treated here (teenagers), should be continued and perhaps reinforced. Again, this consumption is not necessarily a cause of the commission of delinquency. Both alcohol/drug consumption and delinquency may be the consequences of factors that may or may not have been included in our study. Indeed, if substance use and delinquency are the result of some underlying cause, it can be questioned whether measures implemented to reduce consumption of drugs and alcohol are effective. It would also call for determining the most appropriate ways to implement the necessary measures. Another factor that gives important information with respect to prevention efforts is exposition to a violent school environment. Results show that it is necessary to invest more efforts into preventing and eliminating such violent environments. It should be noted that any preventive measure implemented should allow the emancipation and fulfilment of the young person to the maximum extent possible. For instance, instead of introducing an immediate ban on alcohol or drugs, it would be more appropriate that the reasons for consumption be investigated (e.g. youths use drugs in order to join a group of peers). Furthermore, more alternatives (e.g. sports activities) should be offered in the list of strategies concerning the prevention of deviant behaviour in youths. Also, youngsters should be given a say in the formulation and development of prevention projects (Vettenburg et al.2007).
Appendix
Demographic variables sex, age (from 12 to 17 years) and immigration background (native, second- and first-generation immigrant) have been included. We consider as“a native” any respondent born in the country whose parents were also born in the country. A respondent born abroad is also considered as a“native” if both his/her parents were born in the country. A “second-generation migrant” is a person born in the country with at least one of his parents born abroad. A “first-generation migrant” is a respondent who was born abroad with one or both parents born abroad as well.
Family-related variables are the following: family composition and attachment to the father and to the mother. Youth were coded to one of two family types according to their responses to a series of questions about with whom they lived. The final variable contains only two categories: intact family (live with their mother and father) and broken home. Attachment to the father measures whether or not youths reported getting along with their father. The youths were asked“How do you usually get along with the man you live with (your father or stepfather)”? A dichotomous variable was created (strong vs weak relationship). The same question was asked for the relationship with the mother: Attachment to the mother.
Four school-related variables were considered: the attachment to school measures feelings towards school. It is measured by a 3-element-scale: would miss school, considerate teachers and I like my school. The variable violent school environment is measured by 4 items: there is stealing, fighting, vandalism or drug use at school. Both variables are continuous. Truancy (skipping school) measures if and how often youth reported skipping school during the 12 months prior to the survey. Grade refers to the school year in which the student is enrolled. The variable includes 7th, 8th and 9th grade, and 7th grade has been used as the reference category.
Two individual variables have been included in analyses. The self-control scale is composed of 12 items based on four subscales: impulsivity (e.g.“I act spontaneously without thinking”), risk seeking (e.g. “I like to test my limits by taking risks”), self-centred (e.g. “If things I do upset people, it’s their problem not mine”), volatile temper (e.g. “I lose my temper pretty easily”). Attitude towards violence is a scale composed of five items. Both variables are continuous, with large scores indicating low self control and very positive attitude to violence. Four lifestyle related variables were used: Alcohol consumption measures whether or not youths reported having drunk alcohol (wine, beer, breezers or strong spirits). Drugs consumption takes into account substances such as marijuana/hash, XTC, speed, LSD, heroin or cocaine. Delinquent friends measures whether or not youth reported having delinquent friends. Youth were asked if they have friends who ever have committed property-related or violent delinquency. Going out at night is a variable obtained from one question asking whether parents give a time to be home by to the youth when he or she goes out at night. The possible answers were“I don’t go out”, “no time given”, “yes, a time is given”. In our analyses, this variable has been dichotomised into “I don’t go out at night” vs“I do go out at night”. Another question concerns with whom the youth spends most of his or her free time. Three categories have been created: alone, with the family and with friends. Victimization measures whether or not youth reported having been hit, stolen from, or threatened in the last 12 months. Discrimination measures whether or not students reported ever having been a victim of discrimination (i.e. treated badly because of their religion or the language they speak or because of the colour of their skin).
References
Blatier, C. (2002). La délinquance des mineurs. L’enfant, le psychologue, le droit (2nd ed.). Grenoble: Presses Universitaires.
Born, M., & Thys, P. (2001). Délinquance juvénile et famille. Paris: L’Harmattan.
Cohen, L. E., & Felson, M. (1979). Social change and crime rate trends: a routine actvity approach. American Sociological Review, 44(4), 588–608.
Dodge, K., & Schwartz, D. (1997). Social information processing mechanisms in aggressive behavior. In D. Stoff, J. Breiling, & J. D. Maser (Eds.), Handbook of antisocial behavior (pp. 171–180). New York: Wiley. Enzmann, D., & Wetzels, P. (2003). Ethnic differences in juvenile delinquency: the role of violence legitimizing norms of masculinity. In F. Dünkel (Ed.), Youth violence: New patterns and local responses—experiences in East and West. Mönchengladbach: Forum Verlag Godesberg.
Farrington, D. (1992). Explaining the beginning, progress and ending of antisocial behavior from birth to adulthood. In J. McCord (Ed.), Advances in criminological theory: Facts, frameworks and forecasts (Vol. 3, pp. 381–458). New Brunswick: Transaction Publishers.
Fayolle, B. (1981). Essai d’approche des mineurs multi-récidivistes. Annales de Vaucresson, pp. 111–172. Filleule, R. (2001). Sociologie de la délinquance. Paris: PUF.
Galand, B., Philippot, P., Petit, S., Born, M., & Buidin, G. (2004). Regards croisés sur les phénomènes de violence en milieu scolaire: élèves et équipes éducatives. Revue des sciences de l’éducation, 30, 465–486. Gavray, C. (2009). Délinquance juvénile et enjeux de genre. Interrogations, 8, 43–65.
Gavray, C., Manço, A., & Sensi, D. (2009). L’affranchissement des modèles de sexe comme facteur de meilleure réussite scolaire. Bruxelles: Direction égalité des chances de la communauté Française de Belgique.
Gavray, C. & Vettenburg, N. (2009). Who are the most violent young adolescents ? Paper presented at the 9th European Society of Criminology (ESC).
Gottfredson, M. R., & Hirschi, T. (1990). A general theory of crime. Stanford: Stanford University Press. Hirschi, T. (2002). Causes of delinquency. New Brunswick: Transaction Publishers.
Hirschi, T., & Hindelang, M. (1973). Intelligence and delinquency: a revisionist review. American Sociological Review, 42, 571–587.
Junger-Tas, J., Haen-Marshall, I., Enzmann, D., Killias, M., Steketee, M., & Gruszcynska, B. (2009). Juvenile delinquency in Europe and beyond: Results of the second international self-report delinquency study. Dordrecht: Springer.
Junger-Tas, J., Marshall, I. & Ribeaud, D. (2003). Delinquency in an international perspective: The international self-reported delinquency study. Monsey (N.Y.): Criminal Justice press/Den Haag: Kugler.
Junger-Tas, J., Terlouw, G. J., & Klein, M. W. (Eds.). (1994). Delinquent behavior among young people in the Western World. Amsterdam: Kugler.
Killias, M., Aebi, M. F., Herrmann, L., Dilitz, C., & Lucia, S. (2010). Switzerland. In J. Junger-Tas, I. Haen-Marshall, D. Enzmann, M. Killias, M. Steketee, & B. Gruszcynska (Eds.), Juvenile delinquency in Europe and beyond: Results of the second international self-report delinquency study. Dordrecht: Springer.
Krueger, R., Caspi, A., Moffit, T., & White, J. (1996). Delay of gratification, psychopathology and personality: is low self-control specific to externalizing problems? Journal of Personality, 64, 107– 129.
Le Blanc, M., & Morizot, J. (2001). La personnalité des délinquants de la latence à l’âge adulte: stabilité ou maturation ? Revue internationale de criminologie et de police technique et scientifique, 54(1), 35–68. Leblanc, M., & Frechette, M. (1987). Male criminal activity from childhood through youth. NewYork:
Springer.
Loeber, R., & Dishion, T. J. (1983). Early predictors of male delinquency: a review. Psychological Bulletin, 94, 68–99.
Lucia, S., Herrmann, L., & Killias, M. (2007). How important are interview methods and questionnaire designs in research on self-reported juvenile delinquency? An experimental comparison of Internet vs. paper-and-pencil questionnaires and different definitions of the reference period. Journal of Experimental Criminology, 3, 39–64.
Maguin, E., & Loeber, R. (1996). Academic performance and delinquency. In M. Tonry & D. Farrington (Eds.), Crime and justice (Vol. 20, pp. 145–246). Chicago: Chicago Univ. Press.
Mucchielli, L. (2003). Délinquance et immigration: le sociologue face au sens commun. Hommes et migrations, 1241, 20–31.
Osborn, S., & West, D. (1978). The effectiveness of various predictors of criminal careers. Journal of Adolescence, 1, 101–117.
Patterson, G., & Fisher, P. (2002). Recent developments in our understanding of parenting: bidirectional effects, causal models, and the search for parsimony. In M. H. Bornstein (Ed.), Handbook of parenting: practical issues in parenting, Vol. 5, pp. 59–88. Mahwah: Lawrence Erlbaum Associates.
Pellegrini, A. D., Bartini, M., & Brooks, F. (1999). School bullies, victims, and agressive victims: factors relating to group affiliation and victimisation in early adolescence. Journal of Education & Psychology, 1, 216–224.
Rutter, M., Giller, H., & Hagell, A. (1998). Antisocial behavior by young people. Cambridge: Cambridge University Press.
Savoie, J. (2010). Canada. In J. Junger-Tas, I. Haen-Marshall, D. Enzmann, M. Killias, M. Steketee, & B. Gruszcynska (Eds.), Juvenile delinquency in Europe and beyond: Results of the second international self-report delinquency study. Dordrecht: Springer.
Shaw, C. R., & McKay, H. D. (1942). Juvenile delinquency in urban areas. Chicago: University of Chicago Press.
Smit, P., Haen Marshall, I. & van Gammeren, M. (2008). An empirical approach to country clustering. In K. Aromaa & M. Heiskanen (Eds.), Crime and Criminal Justice Systems in Europe and North America 1995–2004. Helsinki, Finland: European Institute for Crime Prevention and Control, affiliated with the United Nations (HEUNI).
Vettenburg, N., Gavray, C., & Born, M. (2010). Belgium. In J. Junger-Tas, I. Haen-Marshall, D. Enzmann, M. Killias, M. Steketee, & B. Gruszcynska (Eds.), Juvenile delinquency in Europe and beyond: Results of the second international self-report delinquency study. Dordrecht: Springer.
Vettenburg, N., Melis, B., Burssens, D., & Goris, P. (2007). Wenselijke algemene preventie. In P. Goris, D. Burssens, B. Melis, & N. Vettenburg (Eds.), Wenselijke preventie stap voor stap (pp. 35–59). Antwerpen: Garant.
Vettenburg, N., & Walgrave, L. (2008). Maatschappelijke kwetsbaarheid, school en verstedelijking. In I. Weijers & C. Eliaerts (Eds.), Jeugdcriminologie. Achtergronden van jeugdcriminaliteit (pp. 183–205). Den Haag: Boom Juridische Uitgevers.
Watkins, K., Carvajal, L., Coppard, D., Fuentes, R., Ghosh, A., Giamberardini, C., et al. (2006). Human Development Report 2006—Beyond scarcity: Power, poverty and the global water crisis. Retrieved 2.4.2009, fromhttp://hdr.undp.org/en/media/HDR06-complete.pdf.
Wikström, P.-O. H. (2004). Crime as alternative. Towards a cross-level situational action theory of crime causation. In J. McCord (Ed.), Beyond empiricism: Institutions and intentionsin the study of crime. Advances in criminological theory (Vol. 13, pp. 1-37). New Brunswick: Transaction Publishing. Wikström, P.-O. H. (2005). The social origins of pathways in crime: Towards a developmental ecological
action theory of crime involvement and its changes. In D. P. Farrington (Ed.), Integrated developmental and life course theories of offending. Advances in criminological theory (Vol. 14, pp. 211–245). New Brunswick: Transaction Publishing.
Wikström, P.-O. H., & Sampson, R. J. (2003). Social mechanisms of community influences on crime and pathways in criminality. In B. B. Lahey, T. E. Moffitt, & A. Caspi (Eds.), Causes of conduct disorder and juvenile delinquency (pp. 118–148). New York: Guilford.