Ministère de l’Enseignement Supérieur et de la Recherche Scientifique
Université de Batna 2
Faculté de Technologie
Département d’Électrotechnique
THÈSE
Présentée pour l’obtention du diplôme de
DOCTORAT 3
èmecycle LMD en Électrotechnique
OPTION
Conception, Contrôle et Diagnostic des Systèmes Electriques
Par
ALNEJAILI Tareq
Thème
Commande dynamique de l’énergie dans un bâtiment
multi-sources
Dynamic control of energy in a multi-source building
Soutenue le 06/05/2017 devant le jury composé de :
Dr. AZOUI Boubekeur Prof. Université de Batna 2. Président
Dr. DRID Saïd Prof. Université de Batna 2. Encadreur
Dr. MEHDI Driss Prof. Université de Poitiers, France Co- Encadreur Dr. CHRIFI-ALAOUI Larbi M.C.A Université de Picardie Jules Verne, France Examinateur
Dr. BETKA Achour Prof. Université de Biskra Examinateur
L'objectif principal de ce travail est de développer un système de gestion de l'énergie (EMS) qui contrôle l'utilisation des technologies d'énergie renouvelable au niveau de la production locale d'électricité de l'énergie demandée par un bâtiment hors réseau, de développer des techniques de gestion des charges, gérer la consommation d'énergie dans le bâtiment et réduire les émissions nocives pour l'environnement.
Le système de gestion de l'énergie EMS effectue le contrôle global du système pendant deux intervalles de temps différents, le premier étant un contrôle dynamique en temps réel. Dans cet intervalle de temps, les références de puissance pour chaque source sont calculées en fonction du flux de puissance dynamique dans le système, tandis que la seconde est un intervalle de temps long qui concerne le contrôle du côté de la demande. Dans cet intervalle de temps, le EMS gère le profil de charge du bâtiment étudié afin d'augmenter la durée de vie du composant du système, de réduire la consommation d'énergie et de minimiser les coûts d'exploitation du système.
Le système EMS développé est principalement utilisé pour un système d'énergie hybride zéro émission comprenant un panneau photovoltaïque, une pile à combustible, un électrolyseur, une batterie au plomb et un super-condensateur. Le système d'alimentation hybride a été testé par simulation à l'aide de logiciels Matlab/Simulink. La simulation est effectuée sur une courte et une longue période de temps afin d'évaluer la performance des contrôleurs dynamiques et l'efficacité de la stratégie de gestion. Pour une longue période de simulation, une maison située dans la province de Batna (35 ° 33'N 6 ° 10'E) a été prise comme étude de cas avec une étude approfondie du profil de charge réel pour une maison moyenne avec toutes les données météorologiques requises par rapport à l'emplacement. De plus, une seconde étude de cas est ajoutée pour un système d'alimentation hybride constitué d'une source d'énergie conventionnelle et d'une source d'énergie renouvelable. La deuxième étude de cas porte sur l'application du DSM proposé sur un système hybride (photovoltaïque-vent-diesel) pour un bâtiment de santé rural moyen situé dans la région du Sahara. L'objectif principal de la deuxième étude de cas présentée est de tester l'efficacité du DSM pour un tel système d'alimentation hybride. Les résultats de la simulation confirment l'efficacité du SME proposé, car il augmente la fiabilité énergétique du système électrique, réduit l'émission de gaz à effet de serre dans le cas d'une deuxième étude de cas et minimise fortement le coût d'exploitation des systèmes.
Mots-clés
- Système de gestion de l'énergie, contrôle dynamique, système d'alimentation hybride, profil de charge, efficacité énergétique.The main goal of this work is to develop an energy management system (EMS) that control the use of renewable energy technologies at the point of local electricity production of the energy needed by an OFF grid building, furthermore its develop an advance load management techniques to adjust the energy consumption within the building and reduce the harmful emissions to the environment.
The energy management system effected the overall system control throughout two different time interval, the first one is a real-time dynamic control. In this time interval, the power references for each source is calculated according to dynamic power flow within the system, while the second one is a long time interval that concerns the demand side control. In this time interval the EMS manages the load profile of the building under study in order to increase the service life of the system component, reduce the energy consumption and minimize the operation cost of the system.
The developed EMS is applied mainly for zero emissions hybrid energy system that includes a photovoltaic panel, a fuel cell, an electrolyzer, a lead acid battery bank and a supercapacitor. The hybrid power system has been tested by simulation using models implemented in Matlab/Simulink software. The simulation is performed over a short and a long period of time in order to evaluate the performance of the dynamic controllers and the effectiveness of the management strategy. For a long simulation period,
a deep study on real load profile for an average house with all required weather data with respect to the location. Moreover second case study is added for hybrid power system that consist of a conventional and a renewable energy sources. The second case study focuses on the applying the proposed DSM on a (photovoltaic wind diesel) hybrid system for medium rural health building located in the Sahara region.The main aim of the presented second case study is to test the efficacy of the proposed DSM for such hybrid power system The simulation results confirm the efficiency of the proposed EMS, as it increases the energy reliability of the power system, reduce the greenhouse gas emission in the case of second case study and minimize highly the operation cost of the systems.
Keywords Energy management system, dynamic control, hybrid power system, load profile, energy efficiency, OFF grid building.
EMS Energy management system GHG Greenhouse gas RE Renewable energy FC Fuel cell EL Electrolyzer PV Photovoltaic
HPS Hybrid power system
MPPT Maximum Power Point Tracking SC Super-capacitor
PEM Proton exchange membrane VSI Voltage-source inverter DLC Direct Load Control LDC Load duration curve O&M Operating and maintenance SOC State of charge
SMC Sliding mode control DSM Demand side management LSM Load side management LM Load management DR Direct response NPC Net present cost COE Cost of energy Ga Natural irradiance Ta Ambient temperature
Occupancy
Hydrogen tank pressure FLC Fuzzy logic controller LMD Load management device A/C Air conditioner
Acknowledgments
Abstract
ABBREVIATIONS
Table of Contents
List of figures
List of tables
General Introduction Chapter 1Background and research problem
Introduction 1
Building, energy and environment 1 Energy consumption of the building in Algeria 3 Renewable Energy Integration in Buildings 4 Energy and load side management techniques in the building 6 Problem statement and research objectives 8
References 10
Chapter 02
System Modeling
2.1 Introduction 11
2.2 Fundamental on the hybrid system 11 2.3 PV principle of operation and modeling: 12
2.3.1 PV model 13
2.4 Fuel cell principal of operation 14
2.4.1 FC modeling 15
Hydrogen storage model
2.6 Lead-acid battery and it Principle of Operation 20
2.6.1 Battery modeling 20
2.7 Supercapacitor 22
2.7.1 Supercapacitor model 23
2.8 Modeling of the power converters 24 2.8.1
Modeling of the DC-DC bidirectional converter 24
2.8.2 Boost Converter Modeling 25
2.8.3 Buck Converter Modeling 26
2.8.4 DC/AC converter model 26
2.9 Conclusion 29
2.10 References 29
Chapter 3
Demand Side Management Techniques
3.1 Introduction 30
3.2 demand side management strategies 30
3.2. Load Management 30
3.2.2 Demand Response 33
3.2.3 Energy efficiency 33
3.2.4 Link between DR and energy efficiency 33
3.3 Analyzing load demand 34
3.3.1 Load curve 34
3.3.2 Load duration curve 35
3.3.3 Peak demand 36
3.3.4 Load factor 37
3.3.5 Superposition factor 38
3.3.6 Loads operation parameters 38
3.4
3.4.2 Total Net Present Cost 41 conclusion
References
Chapter 4
Power flow management and dynamic controllers design
4.1 Introduction 44
4.2 Hybrid system management and control methodology 44
4.3 Dynamic controller design 44
4.3.1 SMC general principle 44
4.3.2 Battery controller 47
4.3.3 MPPT Control 50
4.3.4 FC Controller 52
4.4 The central power flow controller 53
4.5 Dynamic control simulation 57
4.6 Conclusion 60
4.7 References 60
Chapter 5
The first case study on the proposed demand side management and control algorithm
Introduction
General description and objectives
DSM Concept Load profile
Hybrid system optimization
Application of HOMER program for the optimization
The first case study on the on operational application of DSM control algorithm
Optimization of the hybrid power system
Model input
Optimization results
Load management strategy
Load management strategy simulation
Conclusion
References
Chapter 6
The second case study on the proposed demand side management and control algorithm
6.1 Introduction 6.2 General overview
6.3 Geographic and climate data of the region 6.4 Load profile
6.5 Design and optimization of the hybrid power system 83
6.5.1 Optimization results 84
6.6 DSM Concept 85
6.6.1 Load management unit for non-critical lights 86 6.6.2
Load management unit for air conditioners
87
6.6.3 The local load management device 89
6.6.3.1 Fuzzy logic controller 89
6.7 Result and discussion 92
6.7.1 Load management results 92
6.7.2 Environmental evaluation 94
6.8 Conclusion 94
6.9 References 94
Fig. 1.1 World total primary energy supply from 1973 to 2012 by fuel
Fig. 1.2 World energy consumption in the transport, industry and building sectors Fig 1.3 Energy usage in Algeria
Fig. 1.4 Energy management system Fig. 1.5 General method of DSM Fig. 2.1 Hybrid system structure
Fig. 2.2 Construction of the solar cell Fig 2.3 Fuel cell reaction
Fig. 2.4 PEMFC model
Fig. 5 PEM electrolysis reactions. Fig. 2.6 Electrolyzer model
Fig. 2.7 Hydrogen storage model Fig. 2.8 Discharge process Fig 2.9 Battery model
Fig 2.10 Typical construction of a supercapacitor.
Fig. 2.11 Supercapacitor model
Fig. 2.12 Voltages and currents for the bi-directional buck-boost DC-DC converter. Fig. 2.13 DC-DC Boost Converter
Fig. 2.14 Buck converter
Fig. 2.15 Power circuit of a three-phase VSI. Fig. 3.1 Load control strategies
Fig. 3.2 Daily pattern of demand in kW based on Half Hourly mean values Fig. 3.3 Shows the yearly pattern in kWh per Day.
Fig. 3.4 Load curve and load duration curve Fig. 3.5 Superposition and superposition factor Fig. 4.1 A general overview of SMC
Fig. 4.3. Battery power control, (0: buck mode, 1: boost mode)
Fig. 4.4 Proposed schematic for P&O modified and MPPT proposed sliding mode control.
Fig. 4.5 Fuel cell reference current determination Fig. 4.6 PEMFC power control
Fig. 4.7 Decision tree of the power flow controller Fig. 4.8 PV output power (W)
Fig. 4.9 Solar irradiance (W/m2)
Fig.4.10 Battery current (A) Fig. 4.11 FC current (A)
Fig. 4.12 Electrolyzer current (A) Fig. 4.13 Power demand (W) Fig. 4.14 Fuel consumption Fig. 4.15 DC bus voltage (V)
Fig 5.1 Schematic diagrams of some micro power system types that HOMER models
Fig 5.2 Homer cost inputs Fig. 5.3 Homer profile input
Fig. 5.4 Horizontal global irradiation, [kWh/m².month] Fig. 5.5 Ambient temperature °C
Fig. 5.6 An exemplary load profile
Fig. 5.7 Architecture of the Selected Technologies of the Hybrid System Produced by HOMER
Fig. 5.8 The load management strategy flowchart Fig. 5.9 System operating without load management Fig. 5.10 System operating with load management: Fig 6.1 Geographical position of Tindouf Fig. 6.2 Ambient temperature °C
Table 2.1 Parameters Of The PV System 14 Table 2.2 FC Model Parameters 17 Table 2.3 SC MATLAB Simulation Parameters 24 Table 2.4 Inverter Specifications 28 Table 5.1 Hourly Load Consumption Exemplary 65 Table 5.2 List Of The Typical Electricity Consumption Of Household Appliance
In The Location
70 Table 5.3 Hourly Consumption Of The House 70 Table 5.4 Model Economic Inputs 72 Table 5.5 Optimized Configurations Of The System 73 Table 5.6 Load Management Parameters 76 Table 6.1 Example Of Load Inventory For A Medium Health Clinic 83
Table 6.2 Homer Model Input 84
Table 6.3 Parameters Of Feasibility Analysis 84 Table 6.4 The Principle Of Operation Of The Master Controller Modes. 88 Table 6.5 Occ Rang Of The Facility Thermal Zones 90 Table 6.6 Fuzzy Control Rules Of The System 91 Table 6.7 The Output Variable Definition 91 Table 6.8 Parameters Of Load Management Simulation 92 Table 6.9 Environmental Evaluation Of The Two Studied Systems 94
1. Context and problems
these fuels. The risk of shortages of fossil fuels and their effects on climate change, have powered an increasing interest around the importance of renewable energy (RE) sources such as solar, wind, hydro power, biomass and hydrogen. RE can be integrated into all types of electricity supply systems, from large, interconnected, continental-scale grids to on-site generation and utilization in small, autonomous buildings.
Residential and commercial buildings account for almost 38 percent of the world Greenhouse gas emissions. Nearly all of the (GHG) emissions from the residential and commercial sectors can be attributed to energy use in building. Residential and commercial activities contribute to emissions in a variety of ways:
Combustion of natural gas and petroleum products for heating and cooking needs. Organic waste and wastewater treatment consume considerable amount of energy and emit different GHG such as methane (CH4), and nitrous oxide (N2O).
Fluorinated gases (mainly hydro fluorocarbons, or HFCs) used in air conditioning and refrigeration systems can be released during servicing or from leaking equipment. Many researches have been done to reduce the energy consumption of the building. These researches can be classified in two main categories. The first interested on the improvement of the architecture, the structure, the insulation or the materials in the building. The second deal with the local production of a part of the energy needed by the building without greenhouse gases emissions.
Building sites are surrounded by natural energy in the forms of wind, solar radiation, and geothermal heat. Renewable energy systems can be used to supplement or eliminate traditional heating, cooling, and electrical systems through the utilization of this natural energy. Components that encourage daylighting, passive and active solar heating, and on-site power generation are included in this category. Solar power can be utilized in many forms, both for heating and production of electricity. Wind power is a feasible way to generate electricity and pump water. Active solar or geothermal heat requires outside electricity for pumps but still saves energy in comparison to the operation costs of traditional mechanical systems.
The opportunities of the integration of different RE technologies throughout the building depend on many factors such as: the building designs, the availability of renewable energy resources and the costs of the renewable energy technology
A successful RE integration require an advanced energy management system (EMS) that responsible for multiple objectives including the effective integration of different RE technologies, dynamic system control, data management, grantee maximum comfort level for those living or working in the building with minimum use of energy, managing energy use throughout load side management techniques and reducing environmental impacts, all for minimal cost.
RE integration efficiency can be highly improved by the use of load side management techniques Usually the DSM techniques shared three common objectives, which can be presented as:
a) Reducing of energy consumption
b) Reducing demand through more efficient processes, buildings or equipment
c) Changing the load pattern and move the energy consumption from ON to OFF peak period
2. Thesis structure and objectives
The main aim of this work is to develop an energy management system (EMS) that control the use of renewable energy technologies at the point of local electricity production of the energy needed by an OFF grid building, The main objectives of the EMS are:
Increase the reliability of the system and improves its energy balance.
Reduce energy consumption and reducing the harmful emissions to the environment Achieve a significant economic benefits.
In addition to that the EMS employs an advance load management techniques to adjust the energy consumption within the building and to reduce the harmful emissions to the environment. This work comprise six chapter and is organized as follows:
The first chapter presents the background, problem statement, and value of the study. Firstly it introduces a general information about the study problem. This is followed by a discussion on the specific objectives and the scope of this study.
The second chapter briefly presents the system components description and modeling. Chosen appropriate modelis extremely important to effectively manage and control the energy flow within the system. The chosen models must allow us to specify the structure or the
behavior of the system and represents a template that guides in the system constructing and in the decisions making.
The different techniques of demand side management (DSM) are presented in chapter three. Firstly it describes the background information of different DSM technique, including objectives, methods, and current research status. The review of the appliance level of DSM for various types of demands from statistical, simulated, and monitored sources is also reported. Moreover an economical analyze of the different economical terms that used in the economic optimization is presented.
The chapter four briefly presents the power flow management system. Moreover it describes the dynamic design of the different subsystem components. Firstly the appropriate control of the different DC-DC converters is designed. This is followed by adscription of the proposed energy management system. Finally the validation of the system by simulation is presented, using models implemented in Matlab/Simulink software.
The chapter five describes the DSM methodology developed for this study in detail. Two main DSM techniques load shifting (LS) and demand side controls (DSC) are illustrated in detail within this chapter. Different levels of control algorithm suitable for historical demand, simulated demand and monitored real-time demand are also addressed respectively. In addition to that a case study is presented to assume the effectiveness of the developed DSM. The proposed DSM strategy is applied for zero emissions hybrid system for off grid house.
The chapter six test the efficacy of the proposed DSM for hybrid power system that consist of a conventional and a renewable energy sources. Moreover a second case study focuses on applying a modified DSM for medium rural health building located in the Sahara region is presented. Designing a suitable DSM for such facility is a critical issue because of the activity nature of such important facility. The modified version of the proposed DSM employ a combination of ON/OFF direct load control and fuzzy logic control strategy. Using these combinations of control minimize highly the impact on users and at the same time maximize the match between demand and supply through identifying the best control depending on many standers such as energy availability and occupancy.
Finally the last part of this thesis presents a general conclusion of the accomplished work and illustrates the different obtained results. More over a future work is suggested.
3. Contributions
The research carried out within the framework of this thesis lead to the following scientific publications
Background and research problem
1.1 Introduction
In this chapter the background, the problem statement, the purpose and the value of the study are discussed. At the beginning the general information about the study problem is introduced to give a brief overview of the treated subject. This is followed by a discussion on the specific objectives and the scope of this study. In addition, the procedures for the empirical study are listed and the outline of the study is revealed
1.2 Building, energy and environment
Global energy consumption has increased steadily for much of the twentieth century. According to the International Energy Agency, during the last two decades primary energy has grown by 49% and CO2 emissions by 43%, with an average annual increase of 2% and 1.8% respectively. Current predictions show that this growing trend will continue supported by the growing in the emerging economies (Middle East, Southeast Asia, South America and Africa). In the last decade coal was the source of energy with the largest growth. The use of oil and natural gas also had considerable growth, followed by hydro power and renewable energy. Renewable energy grew at a rate faster than any other time in history during this period, which can possibly be explained by an increase in international investment in renewable energy (Fig. 1.1) [1, 2].
Energy consumption grew most quickly in the transport, industry and building sectors (Fig. 1.2). In the last two decade the global energy use in the building sector increased by 19% to reach 92 EJ. Around 4 EJ (±15%) of this total consumer energy was from combustion of around 31 EJ of traditional biomass for cooking and heating, assuming efficiency of combustion was around 15% [3]. These increases were driven by strong growth in population, enhancement of building services and comfort levels, together with the rise in time spent inside buildings, have raised building energy consumption to the levels of transport and industry. The residential sector consumed over half of the total building energy demand followed by the commercial and public service buildings that slightly increased their share of the total since 1990.
Residential and commercial buildings account for almost 38 percent of the world Greenhouse gas emissions. Nearly all of the (GHG) emissions from the residential and commercial sectors can be attributed to energy use in building. Residential and commercial activities contribute to emissions in a variety of ways:
Combustion of natural gas and petroleum products for heating and cooking needs emits carbon dioxide (CO2), methane (CH4), and nitrous oxide (N2O). Emissions from natural
gas consumption represent about 81% of the direct fossil fuel CO2emissions from the
residential and commercial sectors. Coal consumption is a minor component of energy use in both of these sectors.
Organic waste sent to landfills emits CH4.
Wastewater treatment plants emit CH4and N2O.
Fluorinated gases (mainly hydro fluorocarbons, or HFCs) used in air conditioning and refrigeration systems can be released during servicing or from leaking equipment.
Historically the majority of emissions emanated from developed countries, it is expected that in the near future the level of emissions from buildings in rapidly industrializing countries will surpass emission levels from buildings in developed countries. Emission reductions from buildings can be achieved by reducing emissions from the energy supply or by reducing energy consumption through improved building design, increased energy efficiency and conservation, and other mechanisms that reduce energy demand in buildings.
Fig. 1.2. World energy consumption in the transport, industry and building sectors
1.2.1 Energy consumption of the building in Algeria
During the last two decades the electrical energy consumption in Algeria has increased significantly, recent studies expected that electrical energy consumption will rise to 83 TWh by 2020 and up to 150 TWh by 2030 [ ]. Algeria depend strongly on hydrocarbons, the natural gas is the principal source of energy with 94% of the electrical energy coming from it. Some research expect that th
1% comes from other renewable energy source (mainly wind and solar energy). On the other hand, current research forecast that the natural gas will only be available over the next 70 years Consequently Algeria faces a big challenge to change it dependence on fossil fuels toward the renewable energy.
Fig 1.3. Energy usage in Algeria
The residential sector is the largest sector of energy usage namely 43%, followed by the transport sector (36%) and the industry 21% (Fig. 1.3) [5]. There are a lot of factors that drive the increasing in energy demand in this sector such as:
The important increase of population and housing. Increase number of electricals equipment
Use of non-economic electricals equipment such as incandescent lamps and cheap air conditioners.
Absence of awareness and lack of culture on the energy control.
Growing desire of people to comfort and the low prices of conventional energy.
Thus, the increase in energy demand has put ever-increasing pressure on identifying and implementing ways to save energy. Within this context, the development of energy efficiency standards for home appliances is part of the National Energy Efficiency Program of the Algerian Ministry of Energy and Mines. The energy efficiency law outlines the general rules concerning the energy efficiency of home appliances operating on electricity, gas and petroleum products. Moreover the integration of the different renewable energy technology (solar, wind, geothermal and biomass) in buildings as well as effective engineering applications can potentially contribute towards energy provision for this sector and help move the country towards a more sustainable position in terms of energy provision and consumption [6].
1.3 Renewable Energy Integration in Buildings
Concerning the building sector, the RE technologies can be integrated in electric power systems, heating and cooling networks and gas grids or by installing directly and integrated into the building structure.
The opportunities of the integration of different RE technologies throughout the building depend mainly on the life span of the building. Many buildings in developed countries have average life spans of 120 years and above, hence energy efficiency measures and the integration and deployment of RE technologies will need to result mainly from the retrofitting of existing buildings. Developing countries currently have stock turnover rates of 25 to 35 years on average with relatively high new building construction growth, which offering a good opportunities to integrate RE technologies through new building designs. Moreover, greater integration of RE into the built environment is depend else on how urban planning, architectural design, engineering and a combination of technologies can be integrated [3]. Therefore, the renewable energy technologies assessment process must subject to many criteria such as:
The availability of renewable energy resources: Renewable energy technologies depend strongly on resources like sunlight, wind, biomass, or heat from the earth.
The space availability: additional space may be required by many type of technologies either on a roof or on land,
The costs of the technology: this include the cost of energy generated by the technology and any financial incentives like grants, favorable tariffs, etc.
Building architect characteristics.
The Ability to connect to the grid, which answer the equation of what size and type of technologies can be interconnected economically.
The existing of technical support: This important criteria include the existing of the technical support in the emergency case and the availability of the technology in the local market which include if the technology is classified as locally Manufactured or Imported
various technologies according to these goals.
Additional criteria: the additional factors which can effect on the decisions making include energy security.
Various RE technologies can be install to fulfill the energy requirement of the building such as: solar thermal, solar cooling systems and hybrid technologies such as combining solar thermal with biogas boilers, heat pumps, Fuel cell, small wind turbine and PV systems. These various technologies are intended to provide a variety of basic energy services including for:
Space heating, water heating, cooking Cooling, refrigeration
Lighting, electronic and electrical appliances Water pumping and waste treatment
Reducing energy demand for heating and cooling represents one of the most important issue of integrating RE within the building. For both heating and cooling, the design of a building can contribute to lowering the energy demand, optimization of window surfaces, and insulation levels can contribute to reduce the demand for heating as well as facilitating natural lighting. In warm climates where cooling loads dominate adapting bio-climatic principles of traditional designs to new building stock, such as extensive shading and natural ventilation, can contribute to
decreasing energy demand [3]. Moreover the additional costs of integration RE must be minimize to meet the regulation and exemplifies the links between RE and efficiency.
In order to achieve an efficient integrating of RE technologies, the efficiency of the electrical appliances must be improved. For example using light-emitting diodes and energy smart electronic appliances can contribute to reduce energy demand. In dwellings currently without access to electricity even for basic lighting, installing RE technologies such as small PV systems or micro-hydropower can be relatively expensive. So electricity demand should be minimized by use of energy efficient appliances such as LEDs. In addition to that the smart energy management systems can play very important role in the improving of the energy usage and efficiency.
1.4 Energy and load side management techniques in the building
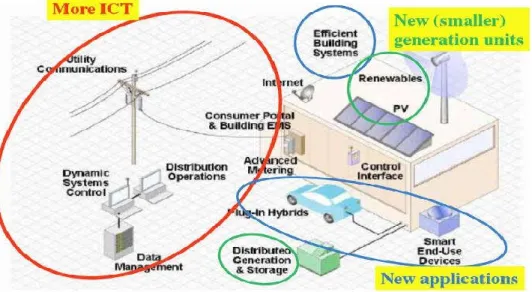
An energy management system for a commercial, a service or a multi-unit apartment building is mainly responsible for multiple objectives including the effective integration of different RE technologies, dynamic system control, data management, grantee maximum comfort level for those living or working in the building with minimum use of energy, managing energy use throughout load side management techniques and reducing environmental impacts, all for minimal cost (Fig. 1.4). Measuring and monitoring both energy use and the building environment are usually required. Monitoring techniques can also be deployed in apartment buildings with home energy management standard technologies installed to control and actuate appliances as part of a distributed energy network.
Energy demand management, also known as demand side management (DSM), entails actions that reduce or shift the energy consumption through efficiency improvements or load shifting on the customer side of the electrical meter, during periods when energy - supply systems are constrained. In fact by reducing the overall load on an electricity network, DSM has various beneficial effect including:
Increasing system reliability.
Mitigating electrical system emergencies. Reducing the number of blackouts.
Reducing depends on expensive import of fuel.
Reducing energy price and reducing the harmful emissions to the environment. Achieve a significant economic benefits.
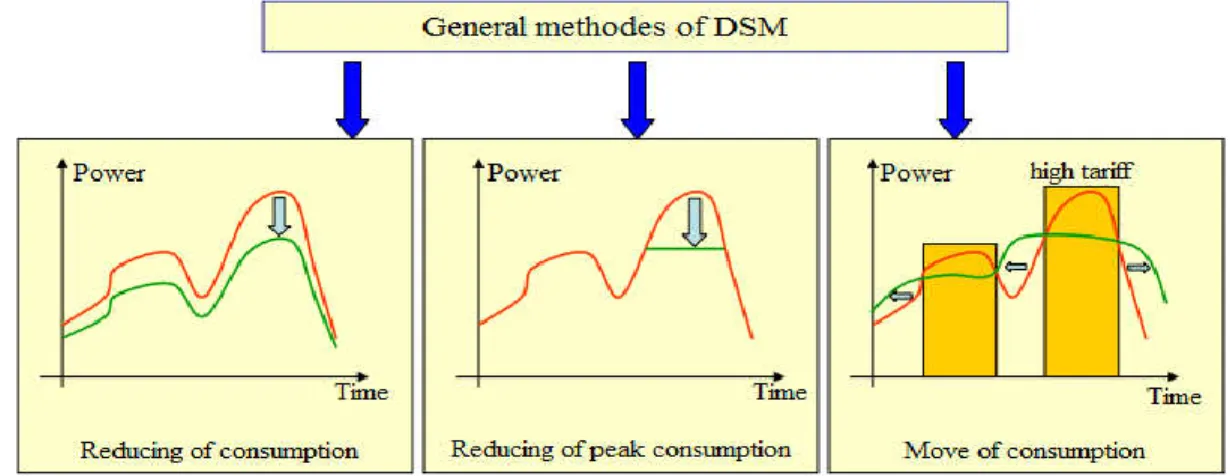
Usually the DSM techniques shared three common objectives, which can be presented as (Fig. 1.5):
a) Reducing of energy consumption
b) Reducing demand through more efficient processes, buildings or equipment (amplitude modulation load mode)
c) Changing the load pattern and move the energy consumption from ON to OFF peak period (time shifting load mode)
Fig. 1.5. General method of DSM
The DSM achieve the last mention goals throughout various techniques, the main types of DSM techniques maybe classified in main three categories [7]:
Load shedding (shifting): This technique can reduce the peak power demand by an intelligent control of the residential appliance. The reduction in the energy cost and in the co2 emission can be varied in the range of 10-50% depending in the load shifting percentage.
Load time shifting load: This technique move the energy consumption from more expensive energy tariff periods to less expensive one or from ON to OFF peak period.
Time programming: This technique allows to control the opening and closing of the appliances based on the occupancy and use of place.
1.5 Problem statement and research objectives
Today, buildings are responsible for more than 40 % of global energy used, and as much as one third of global greenhouse gas emissions, both in developed and developing countries. Furthermore, the Buildings and Construction Sector is also responsible for significant GHG emissions such as halocarbons, CFCs, and hydro fluorocarbons (HFCs). In order to achieve the maximum level of emission reductions the renewable energies will have to play a much bigger role in meeting energy needs in buildings. This can be achieved through two avenues: first, by substituting fossil fuels with renewable energy sources at the point of electricity generation; and second, through the use of different DSM techniques at the point of consumption.
A transition from a fossil fuel-based, centralized energy supply system to a more distributed energy system with increased RE integration would need a comprehensive revision of how urban space has been traditionally planned and occupied and the RE resources availability. Changes in land and resource use, as well as modifying planning regulations to better accommodate RE technologies with the existing energy supply, are major strategic amendments that could be made to shape their integration. Moreover the technical challenges of integrating variable and distributed RE power and heat generation can be partly resolved by the smart use of appliances in buildings. Technological advances can assist the integration of RE into the built environment, including energy storage technologies, real-time smart meters, demand side management and more efficient systems. Properly managed, appliances could contribute to maintaining the supply/demand balance of the energy system especially at higher penetration levels of variable RE sources.
The integration of multi-source energy system in building must pass through several important stages. The optimal sizing of the system includingfeasibility and reliability analysis is considered to be one of the most important stage in the RE technologies integration. The economic and the
evaluated according to different criteria such as, technology options, component costs, and resource availability. Moreover the successful RE integration require an advanced energy manager that provides overall control of the power system and sets the power reference for the different converters that control the power system components. Furthermore the RE integration efficiency can be highly improved by the use of load side management techniques which can reduce highly the stress on the energy system and increase the energy balance.
The main aim of this work is to develop an energy management system (EMS) that control the use of renewable energy technologies at the point of local electricity production of the energy needed by an OFF grid building, The main objectives of the EMS are:
Achieve an efficient integration of RE technologies in the building. Increases the reliability of the system and improves its energy balance.
reducing energy consumption and reducing the harmful emissions to the environment Achieve a significant economic benefits.
In addition to that the EMS employs an advance load management techniques to adjust the energy consumption within the building and to reduce the harmful emissions to the environment.
The energy management system effected the overall system control throughout two different time interval, the first one is a real-time dynamic control. In this time interval, the power references for each source is calculated according to dynamic power flow within the system, while the second one is a long time interval that concerns the demand side control. In this time interval the EMS manages the load profile of the building under study in order to increase the service life of the system component, reduce the energy consumption and the operation cost.
The developed EMS is applied mainly for zero emissions hybrid energy system includes a photovoltaic panel, a fuel cell, an electrolyzer, a lead acid battery bank and a supercapacitor. The hybrid power system has been tested by simulation using models implemented in Matlab/Simulink software. The simulation is performed over a short and a long period of time in order to evaluate the performance of the dynamic controllers and the effectiveness of the management strategy. For a long simulation period, a house located in the province of Batna
deep study on real load profile for an average house with all required weather data with respect to the location. Moreover a second case study is added for a hybrid power system that consist of a conventional and a renewable energy sources. The second case study focuses on the applying the proposed DSM on a (photovoltaic wind diesel) hybrid system for medium rural health building located in the Sahara region. The main aim of the presented second case study is to test the efficacy of the proposed DSM for such hybrid power system The simulation results confirm the efficiency of the proposed EMS, as it increases the energy reliability of the power system, reduce the GHG emission in the case of second case study and minimize highly the operation cost of the systems.
1.6 References
[1] Perez-Lombard L, Ortiz J, Pout C. A review on buildings energy consumption information. Energy and Buildings 2008; 40:394 398.
[2] International energy agency (IEA). Key world energy statistics 2014.
[3] Sims, R., P. Mercado, W. Krewitt, G. Bhuyan, D. Flynn, H. Holttinen, G. Jannuzzi, S. Khennas, L. J. Nilsson, J. Ogden, K. Ogimoto, H. Outhred, Ø. Ulleberg, F. van Hulle. Integration of Renewable Energy into Present and Future Energy Systems. In IPCC Special Report on Renewable Energy Sources and Climate Change Mitigation, Cambridge University Press, Cambridge, United Kingdom and New York, NY, 2011,USA.
[4] Menani S. Algeria Renewable Energy Program Outlook and applications. Energy week 2012, Finland.
[5] Ghedamsi R, Settou N, Gouareh A, Khamouli A, Saifi N, Recioui B. Estimating the energy consumption in building sector in Algeria using bottom-up mode. 6th International Renewable Energy Congress (IREC) 2014.
[6] Algerian Renewable Energy and Energy Efficiency Program, 2012.
Ky LE. A Dissertation
Submitted in Partial Fulfillment of the Requirements for the Degree of Doctor of Philosophy in Electrical Engineering, Polytechnic Institute of Grenoble, France 2008.
System Modeling
2.1Introduction
This chapter briefly presents the system components description and modeling. Chosen appropriate model is extremely important to effectively manage and control the energy flow within the system. The chosen models must allow us to specify the structure or the behavior of the system and represents a template that guides in the system constructing and in the decisions making.
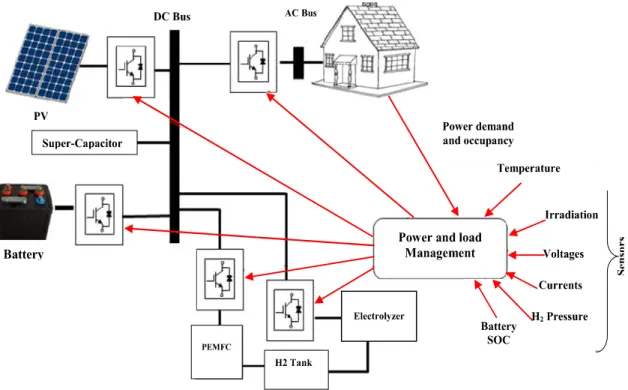
2.2Fundamental on the hybrid system
Fig. 2.1 shows the proposed structure of the hybrid power system (HPS). The different system are linked to a common DC bus through appropriate DC-DC power converters and assumed to be controlled by independent control system. The PV array is the primary source of the HPS, it is connected to the DC bus through DC-DC boost power converter, which achieves the PV Maximum Power Point Tracking (MPPT) control. The FC is sized to be the main backup source when the power generated by the PV or stored in the battery is insufficient to support the loads. It is connected to the DC bus through DC-DC boost converter Generally a FC is characterized by its high efficiency and reliability, but its dynamic is limited by the hydrogen/oxygen delivery system. Therefore, a fast response auxiliary power source is needed to compensate its slow dynamic, which can be achieved by the utilization of supercapacitor bank. The electrolyzer is connected to the DC bus via DC-DC buck converter, when the battery is fully charged the excess power is transferred to the electrolyzer unless the H2 storage tank is full. The battery bank is
mainly sized to support the low power demand, it is connected to the DC bus via bidirectional converter, which is controlled to follow the reference of charge or discharge current and to regulate the DC bus voltage (or super-capacitor SOC). The super-capacitor (SC) is directly connected to the DC bus in order to compensate the slow dynamic of the FC and support the sharp load. The SC has a greater power density, which allows it to supply the power over a short period [21]. Utilizing the super capacitor has many advantages, such as reducing the size of the battery, improving the performance of the FC and stabilizing the DC bus voltage under fast load changes.
Fig. 2.1 Hybrid system structure
2.3 PV principle of operation and modeling:
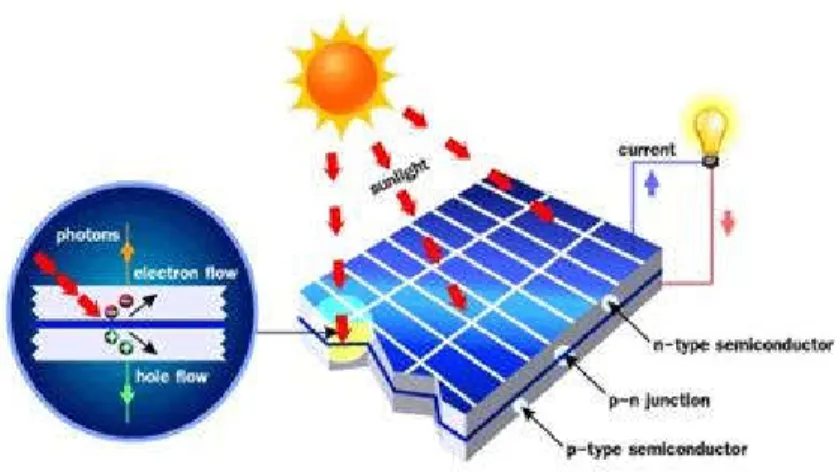
The photovoltaic (PV) power technology uses semiconductor cells (wafers), generally several square centimeters in size. From the solid-state physics point of view, the cell is basically a large area PN diode with the junction positioned close to the top surface. The cell converts the sunlight into direct current electricity. Numerous cells are assembled in a module to generate required power. Unlike the dynamic wind turbine, the PV installation is static, does not need strong tall towers, produces no vibration or noise, and needs no cooling.
All PV cells work in essentially the same way. Like diode (Fig 2.2) they contain a junction between two different materials which there is an electric field. When the cell absorbs light mobile electrons and holes are created. This flow of opposite directions across the junction, in this way the flow of absorbed photons is converted into a flow of DC power from the illuminated cell.
Fig. 2.2. Construction of the solar cell
2.3.1 PV model
Several PV models have been reported in literature. Such models normally consist in non-linear equations due to the physical variables involved in the PVM operation.
The non-linear models are useful for electrical simulation purposes and energy harvesting evaluation, but they introduce a high complexity in terms of control systems analysis and design. The photovoltaic system can be modeled by a current source, a diode and a combination of a series and a parallel resistance. The output current of the cell can be given by [1, 2]:
1 ) ( ) ) ( ) ( ( exp ) ( ) ( t KT A R t I t V q t I t I I c s pv pv rs ph PV (2.1) where is the photocurrent, is the cell reverse saturation current, is the voltage level on the PV cell terminals, q is the electron charge, is the intrinsic cell resistance, is the cell deviation from the ideal pen junction characteristic, K is the Boltzman constant and T is the cell temperature. The photocurrent of the PV cell can be expressed as [1]:
(2.2) Where Iscis the short-circuit cell current, Klis the short-circuit current temperature coefficient
and is the insolation in (mW.cm-2). The reverse saturation current is mainly depends on the
temperature and it can be expressed as:
Where Ior is the reverse saturation current at the reference temperature Tref and Ego is the
band-gap energy of the semiconductor used in the cell. The simulation parameters of the solar system are summarized in Table 2.1.
Table 2.1 Parameters of the solar system
Parameters Value Q 1.6×10⁻¹⁹C 1.6 1.3805×10⁻²³ NmK-1 0.0017A°C-1 2.0793×10⁻⁶A 301.18K 1.10
2.4 Fuel cell principal of operation
Fuel cells (FC) are electrochemical devices that convert the chemical energy of a gaseous fuel directly into electricity. FC are widely regarded as a potential alternative stationary and mobile power source [3]. Proton exchange membrane (PEM), also known as polymer electrolyte membrane fuel cell that use hydrogen is considered to be one of the most common type of the FCs, it can be used for commercial stationary power generation, residential applications, and transportation technologies, because it has high power density, solid electrolyte, long cell and stack life, as well as low corrosion. PEM fuel cells operate in the temperature range of 50 to 100°C which allow safer operation and eliminates the need for thermal insulation. Using pure hydrogen as fuel can eliminate local emissions problems in densely populated urban environments, where the hydrogen can be generated based on renewable energy from wind, water, and solar energy. A PEM fuel cell consists of a polymer electrolyte sandwiched between two electrodes. The electrolyte has a special property that allows positive ions (protons) to pass through while blocking electrons. Hydrogen gas passes over one electrode, called an anode, and with the help of a catalyst, separates into electrons and hydrogen protons (Fig 2.3) [3].
The electrolyte polymer membrane permits transfer of protons, enabling the electrons to flow through an external circuit before recombining with protons and oxygen at the cathode to form water [3].
(2.4) The overall reaction of the fuel cell is therefore.
(2.5) The electrical characteristics of fuel cells are normally given in the form of a polarization curve which is a relation of cell voltage versus cell current density (current per unit cell active area). The voltage produced from one cell is between 0 and 1 volts [3] depending on fuel cell operating conditions and the size of the load connected to the fuel cell. The voltage decreases as more current is drawn from the fuel cell, due to fuel cell electrical resistance, inefficient reactant gas transport, and low reaction rate. Lower voltage indicates lower efficiency of the fuel cell. The loss in the cell turns into heat which can damage the polymer membrane. Many cells are typically combined in a stack to satisfy the power requirements of the targeted application.
2.4.1 FC modeling
The PEMFC is modeled, according to the relationship between the output voltage and the partial pressure of hydrogen, oxygen, and water. The detailed model is shown in Fig. 2.4. The relationship between the partial pressure of hydrogen with it molar flow can be given as [4]:
(2.6) Where is the input molar flow of hydrogen [kmol/s], is the hydrogen partial pressure [atm], is the anode valve constant , is the molar mass of hydrogen [kg kmol-1] and is the hydrogen valve molar constant [kmol/(atm s)]. Using the perfect gas equation, the derivative of the partial pressure can be calculated as [4]:
(2.7)
Where is the universal gas constant [J/(kmol K)], is the absolute temperature [K], is the volume of the anode [m3] , hydrogen input flow [kmol/s], hydrogen
output flow [kmol/s] and is the hydrogen reacted flow [kmol/s], which can be expressed as [4]:
(2.8)
Where number of series fuel cells in the stack, number of stacks used in the
FC power plant, is the is
the modeling constant [kmol/(s A)]. Using Eqs. (5) and (6), the hydrogen partial pressure can be
expressed in the (s) domain as [5]:
(2.9)
Where is the hydrogen time constant [s], and it can be expressed as:
(2.10)
The PEMFC polarization curve is obtained from , the activation over voltage ( , and the ohmic over voltage ( . Assuming constant temperature and oxygen concentration, the FC output voltage can be expressed as [6]:
(2.11) Where
(2.12) and
(2.13) where B and C are constants, and is the FC internal resistance [U]. In term of gas molarities, the Nernst voltage is given as [4]:
(2.14)
Where is the water partial pressure [atm]. The amount of the hydrogen consumed by the FC is mainly determined by the power demand. The hydrogen flow rate is controlled, according to the output power of the FC system, where FC output current is taken back to the input while
converting the hydrogen into molar form. The amount of hydrogen flow required to meet the load is given as [5]:
(2.15)
Where U is the utilization rate. The FC model parameters are summarized in Table 2.2.
Fig. 2.4 PEMFC model Table 2.2 FC model parameters
Parameters value
Activation voltage constant (B) 0.04777 [A-1]
Activation voltage constant (C) 0.0136 [V] Conversion factor (CV) 2
96484600 [kmol/(atm s)] Hydrogen time constant 3.37 [s]
Hydrogen valve constant 4.22×10⁻⁵[kmol/(atm s)]
Hydrogen oxygen flow ratio (rH O) 1.168
Kr constant =No/4F 2.2802×10⁻⁷ [kmol/(s A)]
No load voltage (Eo) 0.5 [V] Number of cells (No) 88 Number of stacks (NS) 1 Oxygen time constant 6.74 [s]
Oxygen valve constant 2.11×10⁻⁵[kmol/(atm s)]
FC system internal resistance (Rint)
FC absolute temperature (T) 343[K] Universal gas constant (R) 8314.47
Utilization factor (U)
Water time constant [s] Water valve constant 7.716×10⁻⁶[kmol/(atm s)]
2.5 Electrolyzer principal of operation and modeling
An electrolyzer is an electrochemical device that convert electricity and water into hydrogen and oxygen by passing a current through a water in the presence of suitable substances, called electrolytes. Electric current causes positively charged hydrogen ions to migrate to the negatively charged cathode, where a reduction takes place in order to form hydrogen atoms. The atoms formed then combine to form gaseous hydrogen molecules (H2). On the other hand, oxygen is formed at the other electrode (the positively charged anode (Fig 2.5)).
) ( 2 ) ( 2 ) ( 2 2 1 gas gas
liquid electrical energy H O O
H (2.16)
Fig. 5 PEM electrolysis reactions.
Usually the PEM electrolyzer utilizes a solid polymer as electrolyte (SPE) to conduct protons from the anode to the cathode while insulating the electrodes electrically.
2.5.1 Electrolyzer model
law, the rate of hydrogen production is directly proportional to the electrical current in the equivalent electrolyzer circuit and it can be given by [7, 8]:
F i n F G e H 2 . . 2 (2.17)
Where is the Faraday efficiency, is the number of electrolyzer cells in series and is the electrolyzer current [A]. Generally, there is a difference between the real flow rate of hydrogen and the theoretical one
(2.18) Fig. 2.6 illustrates a simple electrolyzer model that developed based on Eqs. (2.17) and (2.18).
Fig. 2.6. Electrolyzer model
2.5.2 Hydrogen storage model
The Hydrogen storage system is necessary to make the balance between the hydrogen produced by the electrolyzer and consumed by the PEMFC. Eq(2.19) describes the hydrogen storage model, this model calculates the tank pressure based on the hydrogen flow. The dynamics of the storage system can be expressed as [9]:
(2.19)
where is the hydrogen tank pressure [Pascal], Pbi is the initial pressure of the hydrogen
tank [Pascal], z is the compressibility factor as a function of pressure, NH2is the hydrogen moles
per second delivered to the storage tank [kmol/s], Tb is the operating temperature [K] and Vbis
the volume of the tank [m3].
In this model all supplementary power requirements such as pumps, valves were ignored. The Simulink version of the hydrogen storage model is shown in Fig. 2.7.
Fig. 2.7. Hydrogen storage model
2.6 Lead-acid battery and it Principle
Lead-acid batteries consist of multiple individual cells, each with a nominal voltage of 2V. Connecting the cells in series or parallel, different system voltages and capacities can be created. The Anode is lead (Pb), the cathode oxide lead (PbO2) and electrolyte used is dilute sulfuric acid
(H2SO4).In the discharged state both the positive and negative plates become lead sulfate (PbSO4)
and the electrolyte loses much of its dissolved sulfuric acid and becomes primarily water (Fig 2.8). The discharge process is driven by the conduction of electrons from the negative plate back into the cell at the positive plate in the external circuit. The total reaction can be written:
Pb + PbO2+ 2H2SO4 4+ 2H2O (2.20)
Fig. 2.8. Discharge process
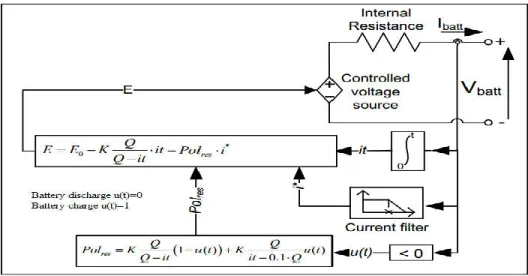
2.6.1 Battery modeling
Mainly there are three types of battery models presented in the literature, specifically: experimental, electrochemical and electric circuit-based. Experimental and electrochemical models are not well suited to represent cell dynamics for the purpose of state-of charge estimations of battery packs. However, electric circuit-based models can be useful to represent
electrical characteristics of batteries. The simplest electric model consists of an ideal voltage source and a resistor r in series connection as the internal resistance. However, this model, does not take into account the battery SOC. There is another model based on an open circuit voltage in series with a resistance and parallel RC circuits with the so-called Warburg impedance [10]. The identification of all the parameters of this model is based on a rather complicated technique called impedance spectroscopy. Shepherd developed an equation to describe the electrochemical behavior of a battery directly in terms of terminal voltage, open circuit voltage, internal resistance, discharge current and state-of charge [11], and this model is applied for discharge as well as for charge. The battery was modeling based on a modified Shepherd curve fitting model, where an additional term (voltage polarization) is added to the battery discharge voltage expression to better represent the effect of the battery SOC on the battery performance. Also, to ensure the simulation stability, a filtered battery current instead of the actual battery current, is used to account for the polarization resistance. Similar to the fuel cell model, the model parameters are easily derived from datasheets or simple dynamic tests. The battery discharge voltage equation is expressed as [12]
(2.21)
Where is the battery constant voltage (V), is the battery current (A), k is the polarization constant (Ah 1) or polarization resistance (Ohms), Q is the battery capacity (Ah), is the actual battery charge (Ah), is the filtered current (A) and
is the exponential zone voltage (V).
The term from Eq. 5 is referred as polarization voltage while the term is the polarization resistance ( ). During charging, the battery voltage increases abruptly after being fully charged, this behavior is represented by modifying the polarization resistance (only during charging) as follows:
(2.22)
As a results the charge voltage equation can be expressed as:
Fig 2.9. Battery model
2.7 Supercapacitor
A supercapacitor (SC) (sometimes ultra-capacitor, formerly electric double-layer capacitor (EDLC)) is a high electrochemical capacitor. It can typically store 10 to 100 times more energy per unit volume or mass than electrolytic capacitors, can accept and deliver charge much faster than batteries, and tolerate many more charge and discharge cycles than rechargeable batteries. Supercapacitor are used in applications requiring many rapid charge/discharge cycles rather than long term compact energy storage [13].
The SC is mainly designed depending on the phenomenon called electric double layer whereby electricity is stored where a solid and a liquid come into contact. Concretely, the structure of an electric double-layer capacitor involves two electrodes made by forming active carbon into thin sheets that are separated by a semi-permeable membrane called a separator and placed in an electrolyte solution such as diluted sulfuric acid (Fig 2.10). The electrodes are subjected to a low voltage (about 0.8 volts) that does not cause electrolysis of electrolyte, this therefore results in ions rapidly being stored on the surface of the active carbon [13, 14].
Fig 2.10 Typical construction of a supercapacitor: 1) Power source, 2) Collector, 3) Polarized electrode, 4) Helmholtz double layer, 5) Electrolyte having positive and negative ions, 6) Separator.
2.7.1 Supercapacitor model
The EL is modeled based on the Stern model, which combines the Helmholtz and Gouy Chapman models [ ]. The capacitance of a SC cell can be given by [15]:
1 ] 1 1 [ H GC C C C (2.24) where (2.25) and (2.26)
where CGC and CH are the Helmholtz and Gouy-Chapman capacitance [F] respectively, F is
the Faraday constant, Qc is the cell electric charge [C], Ne is the number of electrode layers, R is
the ideal gas constant, Ai is the interfacial area between electrodes and electrolyte [m2] , and o
are the (F/m) of the electrolyte material and free space respectively, C is the molar concentration [mol.m 3] and d is the Helmholtz layer length (or molecular radius) [m]. The total
capacitance of SC module consist of Np cells in parallel and Ns cells in series can be expressed as:
The supercapacitor output voltage is expressed considering resistive losses as:
sc SC T P SC R i C Q V (2.28) with (2.29)
where QT is the total electric charge [C], RSC
Fig. 2.11. Supercapacitor model
The MATLAB simulation parameters of the SC are summarized in Table 2.3.
Table 2.3. SC MATLAB simulation parameters
Parameters Value
Rated capacitance (F) Equivalent DC series resistance
(Ohms)
2.1e-3
Rated voltage (V) Number of series capacitors Number of parallel capacitors
Initial voltage (V)
Leakage current (A) 5.2e-3 Operating temperature (Celsius)
Number of layers
Molecular radius (m) 1.23e-9 Over potential (V) 0.3 Charge transfer coefficient alpha 0.3
2.8 Modeling of the power converters
2.8.1 Modeling of the DC-DC bidirectional converter
The bi-directional DC-DC buck-boost converter is used to interlink the battery with the DC bus. Fig 2.12 shows the power circuit and the voltage-current direction for boost-buck operation mode of the converter. Each mode of operation is characterized with two intervals coincide with the conducting of appropriate IGBT or diode [16, 17].
In boost mode of operation the IGBT Q1 is in OFF condition. The IGBT Q2 is conducting through the first interval and the diode D1 is conducting during the second interval, choosing the voltage over the capacitor V1, V2 and the current through the inductor as state variable the average model can be given as follows:
2 3 2 2 2 2 2 2 2 2 2 1 2 1 2 1 1 1 1 1 1 ) 1 ( ) 1 ( C I R C V C I dt dV L V L V dt dI C I R C V C I dt dV (2.30)
In buck mode of operation the IGBT Q2 is in oFF condition. The IGBT Q1 is conducting through the first interval and the diode D2 is conducting during the second interval, the state average model can be given as follows:
2 3 2 2 2 1 2 2 2 2 1 1 2 1 2 1 1 1 1 1 1 C I R C V C I dt dV L V L V dt dI C I R C V C I dt dV (2.31) With:
2.8.2 Boost Converter Modeling
The PV panel and the FC are connected to the DC bus through a DC-DC boost power converter, which achieves the PV and the FC control. The boost converter electric scheme is illustrated in Fig. 2.13. L C R Q iL Vin VDCBUS D +
Fig. 2.13. DC-DC Boost Converter
The state space average equations are used to model the converter as expressed in (30). By assuming continuous conduction mode, the state space average equations can be written on the time interval (0 < t < T ) as follows:
2 3 1 2 2 2 1 1 1 x u x x u x V x in (2.32) Where L 1
1 ; ; ;u (1 ) and x1 x2 iL VDCBUS .T is the switching period and is the duty cycle.
2.8.3 Buck Converter Modeling
The electrolyzer is connected to the DC bus through a DC-DC buck power converter (Fig. 2.14), which achieves its control. The state space average equations are used to model the converter as expressed in (2.33).
Fig. 2.14. Buck converter
2 3 1 2 2 2 1 1 1 x x x x u V x in (2.33) where L 1 1 ; C 1 2 , RC 1 3 ; u= and x1 x2 iL VDCBUS
2.8.4 DC/AC converter model
A mathematical model of a three-phase voltage-source inverter (VSI ) is presented based on a functional representation (Fig. 2.15). The inverter can be controlled using a switching function Ci
i= A, B, C , according to the following conditions [18, 19]:
if Ci 1, then K is OFF et i ' i K is ON if , then K is ON et i ' i K is OFF.
Fig. 2.15. Power circuit of a three-phase VSI.
At the outputs of the inverter the line-to-line voltages UAB, UBC, UCA can be derived as [18]:
Ao Co CA Co Bo BC Bo Ao AB V V U V V U V V U (2.34)
Since the phase voltages in a star connected load sum to zero, we can obtain the following relationship: BC CA Cn AB BC Bn CA AB An U U V U U V U U V 3 1 3 1 3 1 (2.35)
Phase-to-neutral voltages of a star-connected load are most easily found by defining a voltage difference between the star point n of the load and the negative rail of the dc bus o. Then the following correlation holds true:
Co no Cn Bo no Bn Ao no An V V V V V V V V V (2.36)
And we can deduce that:
Co Bo Ao no V V V V 3 1 (2.37) For ideal switching, the following relation can be obtained:
2 c c i io CU U V (2.38) With c C Co c B Bo c A Ao U C V U C V U C V 5 . 0 5 . 0 5 . 0 (2.39)
Substitution of (2.37) into (2.36) yields phase-to-neutral voltages of the load in the following form [30]: Co Bo Ao Cn Co Bo Ao Bn Co Bo Ao An V V V V V V V V V V V V 3 2 3 1 3 1 3 1 3 2 3 1 3 1 3 1 3 2 (2.40)
Replacing (2.39) with (2.40), we obtain the following relation:
C B A c Cn Bn An C C C U V V V 2 1 1 1 2 1 1 1 2 . 3 1 (2.41)
The inverter specifications are summarized in Table 2.4. The inverter control is implemented using Proportional-Integral controller using PWM techniques [20].
Table 2.4. Inverter specifications
Parameters Value
2.5kW 2.7kW Peak inverter efficiency 94-95.3%
Output frequency 49.8-50.2Hz
2.9 Conclusion
This chapter presented the system components description and modeling. The appropriate model for each component in the hybrid system was chosen. It started with the description and modulation of the PV cell, then the hydrogen system was fully described and modeled. Finally the different power converter that used in the power flow control within the system was modeled.
2.10 References
[1] Feroldi D, Rullo P, Zumoffen D. Energy management strategy based on receding horizon for a power hybrid system. Renewable Energy 2015; 75: 550-559.
[2] Alnejaili T, Drid S, Mehdi D, Chrifi-Alaoui L. Advanced Strategy of Demand-Side Management for Photovoltaic-Wind Energy System. The 15th International conference on Sciences and Techniques of Automatic control & computer engineering 2014, Hammamet-Tunisia,797-802.
[3] Jay T, Anna G, Peng H. Control of Fuel Cell Power Systems Principles, Modeling, Analysis and Feedback Design. Spring, London 2004.
[4] Padulles J, Ault G.W, McDonald J.R. An integrated SOFC plant dynamic model for power systems simulation. Journal of Power Sources 2000; 86(2):495 500.
[5] Lajnef T, Abid S, Ammous A. Modeling, Control, and Simulation of a Solar Hydrogen/Fuel Cell Hybrid Energy System for Grid-Connected Applications. Advances in Power Electronics 2013; 13:1-7.