DOI: 10.1140/epja/i2006-08-018-5
EPJ A direct
electronic only
(n, γ) cross-sections of light p nuclei
Towards an updated database for the p process
I. Dillmann1,2,a, M. Heil1, F. K¨appeler1, R. Plag1, T. Rauscher2, and F.-K. Thielemann2 1
Institut f¨ur Kernphysik, Forschungszentrum Karlsruhe, Postfach 3640, D-76021 Karlsruhe, Germany
2
Departement Physik und Astronomie, Universit¨at Basel, Klingelbergstrasse 82, CH-4056 Basel, Switzerland Received: 7 July 2005 /
Published online: 10 March 2006 – c° Societ`a Italiana di Fisica / Springer-Verlag 2006
Abstract. The nucleosynthesis of elements beyond iron is dominated by the s and r processes. However, a small amount of stable isotopes on the proton-rich side cannot be made by neutron capture and is thought to be produced by photodisintegration reactions on existing seed nuclei in the so-called “p process”. So far most of the p-process reactions are not yet accessible by experimental techniques and have to be inferred from statistical Hauser-Feshbach model calculations. The parametrization of these models has to be constrained by measurements on stable proton-rich nuclei. A series of (n, γ) activation measurements on p nuclei, related by detailed balance to the respective photodisintegrations, was carried out at the Karlsruhe Van de Graaff accelerator using the 7
Li(p, n)7
Be source for simulating a Maxwellian neutron distribution of kT = 25 keV. We present here preliminary results of our extended measuring program in the mass range between A = 74 and A = 132, including first experimental (n, γ) cross-sections of 74
Se,
84
Sr,120
Te and 132
Ba, and an improved value for130
Ba. In all cases we find perfect agreement with the recommended MACS predictions from the Bao et al. compilation.
PACS. 25.40.Lw Radiative capture – 26.30.+k Nucleosynthesis in novae, supernovae, and other explosive environments – 27.50.+e 59 ≤ A ≤ 89 – 27.60.+j 90 ≤ A ≤ 149
1 Introduction
Astrophysical models can explain the origin of most nu-clei beyond the iron group in a combination of processes involving neutron captures on long (s process) or short (r process) time scales [1,2]. However, 32 stable, proton-rich isotopes between74Se and196Hg cannot be formed in that way. Those p nuclei are 10 to 100 times less abundant than the s and r nuclei in the same mass region. They are thought to be produced in the so-called γ or p process, where proton-rich nuclei are made by sequences of pho-todisintegrations and β+ decays [3,4,5]. In this scenario, pre-existing seed nuclei from the s and r processes are destroyed by photodisintegration in a high-temperature environment, and proton-rich isotopes are produced by (γ, n) reactions. When (γ, p) and (γ, α) reactions become comparable or faster than neutron emission within an iso-topic chain, the reaction path branches out and feeds nu-clei with lower charge number Z. The decrease in temper-ature at later stages of the p process leads to a freeze-out via neutron captures and mainly β+ decays, resulting in the typical p-process abundance pattern with maxima at 92Mo (N = 50) and144Sm (N = 82).
a
e-mail: [email protected]
The currently most favored astrophysical site for the p process is explosive burning in type-II supernovae. The explosive shock front heats the outer O/Ne shell of the progenitor star to temperatures of 2–3 GK, sufficient for providing the required photodisintegrations. Following the nucleosynthesis in such astrophysical models, good agree-ment with the required p production is found, with the exception of the low (A < 100) and intermediate (150 ≤ A ≤ 165) mass range, which are underproduced by factors of 3–4 [6]. Currently, however, it is not yet clear whether the observed underproductions are due to a problem with astrophysical models or with the nuclear physics input, i.e.reaction rates. Thus, a necessary requirement towards a consistent understanding of the p process is the reduc-tion of uncertainties in nuclear data. By far most of the several hundreds of required photodisintegration rates and their inverses need to be inferred from Hauser-Feshbach statistical model calculations [7,8]. Experimental data can improve the situation in two ways, either by directly re-placing predictions with measured cross-sections in the relevant energy range, or by testing the reliability of pre-dictions at other energies when the relevant energy range is not experimentally accessible.
The role of (n, γ) reactions in the p process was un-derestimated for a long time, although it is obvious that they have an influence on the final p-process abundances.
Neutron captures compete with (γ, n) reactions and thus hinder the photodisintegration flux towards light nuclei, especially at lower-Z isotopes and even-even isotopes in the vicinity of branching-points. Rayet et al. [9] have stud-ied the influence of several components in their p-process network calculations. Their nuclear flow schemes show that branching points occur even at light p nuclei, and are shifted deeper into the proton-rich unstable region with increasing mass and temperature. In contradiction to Woosley and Howard [3], who claimed for their network calculations that (n, γ) can be neglected except for the lightest nuclei (A ≤ 90), Rayet et al. also examined the influence of neutron reactions for temperatures between T9= 2.2 and 3.2 GK by comparing overabundance factors if (n, γ) reactions on Z > 26 nuclides are considered or completely suppressed. As a result, the overabundances were found to change by up to a factor 100 (for 84Sr) if the (n, γ) channel was artificially suppressed. This rather high sensitivity indicates the need for reliable (n, γ) rates to be used in p-process networks.
The influence of a variation of reaction rates on the final p abundances has also been studied previously [10, 11]. It turned out that the p abundances are very sensitive to changes of the neutron-induced rates in the entire mass range, whereas the proton-induced and α-induced reac-tion rates are important at low and high mass numbers, respectively.
A third reason for the determination of neutron cap-ture rates of p nuclei are those cases where experimen-tal photodissociation rates are not accessible. The respec-tive astrophysical photodisintegration rate can then be in-ferred from capture rates by detailed balance [12]. This is the case for most stable p nuclei, which are separated from stable isotopes by a radioactive nucleus. While the reaction rateAX(γ, n)A−1X can be determined by brems-strahlung [13], the reactionA+1X(γ, n)AX has to be mea-sured via its inverse (n, γ) rate.
The present work comprises the first measurement of (n, γ) cross-sections for the p-process isotopes 74Se,84Sr, 120Te and 132Ba at kT = 25 keV, and a re-measurement of 130Ba. The direct determination of stellar (n, γ) rates requires a “stellar” neutron source yielding neutrons with a Maxwell-Boltzmann energy distribution. We achieve this by making use of the7Li(p, n)7Be reaction. In combination with the activation or time-of-flight technique, this offers a unique tool for comprehensive studies of (n, γ) rates and cross-sections for astrophysics.
2 Experimental procedure
All measurements were carried out at the Karlsruhe 3.7 MV Van de Graaff accelerator using the activation technique. Neutrons were produced with the7Li(p, n)7Be source by bombarding 30 µm thick layers of metallic Li on a water-cooled Cu backing with protons of 1912 keV, 30 keV above the reaction threshold. The resulting quasi-stellar neutron spectrum approximates a Maxwellian dis-tribution for kT = 25.0 ± 0.5 keV [14]. Hence, the proper
stellar capture cross-section can be directly deduced from our measurement.
For all activations natural samples of the respective element were used. The selenium and tellurium samples were prepared from metal granules, whereas for the bar-ium and strontbar-ium measurement thin pellets were pressed from powders of Sr(OH)2, SrF2, SrCO3and BaCO3. In or-der to verify the stoichiometry, the powor-der samples were dried at 300◦C and 800◦C, respectively. All samples were enclosed in a 15 µm thick aluminium foil and sandwiched between 10–30 µm thick gold foils of the same diameter. In this way the neutron flux can be determined relative to the well-known capture cross-section of197Au [14].
Throughout the irradiation the neutron flux was recor-ded in intervals of 1 min using a6Li-glass detector for later correction of the number of nuclei, which decayed during the activation. The activations were carried out with the Van de Graaff accelerator operated in DC mode with a current of ≈ 100 µA. The mean neutron flux over the pe-riod of the activations was ≈ 1.5 × 10⁹ n/s at the position of the samples, which were placed in close geometry to the Li target. The duration of the single activations var-ied between 3 h (for the partial cross-section to 85Srm, t1/2= 67.6 m) and 130 h (for determination of the 10.52 y ground state of 133Ba).
3 Data analysis
The induced γ-ray activities were counted after the ir-radiation in a well-defined geometry using a shielded Ge detector in a low background area. Energy and efficiency calibrations have been carried out with a set of refer-ence γ-sources in the energy range between 60 keV and 2000 keV. For the counting of the long-lived133Bag activ-ity (t1/2 = 10.52 y) two fourfold segmented Clover detec-tors in close geometry were used [15].
A detailed description of the analysis procedure is given in refs. [16,17]. The number of activated nuclei A can be written as
A(i) = Φtot Ni σi fb(i), (1) where Φtot=R φ(t)dt is the time-integrated neutron flux and Ni the number of atoms in the sample. The factor fb accounts for the decay of activated nuclei during the irra-diation time taas well as for variations in the neutron flux. As our measurements are carried out relative to197Au as
Table 1. Stellar enhancement factors for different tempera-tures [12].
T kT SEF SEF SEF SEF SEF
(GK) (keV) 74 Se 84 Sr 120 Te 130 Ba 132 Ba 0.3 26 1.00 1.00 1.00 1.00 1.00 2.0 172 1.01 1.02 1.10 1.23 1.16 2.5 215 1.02 1.06 1.18 1.33 1.22 3.0 260 1.03 1.09 1.25 1.42 1.28
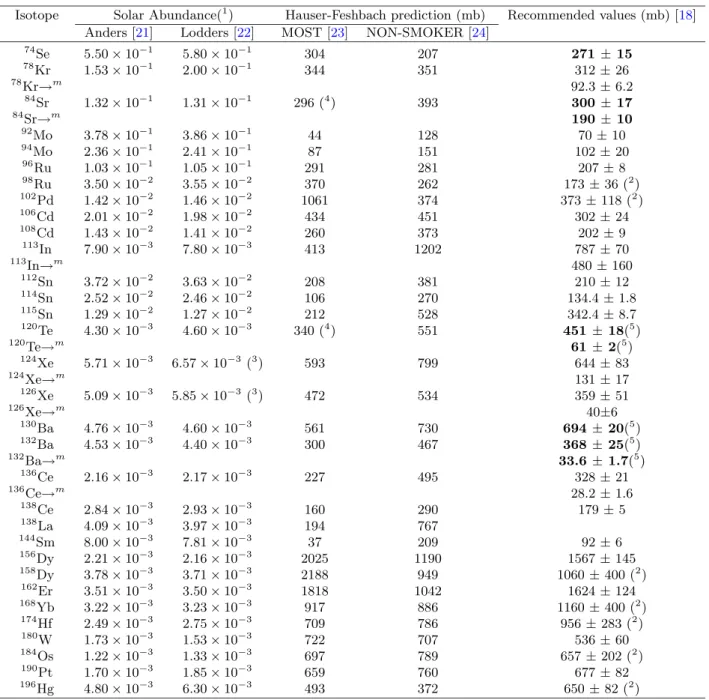
Table 2. Maxwellian averaged cross-sections hσi30of all 32 p-process nuclei at kT = 30 keV. Values taken from this work are
in bold. (1
) Relative to Si ≡ 106
. (2
) Rescaled NON-SMOKER cross-sections accounting for known systematic deficiencies in the nuclear inputs [18]. (3
) Xe abundances taken from ref. [19]. (4
) Modified values [20]. (5
) Preliminary cross-section. Isotope Solar Abundance(1
) Hauser-Feshbach prediction (mb) Recommended values (mb) [18] Anders [21] Lodders [22] MOST [23] NON-SMOKER [24]
74 Se 5.50 × 10⁻¹ 5.80 × 10⁻¹ 304 207 271 ± 15 78 Kr 1.53 × 10⁻¹ 2.00 × 10⁻¹ 344 351 312 ± 26 78 Kr→m 92.3 ± 6.2 84 Sr 1.32 × 10⁻¹ 1.31 × 10⁻¹ 296 (4) 393 300 ± 17 84 Sr→m 190 ± 10 92 Mo 3.78 × 10⁻¹ 3.86 × 10⁻¹ 44 128 70 ± 10 94 Mo 2.36 × 10⁻¹ 2.41 × 10⁻¹ 87 151 102 ± 20 96 Ru 1.03 × 10⁻¹ 1.05 × 10⁻¹ 291 281 207 ± 8 98 Ru 3.50 × 10⁻² 3.55 × 10⁻² 370 262 173 ± 36 (2) 102 Pd 1.42 × 10⁻² 1.46 × 10⁻² 1061 374 373 ± 118 (2) 106 Cd 2.01 × 10⁻² 1.98 × 10⁻² 434 451 302 ± 24 108 Cd 1.43 × 10⁻² 1.41 × 10⁻² 260 373 202 ± 9 113 In 7.90 × 10⁻³ 7.80 × 10⁻³ 413 1202 787 ± 70 113 In→m 480 ± 160 112 Sn 3.72 × 10⁻² 3.63 × 10⁻² 208 381 210 ± 12 114 Sn 2.52 × 10⁻² 2.46 × 10⁻² 106 270 134.4 ± 1.8 115 Sn 1.29 × 10⁻² 1.27 × 10⁻² 212 528 342.4 ± 8.7 120 Te 4.30 × 10⁻³ 4.60 × 10⁻³ 340 (4) 551 451± 18(5) 120 Te→m 61± 2(5 ) 124 Xe 5.71 × 10⁻³ 6.57 × 10⁻³ (3) 593 799 644 ± 83 124 Xe→m 131 ± 17 126 Xe 5.09 × 10⁻³ 5.85 × 10⁻³ (3) 472 534 359 ± 51 126 Xe→m 40±6 130 Ba 4.76 × 10⁻³ 4.60 × 10⁻³ 561 730 694± 20(5) 132 Ba 4.53 × 10⁻³ 4.40 × 10⁻³ 300 467 368± 25(5) 132 Ba→m 33.6± 1.7(5 ) 136 Ce 2.16 × 10⁻³ 2.17 × 10⁻³ 227 495 328 ± 21 136 Ce→m 28.2 ± 1.6 138 Ce 2.84 × 10⁻³ 2.93 × 10⁻³ 160 290 179 ± 5 138 La 4.09 × 10⁻³ 3.97 × 10⁻³ 194 767 144 Sm 8.00 × 10⁻³ 7.81 × 10⁻³ 37 209 92 ± 6 156 Dy 2.21 × 10⁻³ 2.16 × 10⁻³ 2025 1190 1567 ± 145 158 Dy 3.78 × 10⁻³ 3.71 × 10⁻³ 2188 949 1060 ± 400 (2) 162 Er 3.51 × 10⁻³ 3.50 × 10⁻³ 1818 1042 1624 ± 124 168 Yb 3.22 × 10⁻³ 3.23 × 10⁻³ 917 886 1160 ± 400 (2) 174 Hf 2.49 × 10⁻³ 2.75 × 10⁻³ 709 786 956 ± 283 (2) 180 W 1.73 × 10⁻³ 1.53 × 10⁻³ 722 707 536 ± 60 184 Os 1.22 × 10⁻³ 1.33 × 10⁻³ 697 789 657 ± 202 (2) 190 Pt 1.70 × 10⁻³ 1.85 × 10⁻³ 659 760 677 ± 82 196 Hg 4.80 × 10⁻³ 6.30 × 10⁻³ 493 372 650 ± 82 (2)
a standard, the neutron flux Φtot cancels out: A(i) A(Au) = σi Ni fb(i) σAu NAu fb(Au) ⇐⇒ σi = A(i) σAu NAu fb(Au) A(Au) Ni fb(i) . (2)
The reference value for the experimental 197Au cross-section in the quasi-stellar spectrum of the 7Li(p, n)7Be source is 586 ± 8 mb [14]. By averaging the induced ac-tivities of the gold foils, one can determine the neutron flux Φtot at the position of the sample and deduce the
ex-perimental cross-section σi of the investigated sample as shown in eq. (2).
4 Results and discussion
4.1 General
In an astrophysical environment with temperature T , the neutron spectrum corresponds to a Maxwell-Boltzmann distribution
Table 3.Decay properties of the product nuclei [25]. Isotopic abundances are from ref. [26]. Reaction Isot. abund. (%) Final state t1/2 Eγ (keV) Iγ(%) 74 Se(n, γ)75 Se 0.89 (0.04) Ground state 119.79 ± 0.04 d 136.0 58.3 ± 0.7 264.7 58.9 ± 0.3 84 Sr(n, γ)85 Sr 0.56 (0.01) Ground state 64.84 ± 0.02 d 514.0 96 ± 4 Isomer 67.63 ± 0.04 m 151.2 (EC) 12.9 ± 0.7 231.9 (IT) 84.4 ± 2.2 120 Te(n, γ)121 Te 0.096 (0.001) Ground state 19.16 ± 0.05 d 573.1 80.3 ± 2.5 Isomer 154 ± 7 d 212.2 (IT) 81.4 ± 1.0 130 Ba(n, γ)131 Ba 0.106 (0.001) Ground state 11.50 ± 0.06 d 123.8 29.0 ± 0.3 216.1 19.7 ± 0.3 373.2 14.0 ± 0.2 496.3 46.8 ± 0.2 132 Ba(n, γ)133 Ba 0.101 (0.001) Ground state 10.52 ± 0.13 y 356.0 62.1 ± 0.2 Isomer 38.9 ± 0.1 h 275.9 (IT) 17.8 ± 0.6
The experimental neutron spectrum of the7Li(p,n)7Be reaction approximates a Maxwellian distribution with kT = 25 keV almost perfectly [14]. But to obtain the exact Maxwellian averaged cross-section hσikT = hσυiυT for the temperature T , the energy-dependent cross-section σ(E) has to be folded with the experimental neutron distribu-tion to derive a normalizadistribu-tion factor N F = σ
σexp. The
normalized cross-section in the energy range 0.01 ≤ En ≤ 4000 keV was used for deriving the proper MACS as a function of thermal energy kT :
hσυi vT = hσikT = 2 √ π R∞ 0 σ(En) N F En e −En/kT dE n R∞ 0 En e−En/kT dEn . (4) In this equation, σ(En)
N F is the normalized energy-dependent capture cross-section and En the neutron en-ergy. The factor υT =p2kT/m denotes the most proba-ble velocity with the reduced mass m.
Maxwellian averaged cross-sections have to be cor-rected by a temperature-dependent stellar enhancement factor
SEF (T ) = σ star
σlab . (5)
The stellar cross-section σstar =P µ
P
νσµν accounts for all transitions from excited target states µ to final states ν in thermally equilibrated nuclei, whereas the laboratory cross-section σlab = P
0 P
νσ0ν includes only captures from the target ground state. In the investigated cases the thermal population effects in the stellar plasma at p-process temperatures are small for Se and Sr, but increase up to 1.42 for Ba (table 1).
4.2 Experimental results
For sample characteristics, activation features, and a de-tailed discussion of the Se and Sr results see ref. [17]. The results of the Te and Ba measurements in this paper are yet preliminary and correspond only to the cross-sections derived with the experimental neutron distribution at
kT = 25 keV. Nevertheless, this value approximates the Maxwellian averaged cross-section at kT = 30 keV very well and can be used for comparison with other stellar cross-sections. The resulting MACS at 30 keV (for Se and Sr) and the experimental values for Te and Ba are shown in table 2. The extrapolation to higher (p-process) tem-peratures will not be discussed here and can also be found in ref. [17].
4.2.174Se(n,γ)75Se
The 74Se(n, γ)75Se reaction was analyzed via the two strongest transitions in 75As at 136.0 keV and 264.7 keV (table 3). The capture cross-section derived with the ex-perimental neutron distribution is 281 ± 15 mb. The re-sult for the stellar cross-section is hσi30 = 271 mb, in perfect agreement with the previously estimated value of 267 ± 25 mb from ref. [18].
4.2.284Sr(n,γ)85Srg,m
In case of84Sr, neutron captures populate both the ground and isomeric state of 85Sr. While 85Srg decays can be identified via the 514 keV transition in85Rb, the decay of the isomer proceeds mainly via transitions of 232 keV and 151 keV. The isomeric state is 239 keV above the ground state and decays either via a 7 keV–232 keV cascade (in-ternal transition, 86.6%) or directly by electron capture (13.4%) into the 151 keV level of the daughter nucleus.
The partial cross-section to the isomeric state can be easily deduced from the above-mentioned transitions at 151 keV and 232 keV and yields 189 ± 10 mb. The cross-section to the ground state was measured to 112 ± 8 mb, which leads to a total capture cross-section of 301±17 mb. The result for the total stellar cross-section of84Sr is hσi30 = 300 mb, 17% lower than the 368 ± 125 mb from ref. [18]. The partial cross-section to the isomer yields hσi30(part) = 190 mb.
4.2.3120Te(n,γ)121Teg,m
The Te samples were analyzed via the 576 keV γ line from the β+decay of121Teg into121Sb. The partial cross-section of the isomeric state cannot be measured directly after the irradiation due to a huge Compton background around 210 keV, but after a waiting time of 80 d the expected 212 keV line from the IT to the ground state (88.6%) could be determined.
The preliminary result for the neutron capture to the ground state is 390 ± 16 mb, and 61 ± 2 mb for the partial cross-section to the isomeric state. This leads to a (prelim-inary) total (n, γ) cross-section of 451±18 mb, which again is in good agreement with the estimated 420±103 mb from ref. [18].
4.2.4130Ba(n,γ)131Ba
The130Ba cross-section can be determined via the transi-tions at 124 keV, 216 keV, 373 keV and 496 keV from the β+ decay into 131Cs. The resulting experimental cross-section is 694 ± 20 mb, which exhibits a much smaller un-certainty than the 760 ± 110 mb ones from ref. [27], which were derived at a filtered neutron beam.
4.2.5132Ba(n,γ)133Bag,m
The partial cross-section to the 38.9 h isomer in133Ba was measured via the 276 keV line (IT) to be 33.6±1.7 mb. The total capture cross-section was determined with a Clover detector via the strongest EC decay transition into 133Cs at 356.0 keV. The preliminary result is 368 ± 25 mb, in perfect agreement with the estimated 379 ± 137 mb from ref. [18].
4.3 Comparison with theory
Figure 1 shows a comparison of our experimental total capture cross-sections with hσi30values derived with vari-ous theoretical models [28,29,30,31,32,24,23,20]. For74Se and 84Sr the experimental value shown is the MACS de-rived with the energy dependence of JEFF 3.0 [17,33], whereas the preliminary values for120Te,130Ba and132Ba shown here are only cross-sections derived with the exper-imental neutron distribution.
In the case of130Ba our experimental value agrees with the measurement of ref. [27]. In all other cases we find good agreement with the semi-theoretical values of Bao et al. [18], which are normalized NON-SMOKER cross-sections accounting for known systematic deficiencies in the nuclear inputs of the calculation.
5 Summary
We have presented the results of an ongoing experimen-tal program to determine more precise p-process reaction
1970 1980 1990 2000 200 300 400 500 600 NON-SMOKER MOST 132
Ba
Holmes et al. Allen et al. Bao et al. Zhao et al. this work (preliminary) Harris 1970 1980 1990 2000 100 200 300 400 NON-SMOKER MOST Zhao et al. Harris Woosley et al. Allen et al. 74 Se this work Bao et al. 1970 1980 1990 2000 100 200 300 400 500 NON-SMOKER MOST* 84 Sr Holmes et al.Allen et al. Bao et al.
Zhao et al. this work Harris 1970 1980 1990 2000 200 300 400 500 760 800 NON-SMOKER MOST* 120
Te
Holmes et al.Allen et al. Bao et al.
Zhao et al. this work (preliminary) Harris 1970 1980 1990 2000 400 500 600 700 800 900 1000 2000 NON-SMOKER MOST 130 Ba Holmes et al. Allen et al. Bradley et al.
this work (preliminary)
Harris MACS 30 [mb] MACS 30 [mb] MACS 30 [mb] MACS 30 [mb] MACS 30 [mb] year year year year year
Fig. 1. Comparison of MACS30 predictions. MOST* marks modified values [20].
rates in the mass range A = 70–140. The (n, γ) cross-sections of the p nuclei74Se,84Sr,120Te,132Ba have been measured for the first time, including the partial cross-sections to the isomeric states in 85Sr, 121Te, and133Ba. A re-measurement of 130Ba yielded a more precise total cross-section compared to the previous value [27].
As can be seen in table2, experimental Maxwellian av-eraged cross-sections for98Ru,102Pd,138La,158Dy,168Yb, 174Hf,184Os and196Hg are still missing. Thus, future ef-forts should be focussed on these measurements, as well as on an improvement of the accuracy of important isotopes like 92Mo and94Mo.
6 KADoNiS —The Karlsruhe Astrophysical
Database of Nucleosynthesis in Stars
The KADoNiS project is an online database for cross-sections in the s process and p process (http://nuclear-astrophysics.fzk.de/kadonis/). Its first part consists of an updated version of the Bao et al.compilation [18] for cross-sections relevant to the s process. A test launch of the KADoNiS webpage started in May 2005 with an online version of the original Bao et al. paper. By the end of June 2005 the first updated version was online. For the six isotopes 128–130Xe,147Pm,151Sm and180Tam the previously recommended semi-theoretical MACS were replaced by first experimental results. More than 40 isotopes (a list is available online) exhibit new measurements, which were included to re-evaluate the recommended MACS.
The KADoNiS data sheets include all necessary infor-mation for the respective (n, γ) reaction (recommended total and partial cross-sections, all available published val-ues with references, energy dependence of the MACS for 5 < kT < 100 keV, and the respective stellar enhancement factors).
The second part of the KADoNiS is planned to be a collection of experimental p-process reaction rates, includ-ing (n, γ), (p, γ), (α, γ) and their respective photodissoci-ation rates. This part of the database has been launched in December 2005.
References
1. E.M. Burbidge, G.R. Burbidge, W.A. Fowler, F. Hoyle, Rev. Mod. Phys. 29, 547 (1957).
2. K. Langanke, M. Wiescher, Rep. Prog. Phys. 64, 1657 (2001).
3. S.E. Woosley, W.M. Howard, Astrophys. J. Suppl. Ser. 36, 285 (1978).
4. S.E. Woosley, W.M. Howard, Astrophys. J. 354, L21 (1990).
5. M. Rayet, M. Arnould, M. Hashimoto, N. Prantzos, K. Nomoto, Astron. Astrophys. 298, 517 (1995).
6. T. Rauscher, A. Heger, R.D. Hoffman, S.E. Woosley, As-trophys. J. 576, 323 (2002).
7. W. Hauser, H. Feshbach, Phys. Rev. 87, 366 (1952). 8. T. Rauscher, F.-K. Thielemann, H. Oberhummer,
Astro-phys. J. 451, L37 (1995).
9. M. Rayet, N. Prantzos, M. Arnould, Astron. Astrophys. 227, 271 (1990).
10. T. Rauscher, Nucl. Phys. A 758, 549c (2005).
11. W. Rapp, Report FZKA 6956, Forschungszentrum Karls-ruhe (2004).
12. T. Rauscher, F.-K. Thielemann, At. Data Nucl. Data Ta-bles 75, 1 (2000).
13. K. Vogt, P. Mohr, M. Babilon, J. Enders, T. Hartmann, C. Hutter, T. Rauscher, S. Volz, A. Zilges, Phys. Rev. C 63, 055802 (2001).
14. W. Ratynski, F. K¨appeler, Phys. Rev. C 37, 595 (1988). 15. S. Dababneh, N. Patronis, P.A. Assimakopoulos, J. G¨orres,
M. Heil, F. K¨appeler, D. Karamanis, S. O’Brien, R. Rei-farth, Nucl. Instrum. Methods A 517, 230 (2004). 16. H. Beer, F. K¨appeler, Phys. Rev. C 21, 534 (1980). 17. I. Dillmann, M. Heil, F. K¨appeler, T. Rauscher, F.-K.
Thielemann, Phys. Rev. C 73, 015803 (2006).
18. Z.Y. Bao, H. Beer, F. K¨appeler, F. Voss, K. Wissshak, T. Rauscher, At. Data Nucl. Data Tables 76, 70 (2000). 19. R. Reifarth, M. Heil, F. K¨appeler, F. Voss, K. Wisshak,
Phys. Rev. C 66, 064603 (2002).
20. S. Goriely, private communication (2005).
21. E. Anders, N. Grevesse, Geochim. Cosmochim. Acta 53, 1997 (1989).
22. K. Lodders, Astrophys. J. 591, 1220 (2003).
23. S. Goriely, Hauser-Feshbach rates for neutron capture reac-tions (version 09/12/02), http://www-astro.ulb.ac.be/ Html/hfr.html.
24. T. Rauscher, F.-K. Thielemann, At. Data Nucl. Data Ta-bles 79, 47 (2001).
25. National Nuclear Data Center, www.nndc.bnl.gov/nudat2 (2004).
26. K.J.R. Rosman, P.D.P. Taylor, Pure Appl. Chem. 70, 217 (1998).
27. T. Bradley, Z. Parsa, Nuclear Cross Sections for Technol-ogy, edited by J.L. Fowler, C.H. Johnson, C.D. Bowman (National Bureau of Standards, Washington D.C., 1979) p. 344.
28. B. Allen, J. Gibbons, R. Macklin, Adv. Nucl. Phys. 4, 205 (1971).
29. J. Holmes, S.E. Woosley, W. Fowler, B. Zimmerman, At. Data Nucl. Data Tables 18, 305 (1976).
30. S.E. Woosley, W. Fowler, J. Holmes, B. Zimmerman, At. Data Nucl. Data Tables 22, 371 (1978).
31. M. Harris, Astrophys. Space Sci. 77, 357 (1981).
32. Z. Zhao, D. Zhou, D. Cai, Nuclear Data for Science and Technology, edited by S. Igarasi (Saikon, Tokyo, 1988) p. 513.
33. NEA, Joint Evaluated Fission and Fusion General Pur-pose File: JEFF 3.0; online: www.nea.fr/html/dbdata/ eva/evaret.cgi(2004).
![Table 1. Stellar enhancement factors for different tempera- tempera-tures [12].](https://thumb-eu.123doks.com/thumbv2/123doknet/14869420.639096/2.892.462.814.1041.1141/table-stellar-enhancement-factors-different-tempera-tempera-tures.webp)
![Table 3. Decay properties of the product nuclei [25]. Isotopic abundances are from ref](https://thumb-eu.123doks.com/thumbv2/123doknet/14869420.639096/4.892.141.747.162.419/table-decay-properties-product-nuclei-isotopic-abundances-ref.webp)
![Figure 1 shows a comparison of our experimental total capture cross-sections with h σ i 30 values derived with vari-ous theoretical models [28,29, 30,31, 32, 24, 23, 20]](https://thumb-eu.123doks.com/thumbv2/123doknet/14869420.639096/5.892.500.777.137.1112/figure-comparison-experimental-capture-sections-values-derived-theoretical.webp)