arXiv:hep-ex/9907043v1 21 Jul 1999
EUROPEAN LABORATORY FOR PARTICLE PHYSICS (CERN)
CERN-EP/99-092 8 July 1999
Determination of the
LEP centre-of-mass energy
from Zγ events
The ALEPH Collaboration
Abstract
Radiative returns to the Z resonance (Zγ events) are used to determine the LEP2 centre-of-mass energy from the data collected with the ALEPH detector in 1997. The average centre-of-mass energy is measured to be:
ECM = 182.50 ± 0.19 (stat.) ± 0.08 (syst.) GeV
in good agreement with the precise determination by the LEP energy working group of 182.652±0.050 GeV. If applied to the measurement of the W mass, its precision translates into a systematic error on MW which is smaller than the statistical error achieved from
the corresponding dataset.
The ALEPH Collaboration
R. Barate, D. Decamp, P. Ghez, C. Goy, S. Jezequel, J.-P. Lees, F. Martin, E. Merle, M.-N. Minard, B. Pietrzyk, H. Przysiezniak
Laboratoire de Physique des Particules (LAPP), IN2 P3
-CNRS, F-74019 Annecy-le-Vieux Cedex, France
R. Alemany, M.P. Casado, M. Chmeissani, J.M. Crespo, E. Fernandez, M. Fernandez-Bosman, Ll. Garrido,15
E. Graug`es, A. Juste, M. Martinez, G. Merino, R. Miquel, Ll.M. Mir, P. Morawitz, A. Pacheco, I.C. Park, I. Riu
Institut de F´isica d’Altes Energies, Universitat Aut`onoma de Barcelona, 08193 Bellaterra (Barcelona), E-Spain7
A. Colaleo, D. Creanza, M. de Palma, G. Iaselli, G. Maggi, M. Maggi, S. Nuzzo, A. Ranieri, G. Raso, F. Ruggieri, G. Selvaggi, L. Silvestris, P. Tempesta, A. Tricomi,3
G. Zito Dipartimento di Fisica, INFN Sezione di Bari, I-70126 Bari, Italy
X. Huang, J. Lin, Q. Ouyang, T. Wang, Y. Xie, R. Xu, S. Xue, J. Zhang, L. Zhang, W. Zhao Institute of High-Energy Physics, Academia Sinica, Beijing, The People’s Republic of China8 D. Abbaneo, U. Becker,19
G. Boix,6
M. Cattaneo, F. Cerutti, V. Ciulli, G. Dissertori, H. Drevermann, R.W. Forty, M. Frank, F. Gianotti, T.C. Greening, A.W. Halley, J.B. Hansen, J. Harvey, P. Janot, B. Jost, I. Lehraus, O. Leroy, C. Loomis, P. Maley, P. Mato, A. Minten, A. Moutoussi, F. Ranjard, L. Rolandi, D. Schlatter, M. Schmitt,20
O. Schneider,2
P. Spagnolo, W. Tejessy, F. Teubert, I.R. Tomalin, E. Tournefier, A.E. Wright
European Laboratory for Particle Physics (CERN), CH-1211 Geneva 23, Switzerland
Z. Ajaltouni, F. Badaud G. Chazelle, O. Deschamps, S. Dessagne, A. Falvard, C. Ferdi, P. Gay, C. Guicheney, P. Henrard, J. Jousset, B. Michel, S. Monteil, J-C. Montret, D. Pallin, P. Perret, F. Podlyski
Laboratoire de Physique Corpusculaire, Universit´e Blaise Pascal, IN2 P3
-CNRS, Clermont-Ferrand, F-63177 Aubi`ere, France
J.D. Hansen, J.R. Hansen, P.H. Hansen, B.S. Nilsson, B. Rensch, A. W¨a¨an¨anen Niels Bohr Institute, 2100 Copenhagen, DK-Denmark9
G. Daskalakis, A. Kyriakis, C. Markou, E. Simopoulou, A. Vayaki
Nuclear Research Center Demokritos (NRCD), GR-15310 Attiki, Greece
A. Blondel, J.-C. Brient, F. Machefert, A. Roug´e, M. Swynghedauw, R. Tanaka, A. Valassi,23 H. Videau
Laboratoire de Physique Nucl´eaire et des Hautes Energies, Ecole Polytechnique, IN2 P3
-CNRS, F-91128 Palaiseau Cedex, France
E. Focardi, G. Parrini, K. Zachariadou
Dipartimento di Fisica, Universit`a di Firenze, INFN Sezione di Firenze, I-50125 Firenze, Italy R. Cavanaugh, M. Corden, C. Georgiopoulos
Supercomputer Computations Research Institute, Florida State University, Tallahassee, FL 32306-4052, USA13,14
A. Antonelli, G. Bencivenni, G. Bologna,4
F. Bossi, P. Campana, G. Capon, V. Chiarella, P. Laurelli, G. Mannocchi,1,5F. Murtas, G.P. Murtas, L. Passalacqua, M. Pepe-Altarelli1
Laboratori Nazionali dell’INFN (LNF-INFN), I-00044 Frascati, Italy
M. Chalmers, L. Curtis, J.G. Lynch, P. Negus, V. O’Shea, B. Raeven, C. Raine, D. Smith, P. Teixeira-Dias, A.S. Thompson, J.J. Ward
O. Buchm¨uller, S. Dhamotharan, C. Geweniger, P. Hanke, G. Hansper, V. Hepp, E.E. Kluge, A. Putzer, J. Sommer, K. Tittel, S. Werner,19
M. Wunsch
Institut f¨ur Hochenergiephysik, Universit¨at Heidelberg, D-69120 Heidelberg, Germany16 R. Beuselinck, D.M. Binnie, W. Cameron, P.J. Dornan,1
M. Girone, S. Goodsir, N. Marinelli, E.B. Martin, J. Nash, J. Nowell, A. Sciab`a, J.K. Sedgbeer, E. Thomson, M.D. Williams
Department of Physics, Imperial College, London SW7 2BZ, United Kingdom10 V.M. Ghete, P. Girtler, E. Kneringer, D. Kuhn, G. Rudolph
Institut f¨ur Experimentalphysik, Universit¨at Innsbruck, A-6020 Innsbruck, Austria18
C.K. Bowdery, P.G. Buck, G. Ellis, A.J. Finch, F. Foster, G. Hughes, R.W.L. Jones, N.A. Robertson, M. Smizanska, M.I. Williams
Department of Physics, University of Lancaster, Lancaster LA1 4YB, United Kingdom10
I. Giehl, F. H¨olldorfer, K. Jakobs, K. Kleinknecht, M. Kr¨ocker, A.-S. M¨uller, H.-A. N¨urnberger, G. Quast, B. Renk, E. Rohne, H.-G. Sander, S. Schmeling, H. Wachsmuth C. Zeitnitz, T. Ziegler
Institut f¨ur Physik, Universit¨at Mainz, D-55099 Mainz, Germany16 J.J. Aubert, C. Benchouk, A. Bonissent, J. Carr,1
P. Coyle, A. Ealet, D. Fouchez, F. Motsch, P. Payre, D. Rousseau, M. Talby, M. Thulasidas, A. Tilquin
Centre de Physique des Particules, Facult´e des Sciences de Luminy, IN2 P3
-CNRS, F-13288 Marseille, France
M. Aleppo, M. Antonelli, S. Gilardoni, F. Ragusa
Dipartimento di Fisica, Universit`a di Milano e INFN Sezione di Milano, I-20133 Milano, Italy.
V. B¨uscher, H. Dietl, G. Ganis, K. H¨uttmann, G. L¨utjens, C. Mannert, W. M¨anner, H.-G. Moser, S. Schael, R. Settles, H. Seywerd, H. Stenzel, W. Wiedenmann, G. Wolf
Max-Planck-Institut f¨ur Physik, Werner-Heisenberg-Institut, D-80805 M¨unchen, Germany16
P. Azzurri, J. Boucrot, O. Callot, S. Chen, M. Davier, L. Duflot, J.-F. Grivaz, Ph. Heusse, A. Jacholkowska,1
M. Kado, J. Lefran¸cois, L. Serin, J.-J. Veillet, I. Videau,1
J.-B. de Vivie de R´egie, D. Zerwas
Laboratoire de l’Acc´el´erateur Lin´eaire, Universit´e de Paris-Sud, IN2 P3
-CNRS, F-91898 Orsay Cedex, France
G. Bagliesi, S. Bettarini, T. Boccali, C. Bozzi,12
G. Calderini, R. Dell’Orso, I. Ferrante, A. Giassi, A. Gregorio, F. Ligabue, A. Lusiani, P.S. Marrocchesi, A. Messineo, F. Palla, G. Rizzo, G. Sanguinetti, G. Sguazzoni, R. Tenchini, C. Vannini, A. Venturi, P.G. Verdini
Dipartimento di Fisica dell’Universit`a, INFN Sezione di Pisa, e Scuola Normale Superiore, I-56010 Pisa, Italy
G.A. Blair, J. Coles, G. Cowan, M.G. Green, D.E. Hutchcroft, L.T. Jones, T. Medcalf, J.A. Strong, J.H. von Wimmersperg-Toeller
Department of Physics, Royal Holloway & Bedford New College, University of London, Surrey TW20 OEX, United Kingdom10
D.R. Botterill, R.W. Clifft, T.R. Edgecock, P.R. Norton, J.C. Thompson
Particle Physics Dept., Rutherford Appleton Laboratory, Chilton, Didcot, Oxon OX11 OQX, United Kingdom10
B. Bloch-Devaux, P. Colas, B. Fabbro, G. Fa¨if, E. Lan¸con, M.-C. Lemaire, E. Locci, P. Perez, J. Rander, J.-F. Renardy, A. Rosowsky, A. Trabelsi,21
B. Tuchming, B. Vallage
CEA, DAPNIA/Service de Physique des Particules, CE-Saclay, F-91191 Gif-sur-Yvette Cedex, France17
S.N. Black, J.H. Dann, H.Y. Kim, N. Konstantinidis, A.M. Litke, M.A. McNeil, G. Taylor
Institute for Particle Physics, University of California at Santa Cruz, Santa Cruz, CA 95064, USA22 C.N. Booth, S. Cartwright, F. Combley, P.N. Hodgson, M.S. Kelly, M. Lehto, L.F. Thompson
K. Affholderbach, A. B¨ohrer, S. Brandt, C. Grupen, J. Hess, A. Misiejuk, G. Prange, U. Sieler Fachbereich Physik, Universit¨at Siegen, D-57068 Siegen, Germany16
G. Giannini, B. Gobbo
Dipartimento di Fisica, Universit`a di Trieste e INFN Sezione di Trieste, I-34127 Trieste, Italy J. Putz, J. Rothberg, S. Wasserbaech, R.W. Williams
Experimental Elementary Particle Physics, University of Washington, WA 98195 Seattle, U.S.A. S.R. Armstrong, P. Elmer, D.P.S. Ferguson, Y. Gao, S. Gonz´alez, O.J. Hayes, H. Hu, S. Jin, P.A. McNamara III, J. Nielsen, W. Orejudos, Y.B. Pan, Y. Saadi, I.J. Scott, J. Walsh, Sau Lan Wu, X. Wu, G. Zobernig
Department of Physics, University of Wisconsin, Madison, WI 53706, USA11
1
Also at CERN, 1211 Geneva 23, Switzerland. 2
Now at Universit´e de Lausanne, 1015 Lausanne, Switzerland. 3
Also at Centro Siciliano di Fisica Nucleare e Struttura della Materia, INFN Sezione di Catania, 95129 Catania, Italy.
4
Also Istituto di Fisica Generale, Universit`a di Torino, 10125 Torino, Italy. 5
Also Istituto di Cosmo-Geofisica del C.N.R., Torino, Italy. 6
Supported by the Commission of the European Communities, contract ERBFMBICT982894. 7
Supported by CICYT, Spain. 8
Supported by the National Science Foundation of China. 9
Supported by the Danish Natural Science Research Council. 10
Supported by the UK Particle Physics and Astronomy Research Council. 11
Supported by the US Department of Energy, grant DE-FG0295-ER40896. 12
Now at INFN Sezione di Ferrara, 44100 Ferrara, Italy. 13
Supported by the US Department of Energy, contract DE-FG05-92ER40742. 14
Supported by the US Department of Energy, contract DE-FC05-85ER250000. 15
Permanent address: Universitat de Barcelona, 08208 Barcelona, Spain. 16
Supported by the Bundesministerium f¨ur Bildung, Wissenschaft, Forschung und Technologie, Germany.
17
Supported by the Direction des Sciences de la Mati`ere, C.E.A. 18
Supported by Fonds zur F¨orderung der wissenschaftlichen Forschung, Austria. 19
Now at SAP AG, 69185 Walldorf, Germany 20
Now at Harvard University, Cambridge, MA 02138, U.S.A. 21
Now at D´epartement de Physique, Facult´e des Sciences de Tunis, 1060 Le Belv´ed`ere, Tunisia. 22
Supported by the US Department of Energy, grant DE-FG03-92ER40689. 23
1
Introduction
One of the main goals of LEP2 is the direct measurement of the W mass with an accuracy better than 30 MeV. This requires a very precise determination of the LEP centre-of-mass energy, in order to minimize its contribution to the W mass uncertainty. At LEP1 this accuracy was achieved using the Resonant Depolarisation method for energy measurement [1]. At LEP2 this is no longer possible since polarization has not been achieved above a beam energy of 60 GeV. Therefore, the precise Resonant Depolarisation calibration is performed only in the 40-55 GeV energy range, and extrapolation to higher energies is necessary. The precision achieved on the 183 GeV centre-of-mass energy range is about ±50 MeV [2]. For future data taking there is hope to improve this precision using the recently installed magnetic spectrometer [3].
An alternative determination is considered in this paper. It is based on an analysis of e+
e−→ γf ¯f events, where the Initial State Radiation (ISR) photons are mostly collinear
to the beam pipe and remain undetected. In these events, the invariant mass, √s′, of
the final state f ¯f system peaks naturally at the Z mass. The variable x = 1 − s′/s can
be reconstructed from the final state particle angles which are well measured quantities. Since the Z mass is very well known from LEP1, a fit to the distribution of x can be used to determine the center-of-mass energy √s.
This letter presents an application of this method using the q ¯q final state in data recorded by ALEPH in 1997. LEP ran at nominal centre-of-mass energies of 181, 182, 183 and 184 GeV, and an integrated luminosity of 56.812 pb−1 was collected.
2
The ALEPH detector
A detailed description of the ALEPH detector can be found in Ref. [5] and of its performance in Ref. [6]. Charged particles are detected in the central part of the detector. From the beam crossing point outwards, a silicon vertex detector, a cylindrical drift chamber, and a large time projection chamber (TPC) measure up to 31 coordinates along the charged particle trajectories. A 1.5 T axial magnetic field is provided by a superconducting solenoidal coil. A resolution of δpT/pT = 6 × 10⁻⁴pT ⊕ 0.005 (pT in
GeV/c) is achieved. Hereafter, charged particle tracks reconstructed from at least four hits in the TPC, having a polar angle to the beam axis satisfying |cos θ| < 0.95, and originating from within a cylinder of 2 cm radius and 20 cm length, centred on the nominal interaction point and parallel to the beam axis, are called good tracks.
Electrons and photons are identified in the electromagnetic calorimeter by their shower profile. The calorimeter, a lead/wire-plane sampling device with fine readout segmentation and total thickness of 22 radiation lengths at normal incidence, provides an energy resolution ∆E/E of 0.180/√E + 0.009 (E in GeV).
Muons are identified by their penetration pattern in the hadron calorimeter, a 1.2 m thick iron yoke instrumented with 23 layers of streamer tubes, together with two surrounding layers of muon chambers. In association with the electromagnetic calorimeter, the hadron calorimeter also provides a measurement of the energy of charged and neutral hadrons with a relative resolution of 0.85/√E (E in GeV).
The total visible energy and momentum, as well as the missing energy, are evaluated by an energy flow reconstruction algorithm [6] which combines all of the above measurements, complemented at low polar angles by the energy detected in the luminosity calorimeters. Jets are built from charged and neutral objects reconstructed by the energy flow algorithm. The typical jet angular resolution is 30 mrad. The jet energy resolution is approximately σE = (0.6
√
E + 0.6)GeV · (1 + cos2
θ), where E (in GeV) and θ are the jet energy and polar angle. The jet energy and angular resolution as well as calibrations were obtained from extensive studies of Z → q¯q events both in data and Monte Carlo. Discrepancies between data and simulation were used when evaluating systematic errors.
3
Monte Carlo samples
A sample of 200,000 q ¯q events was generated using KORALZ v4.2 [7] at a nominal energy of 182.675 GeV and fully simulated in the detector. Monte Carlo samples at 183 GeV with integrated luminosities at least 20 times larger than recorded were simulated for all background reactions. PYTHIA v5.7 [8] was used to generate ZZ and Zee events, and KORALW v1.21 [9] to produce four fermion events with W W topologies. Two-photon (γγ) reactions into hadrons were simulated with PHOT02 [11] and PHOJET [12]. The method was calibrated with fully simulated q ¯q samples of 20,000 events, generated with KORALZ, at 181, 182, 184 and 185 GeV.
4
Event selection and reconstruction algorithm
At √s = 183 GeV the main backgrounds to the process e+
e− → Zγ → q¯qγ are
e+
e− → W W , e+
e− → ZZ, e+
e− → γγ and e+
e− → Zee. To discriminate between
signal and background events, the following cuts are applied.
• q¯q candidates are required to have at least seven good tracks which total energy exceeds 10% of the nominal centre-of-mass energy.
• The energy flow objects are clustered into jets using the JADE algorithm [13] with a ycut value of 0.008. Events containing jets with an electromagnetic content of at
least 90% and an energy larger than 10 GeV are rejected.
• The total visible invariant mass is required to be greater than 50 GeV/c2
.
• The remaining events are then forced into two jets using the DURHAM-E algorithm. The polar angle of both jets, θ, is restricted to |cos θ| < 0.95.
To reconstruct the effective centre-of-mass energy √s′, it is assumed that the ISR photon
is emitted along the beam pipe, resulting in a boost of the f ¯f system, or the produced Z, in the opposite direction. A kinematic reconstruction based on rescaling of the jet energies is performed for each event. According to Monte Carlo studies, jet velocities and angles are well measured. Each jet four-momentum is scaled by a factor α according to the relations
E1rec= α1E1meas ; −P→1 rec = α1−→P1 meas E2rec= α2E2meas ; −P→2 rec = α2−→P2 meas
where rec stands for reconstructed and meas for measured. Correction coefficients are different for the two jets.
In the absence of final state radiation (FSR), the correction coefficients α1 and α2 are
obtained by applying energy and momentum conservation, and the assumption that one zero mass particle escapes detection (the ISR γ) along the beam axis. The solution kept is the one which yields α1 and α2positive and closest to 1. Then, the effective centre-of-mass
energy can be expressed as
s′ = s F ~ Pmeas 1 Emeas 1 ,P~ meas 2 Emeas 2
from which the quantity x = 1 − (s′/s) is reconstructed independently of the nominal
centre-of-mass energy.
The fit to the centre-of-mass energy is performed for events with 0.60 < x < 0.88 where the highest purity and the maximum sensitivity is achieved. The generated cross-sections, the effective ones after selection cuts and within the fitting window are summarised for each process in Table 1.
Processes σ(pb) σef f(pb) σwindow(pb) q ¯qγ 108.84 ± 0.08 68.61 ± 0.20 40.07 ± 0.15 W W 16.02 ± 0.01 10.51 ± 0.05 0.47 ± 0.01 ZZ 2.545 ± 0.13 1.08 ± 0.05 0.33 ± 0.02 γγ → hadrons (untagged) 7800. ± 390. 0.98 ± 0.22 0.24 ± 0.11 γγ → u/d 474.00 ± 23.70 0.61 ± 0.08 0.19 ± 0.04 γγ → ss 26.00 ± 1.30 0.04 ± 0.02 0.01 ± 0.01 γγ → cc 93.60 ± 4.68 0.55 ± 0.008 0.19 ± 0.05 γγ → bb 0.53 ± 0.03 0.02 ± 0.005 0.01 ± 0.01 Zee 6.80 ± 0.27 4.57 ± 0.18 1.02 ± 0.04 W eν 0.608 ± 0.03 0.32 ± 0.02 0.11 ± 0.01 Purity (%) 78.60 ± 0.01 93.93 ± 0.01
Table 1: Generated (second column) and effective cross-section after selection cuts (third column) and within the fitting window (fourth column), for signal and background processes (first column) at √
s=182.675.
5
LEP Centre-of-Mass Energy measurement
The LEP centre-of-mass energy is determined for each of the 181, 182, 183 and 184 GeV datasets. The four values are combined taking into account the relative luminosity of each
dataset. A Monte Carlo reweighting procedure [14] is applied to find the value of ECM
which best fits the reconstructed x distribution. Selected Monte Carlo (KORALZ) signal events from the large sample at a reference energy of 182.675 GeV are reweighted using the ratio of the differential production cross-sections [15]
wi(ECM) = dσ dx(x i true, ECM) dσ dx(x i true, E ref CM) ,
where xi denotes the x at which the ith event has been generated. Background Monte
Carlo samples are included in the fit, but they are not reweighted, i.e., their energy dependence is not taken into account. This introduces a systematic error which is estimated in section 7.
A maximum likelihood fit is performed with fixed bins of 0.01 over the x range of 0.60– 0.88. The statistical error on the centre-of-mass energy is derived from the individual fits to the data distributions.
The linearity of the reweighting technique was verified using five independent Monte Carlo samples (signal and background) generated within 2 GeV around the central nominal energy. The fitted values from these distributions have a slope 1.035±0.034, consistent with unity, and an insignificant offset of 0.045±0.049 GeV.
6
Results
The number of selected events at each nominal energy, and the corresponding number of expected events are summarized in Table 2. The uncertainty on the number of expected events comes from three sources: the error on the integrated luminosity measurement, the statistical error on the estimation of the efficiencies and the theoretical uncertainty on the cross-sections.
Nominal Data Expected Integrated dataset events events Luminosity (pb−1)
181 11 8 ± 1 0.166 ± 0.006 182 187 173 ± 2 3.924 ± 0.029 183 2293 2191 ± 12 50.795 ± 0.105 184 76 84 ± 1 1.927 ± 0.021
Table 2: Number of events found in each energy dataset after the selection cuts, as well as the corresponding number of expected events and integrated luminosity .
The LEP centre-of-mass energy values and the statistical errors obtained from fits to the individual datasets are summarized in Table 3, as well as the weighted average according to the integrated luminosity of each dataset. The last column gives the value obtained by the LEP energy calibration group.
Figure 1 shows the reconstructed x distribution for the selected events in each dataset, superimposed with the Monte Carlo reweighted expectation using the LEP centre-of-mass energy which best fits the data.
Nominal ECM(fit) -∆ECM +∆ECM ECM(LEP)
energy (GeV) (GeV) (GeV) (GeV) 181 181.19 −2.45 +2.82 180.826 ± 0.050 182 181.73 −0.63 +0.68 181.708 ± 0.050 183 182.56 −0.22 +0.19 182.691 ± 0.050 184 182.56 −0.99 +1.11 183.801 ± 0.050 Combined 182.50 −0.20 +0.18 182.652 ± 0.050
Table 3: Fitted LEP centre-of-mass energies and corresponding statistical errors for each dataset. The last column gives the LEP centre-of-mass energies established by the LEP energy calibration group for the corresponding dataset.
0 1 2 3 4 5 6 7 8 9 0.6 0.7 0.8 (a) Data MC (Ecm=181.187 GeV) Background χ2 /d.o.f 4/28 xreco Events/0.01 0 5 10 15 20 25 30 35 40 45 50 0.6 0.7 0.8
ALEPH
(b) Data MC (Ecm=181.726 GeV) Background χ2 /d.o.f 7/28 xreco Events/0.01 0 100 200 300 400 500 0.6 0.7 0.8 (c) Data MC (Ecm=182.564 GeV) Background χ2 /d.o.f 26/28 xreco Events/0.01 0 5 10 15 20 25 30 35 0.6 0.7 0.8 (d) Data MC (Ecm=182.555 GeV) Background χ2 /d.o.f 4/28 xreco Events/0.01Figure 1: Reconstructed x distribution for selected data (dots) and background (shaded area) for each energy dataset: 181 (a), 182 (b), 183 (c) and 184 GeV (d). The open histogram shows the results of the fit
7
Systematic uncertainties
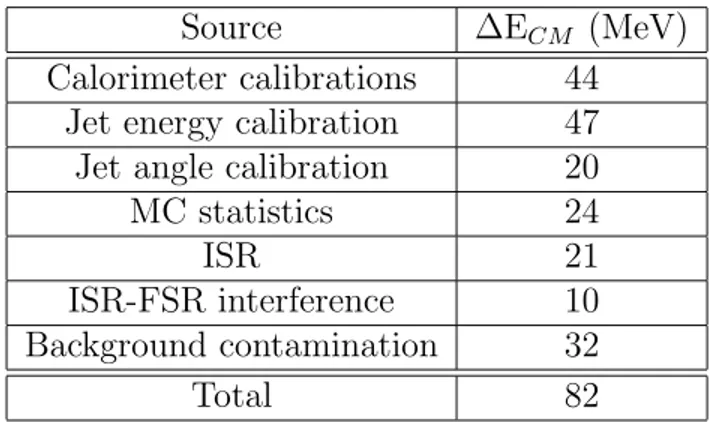
Table 4 summarizes all the systematic errors discussed below. Source ∆ECM (MeV)
Calorimeter calibrations 44 Jet energy calibration 47 Jet angle calibration 20 MC statistics 24
ISR 21
ISR-FSR interference 10 Background contamination 32
Total 82
Table 4: Summary of the systematic errors on the LEP centre-of-mass energy measurement.
Calorimeter calibrations
During the 1997 data taking the uncertainties on the absolute calibration scale of ECAL and HCAL energies were estimated to be ±0.9% and ±2%, respectively. Maximum shifts of 26 MeV and 36 MeV were observed when applying the fitting procedure to the MC sample after variation of ECAL and HCAL energies in both directions by the corresponding amount.
Jet energy calibration
Z peak data are used to map the response of the detector to hadronic jets as a function of their polar angle. The observed difference in the energy scale of jets between data and Monte Carlo is parametrised as a function of |cos θ|, where θ is the angle between the jet direction and the beam axis. To estimate the systematic error, two modified parametrisations are derived which correspond to ±1σ uncertainty on the discrepancy. The largest shift observed when these modified parametrisations are used to correct the jet energies amounts to 47 MeV and is taken as the systematic error.
Jet angle calibration
Z peak data have been used as well to study the two jets acollinearity as a function of |cos θ|. The observed difference between data and Monte Carlo is used to estimate this systematic error. A 20 MeV shift is observed when applying or not this correction and is quoted as the systematic error.
Initial State Radiation
ISR is described in KORALZ up to second order in the leading-log approximation (O(α2
L2
)), in the YFS [16] style. The effect of the missing higher order terms is studied by degrading KORALZ to O(α1
L1
). A 21 MeV shift is observed and is quoted as an upper limit of the systematic error.
ISR-FSR interference
No existing Monte Carlo generator is able to give a good representation of initial-final state interference for quark final states. An evaluation of the order of magnitude of the effect has been performed using ZFITTER [17]. The differential cross-section dσ/dx has
been computed with ZFITTER, switching on and off the ISR-FSR interference, including only the polar angle region |cos(θ)| <0.95, at the energy corresponding to the fitted value in the data. In both cases these differential cross-sections are integrated in x bins of 0.01 over the x range of 0.60–0.88, as for the energy measurement. The shift observed in the Z resonance peak translates into an uncertainty of 10 MeV in the determination of the LEP centre-of-mass energy.
Background contamination
The expected background level after selection cuts is 6% and the uncertainty on the contribution of the different subprocesses will affect its shape which may also depend on the centre-of-mass energy. Since the background is not reweighted, this introduces an additional source of systematic error both from the background shape and its normalization.
Background shape. The normalization uncertainty is estimated independently for each background process.
• The two-photon background, simulated with PHOT02 and PHOJET, is normalized to the data in the low visible mass region, Mvis< 50 GeV/c2; the difference between
the expected and normalized cross-sections is used to estimate the uncertainty of the process, as in [10].
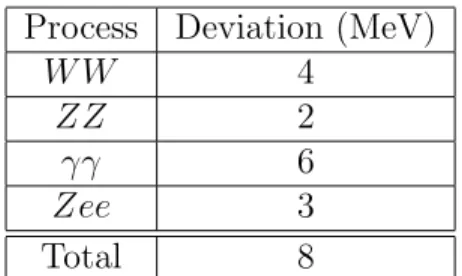
• For the W W , ZZ and Zee processes the uncertainties are computed from the relative variation of their respective total production cross-sections from the generated energy (183 GeV) down to the fitted energy from the data. This is calculated using GENTLE [18] for the W W process and PYTHIA for the ZZ and Zee process. Each background process is varied according to its uncertainty keeping constant the overall background level. The largest shift observed in each case is quoted in Table 5, leading to a total systematic error of 8 MeV.
Process Deviation (MeV)
W W 4
ZZ 2
γγ 6
Zee 3
Total 8
Table 5: Systematic error on the centre-of-mass energy due to background shape uncertainties.
Total normalization. The systematic error coming from the uncertainty in the total background normalization is estimated by varying all the background processes up and down, according to their respective uncertainties. The largest shift observed is 31 MeV and is quoted as the systematic error.
8
Summary and conclusions
The LEP centre-of-mass energy can be determined from the kinematic reconstruction of q ¯qγ events with a q ¯q invariant mass around the Z mass. The average LEP centre-of-mass energy at ALEPH for the high energy run of 1997 is measured to be
ECM = 182.50 ± 0.19 (stat.) ± 0.08 (syst) GeV
This result is consistent with the estimate from the LEP energy working group [2] ECM = 182.652 ± 0.050GeV.
With the expected increase in statistics at LEP2 and with refined experimental techniques akin to those used for the W mass determination [4], the method described here should provide an alternative measurement of the LEP centre-of-mass energy, with competitive accuracy. Already, if only this evaluation of the LEP centre-of-mass-energy were used in the W mass determination, the systematic error on MW coming from the
precision on the beam energy scale would be 90 MeV, (∆MW/MW = ∆ECM/ECM), which
is smaller than the experimental error of 139 MeV on MW from the same data sample [4].
9
Acknowledgements
It is a pleasure to congratulate our colleagues from the CERN accelerator divisions for the successful operation of LEP2. We are indebted to the engineers and technicians in all our institutions for their contributions to the excellent performance of ALEPH. Those of us from non-member countries thank CERN for its hospitality and support.
References
[1] LEP energy working group. R. Assman et al., Calibration of centre-of-mass energies
at LEP1 for precise measurements of Z properties, Eur. Phys. J. C 6 (1999) 187 [2] LEP energy working group. R. Assman et al., Evaluation of the LEP centre-of-mass
energy above the W-pair production threshold, CERN-EP/98-191, CERN-SL/98-073, submitted to European Physical Journal C.
[3] http://www.cern.ch/LEPECAL/spectro/Welcome.html [4] ALEPH Collaboration, Measurement of the W mass in e+
e− collisions at 183 GeV,
Phys. Lett. B 453 (1999) 121.
[5] ALEPH Collaboration, ALEPH: A detector for electron-positron annihilations at
LEP, Nucl. Inst. and Meth. A 294, 121 (1990)
[6] ALEPH Collaboration, Performance of the ALEPH detector at LEP, Nucl. Inst. and Meth. A 360, 481 (1995)
[7] S. Jadach, B.F.L. Ward and Z. W¸as, Comput. Phys. Commun. 79 (1994) 503.
[8] T. Sj¨ostrand, Comput. Phys. Commun. 82 (1994) 74. [9] M. Skrzypek, S. Jadach, W. Placzek and Z. W¸as,
Comp. Phys. Commun. 94 (1996) 216.
[10] ALEPH Collaboration, Study of Fermion pair production in e+
e− collisions at
130-183 GeV , CERN EP/99-042. Submitted to European Physical Journal C.
[11] J.A.M Vermaserem, Proceedings of the IV International Workshop on Gamma Gamma Interactions, eds, G. Cochard and P. Kessler (1980)
[12] R. Engel, Z. Phys. C 66 (1995) 203;
R. Engel and J. Ranft, Phys. Rev. D 54 (1996) 4144. [13] W. Bartel et al., Z. Phys. C 33 (1986) 23.
[14] ALEPH Collaboration, Measurement of the W Mass by direct Reconstruction in e+
e− Collisions at 172 GeV, Phys. Lett. B 422 (1998) 384.
[15] ALEPH Collaboration, Study of the muon-pair production at centre-of-mass energies
from 20 to 136 GeV with the ALEPH detector , Phys. Lett. B 399 (1997) 329. M.Martinez, L.Garrido, R.Miquel, J.L.Harton and R.Tanaka, Z. Phys. C 49 (1991) 645; and
M.Martinez and F.Teubert, Z. Phys. C 65 (1995) 267-276.
[16] D.R. Yennie, S.C. Frautschi and H. Suura, Annuals of Phys. 13 (1961) 379; S. Jadach and B.F.L. Ward, TPJU 15/88 (1988).
[17] D.Bardin et al., Z. Phys. C 44 (1989) 493; Comput. Phys. Commun. 59 (1990) 303; Nucl. Phys. B 351 (1991) 1;
Phys. Lett. B 255 (1991) 290 and CERN-TH/6443-92 (May 1992).
[18] D. Bardin et al. ; DESY 96-233, hep-ph/9612409.