Persistent low body weight in humans is associated with higher
mitochondrial activity in white adipose tissue
Yiin Ling,1,2Jérôme Carayol,3Bogdan Galusca,1,2Carles Canto,3Christophe Montaurier,4Alice Matone,5Irene Vassallo,6 Kaori Minehira,3Virginie Alexandre,3Ornella Cominetti,7Antonio Núñez Galindo,7John Corthésy,7Loïc Dayon,7
Aline Charpagne,8Sylviane Métairon,8Frédéric Raymond,8Patrick Descombes,8François Casteillo,9Michel Peoc’h,9 Radu Palaghiu,10Léonard Féasson,11Yves Boirie,4Bruno Estour,1,2Jörg Hager,3Natacha Germain,1,2and Nele Gheldof3
1Division of Endocrinology, Diabetes, Metabolism, and Eating Disorders, CHU St-Etienne, France;2Eating Disorders, Addictions, and Extreme Bodyweight Research Group (TAPE) EA 7423, Jean Monnet University, St-Etienne, France;3Metabolic Health, Nestlé Research, EPFL Innovation Park, Lausanne, Switzerland;4Clermont Auvergne University, INRA, Human Nutrition Unit, CHU Clermont-Ferrand, Service de Nutrition Clinique, CRNH Auvergne, Clermont-Ferrand, France;5The Microsoft Research, University of Trento Centre for Computational Systems Biology (COSBI), Rovereto, Italy;6Precision Medicine Group, Quartz Bio SA, Geneva, Switzerland;7Proteomics, Nestlé Research, EPFL Innovation Park, Lausanne, Switzerland;8Genomics, Nestlé Research, EPFL Innovation Park, Lausanne, Switzerland;9Pathology Department, CHU St-Etienne, France;10Surgery Department, CHU St-Etienne, France; and11Interuniversity Laboratory of Motricity and Biology (LIBM) EA 7424, Jean Monnet University, St-Etienne, France
ABSTRACT
Background:Constitutional thinness (CT) is a state of low but stable
body weight (BMI ≤18 kg/m2). CT subjects have normal-range
hormonal profiles and food intake but exhibit resistance to weight gain despite living in the modern world’s obesogenic environment.
Objective:The goal of this study is to identify molecular mecha-nisms underlying this protective phenotype against weight gain.
Methods: We conducted a clinical overfeeding study on 30 CT
subjects and 30 controls (BMI 20–25 kg/m2) matched for age
and sex. We performed clinical and integrative molecular and transcriptomic analyses on white adipose and muscle tissues.
Results: Our results demonstrate that adipocytes were markedly
smaller in CT individuals (mean ± SEM: 2174 ± 142 μm2)
compared with controls (3586 ± 216 μm2) (P < 0.01). The
mitochondrial respiratory capacity was higher in CT adipose tissue, particularly at the level of complex II of the electron transport
chain (2.2-fold increase; P < 0.01). This higher activity was
paralleled by an increase in mitochondrial number (CT compared
with control: 784± 27 compared with 675 ± 30 mitochondrial
DNA molecules per cell; P < 0.05). No evidence for uncoupled
respiration or “browning” of the white adipose tissue was found. In accordance with the mitochondrial differences, CT subjects had a distinct adipose transcriptomic profile [62 differentially expressed
genes (false discovery rate of 0.1 and log fold change >0.75)],
with many differentially expressed genes associating with positive metabolic outcomes. Pathway analyses revealed an increase in fatty
acid oxidation ( P= 3 × 10−04) but also triglyceride biosynthesis
(P= 3.6 × 10−04). No differential response to the overfeeding was
observed in the 2 groups.
Conclusions:The distinct molecular signature of the adipose tissue in CT individuals suggests the presence of augm ented futile lipid cycling, rather than mitochondrial uncoupling, as a way to increase energy expenditure in CT individuals. We propose
that increased mitochondrial function in adipose tissue is an important mediator in sustaining the low body weight in CT individuals. This knowledge could ultimately allow more targeted approaches for weight management treatment strategies. This trial
was registered at clinicaltrials.gov as NCT02004821. Am J Clin
Nutr 2019;110:605–616.
Keywords: constitutional thinness, futile lipid cycling, mitochon-dria, proteomics, respiration, transcriptome analysis, white adipose tissue
This study was supported by Nestlé Research.
Data described in the manuscript, code book, and analytic code will be made available upon request pending application and approval.
Supplemental Figures 1–10 and Supplemental Tables 1–6 are available from the “Supplementary data” link in the online posting of the article and from the same link in the online table of contents athttps://academic.oup .com/ajcn/.
Address correspondence to N Gheldof (e-mail:Nele.Gheldof@rd.nestle .com) or N Germain (e-mail:natacha.germain@chu-st-etienne.fr).
Abbreviations used: BAT, brown adipose tissue; BH-FDR, Benjamini– Hochberg False Discovery Rate; CI, mitochondrial complex I; CII, mi-tochondrial complex II; CT, constitutional thinness; DBH, dopamine β-hydroxylase; ETS, electron transport system; FC, fold change; FDR, false discovery rate; GO, Gene Ontology; H&E, hematoxylin and eosin; HR-pQCT, high-resolution peripheral quantitative computed tomography; mtDNA, mitochondrial DNA; PAL, physical activity level; REE, resting energy expenditure; RNA-seq, RNA sequencing; RQ, respiratory quotient; sWAT, subcutaneous white adipose tissue; Tc, body core temperature; TEE, total energy expenditure; UCP1, uncoupled protein 1.
Received January 22, 2019. Accepted for publication June 19, 2019. First published online August 2, 2019; doi: https://doi.org/10.1093/ajcn/ nqz144.
Am J Clin Nutr 2019;110:605–616. Printed in USA. Copyright©American Society for Nutrition 2019. All rights reserved. This is an Open Access article distributed under the terms of the Creative Commons Attribution Non-Commercial License (http://creativecommons.org/licenses/by-nc/4.0/), which permits non-commercial re-use, distribution, and reproduction in any medium, provided the original work is properly cited. For commercial re-use, please contact
journals.permissions@oup.com 605
Introduction
Given the ever-growing epidemics of obesity and weight-related health complications such as type 2 diabetes and cardio-vascular disease, many studies have focused on understanding metabolic changes associated with overweight and obesity. However, novel insights on metabolic differences in humans might also come from studying people on the extreme opposite side of obesity, a state called constitutional thinness (CT). CT is characterized by a stable low BMI, generally <18 kg/m2
(1, 2). Unlike in anorexia nervosa or other eating disorders associated with low weight, the nonpathological state of CT is defined by the lack of psychological features such as food aversion, refusal to eat alternated with binge eating, lower self-esteem, perfectionism, and body dissatisfaction (3). In contrast to lipodystrophic and anorexic individuals, CT subjects have body fat mass percentages considered in the healthy range (4), albeit lower than people generally considered lean (BMI: 19–24 kg/m2).
Hormonal profiles are similar to those of lean subjects: they have no detectable abnormalities of cortisol, growth hormone, insulin-like growth factor 1, or free triiodothyronine secretory patterns (2) and normal menstrual cycles (5). Lower leptin levels were detected in CT individuals compared with lean women (3). Daily calorie consumption is consistently similar in CT individuals and lean controls, while absolute resting metabolic rate is lower in CT individuals. In addition, CT women were found to be resistant to weight gain upon fat overfeeding (6).To
date, however, none of the studies on CT shed light on the possible molecular mechanisms involved in this thin, weight-resistant phenotype. Moreover, clinical characterization has focused on female CT individuals only, while the CT phenotype also exists in males. In this study, we evaluated plasma and/or urinary proteins and metabolites before and after a 2-wk overfeeding intervention in both female and male CT individuals compared with lean, normal-weight participants. We also analyzed mitochondrial function and transcriptomic profiles in the adipose tissue and muscle from CT and control subjects. Our results postulate that CT individuals are characterized by an adipose tissue–specific higher mitochondrial function as well as distinct transcriptomic profiles, testifying for altered lipid metabolism in CT. This observation suggests that altered adipose tissue metabolic activity is a hallmark of the CT phenotype.
Methods
Study participants and protocol
A summary flowchart of the study design is shown in
Supplemental Figure 1. Sixty-seven healthy young subjects,
free of continuous medication, were recruited, of whom a total of 60 completed the study (dropouts: 1 female CT individual, 3 male CT individuals, 2 female controls, 1 male control). Of these 60 subjects, 30 were assigned as CT (defined as having a BMI≤18.5 kg/m2 and recruited among outpatients consulting for body weight gain desire) and consisting of 15 females and 15 males. The low BMI and specific exclusion criteria (7) such as parameters for liver metabolic dysfunction (Supplemental Table 1) and psychological profiling were used to define the CT status. For the control group, 30 people were included (with a BMI from 20 to 25 kg/m2), with 15 females and 15 males. All recruited
participants were matched for age (18–35 y) and physical activity
levels (PALs). The primary outcome variables for the study were molecular differences between CT individuals and controls before and after 14 d of overnutrition evaluated in plasma, urine, and fat and muscle biopsy specimens. Secondary outcome measures included metabolic, anthropometric, and histological and energy metabolism differences between CT individuals and controls before, during, and after 14 d of overnutrition. We refer to Ling et al. (7) for the rationale and description of the clinical trial protocol, including the study design, measurement of body composition by DXA, bone quality by high-resolution peripheral quantitative computed tomography (HR-pQCT), and measurement of body core temperature and blood and urinary metabolites. Leptin was quantitatively measured with an ELISA kit (BioVendor). The detection limit was 1 ng/mL. Postprandial insulin and glucose responses were measured after an overnight fasting upon consumption of a standardized test meal [1 bottle of Renutryl Booster (Nestlé Health Science) consumed slowly during 15 min under surveillance]. Venous blood samples were collected in tubes containing aprotinin and EDTA at 7 time points: T0 = 0 min (after a 12-h overnight fasting), T15= 15
min (immediately after drinking the test meal), T30 = 30
min, T60 = 60 min, T90 = 90 min, T120 = 120 min, and
T150 = 150 min. Total lipid content in stool was measured
by near-infrared deflectance analysis (Fenir 8820; Perten) in homogenized samples. When stools were liquid, measurement of total lipids was done using traditional methods of titrimetry more appropriate than the near-infrared reflectance analysis method.
Overfeeding
After 2 wk of baseline assessments, all participants consumed a bottle of Renutryl Booster [Nestlé Health Science; 72 g carbohydrates (48.5%), 30 g proteins (20%), and 21 g fat (31.5%)] as an add-on to their usual food intake during 14 consecutive days, providing a 600-kcal surplus to their normal diet. Participants were required to consume the bottle in the interval of dinner to bedtime in free-living conditions and to maintain their usual dietary and normal lifestyle throughout the study. Body weight was measured throughout the study and was followed up at 2-wk postoverfeeding (ad libitum free-living period). Based on an earlier publication (6), we achieved 78% power for weight difference detection using 30 subjects per group (2-sided t test,α = 5%).
Energy balance measurements
Energy variables were evaluated under 2 conditions. First, in free-living conditions, food intake was measured by recording 2 × 7-d food diaries (before and after overfeeding). An accelerometer (Actiheart; CamNtech) (8) was used to monitor PALs in real life both at baseline and during overfeeding for 2× 5 d. Resting energy expenditure (REE) was measured at a 12-h fasting state in the supine position by indirect calorimetry using a canopy (Quark RMR; COSMED) before and after the overfeeding (9). Respiratory quotient (RQ) and fasting fat and carbohydrate oxidation rates were derived from the canopy. Free-living total energy expenditure (TEE) was obtained from TEE= REE × PAL. Second, the participants stayed for 2 visits
(before and after overfeeding) in an open-circuit whole-body calorimetric chamber, where standardized meals were given, and energy expenditure was measured by monitoring continuously for 24-h O2 and CO2 levels (10, 11). REE was calculated
as the 30-min average after waking up in the fasting state. As a complementary test to energy expenditure, internal body core temperature (Tc) was also measured by tracking with a noninvasive Jonah capsule temperature sensor (Respironic) (12) for at least 3 h postingestion before and after the overfeeding period. Time point T0 starts in the fasted state,∼45 min after ingestion of the sensor. Each time point is the average of 4 measurements per minute. The sensor was taken ∼60 min before starting a challenge with the meal test; hence, a drop in temperature was observed between 15 and 30 min and excluded from analysis so as not to confound the results.
Ethics
The study protocol was performed according to the Decla-ration of Helsinki, approved by the Ethics Committee France: ANSM (2013-A00590–45), and registered at clinicaltrials.gov as NCT02004821.
Plasma proteomics
Proteomic analysis was performed on 203 EDTA-plasma samples in a fasted state before (visit 1), during (visit 6), and 11 d after the overfeeding intervention (visit 9) (7) using LC-MS/MS. Full details characterizing the workflow and describing the laboratory method were previously reported (13,14). LC-MS/MS was performed with an Orbitrap Fusion Lumos Tribrid mass spectrometer and an Ultimate 3000 RSLC nano system (Thermo Scientific). Protein identification was performed against the human UniProtKB/Swiss-Prot database (26/10/2015 release) as previously described (14). A total of 999 proteins were measured. Biological references (identical pools of all individual plasma samples) were used to obtain relative protein quantification in each sample. A maximum of 30% missing quantitative values per protein was accepted. To identify proteins associated with the group classification (CT or control), the following logistic regression was fitted for each measured protein: Group ∼ LogFC_pi+ sex + age (to assess the effect of protein expression)
both at baseline and after the intervention. A Wald test was performed to assess the statistical significance of the coefficient of interest, LogFC_pi, which corresponds to the base 2 logarithm
of the ith protein ratio fold changes (FCs) with respect to biological references. Multiple testing correction was applied within each fitted model on the derived P values Benjamini– Hochberg False Discovery Rate (BH-FDR). A differential effect of the intervention on levels of proteins was evaluated using an ANOVA for repeated measurement testing an interaction between the period (time) and the CT status.
Adipose and muscle biopsies
Biopsies were carried out under local anesthesia. Human abdominal subcutaneous white adipose tissue (sWAT) samples were obtained from an area beneath the umbilicus by incision. Biopsied sWAT was immersed immediately in 2 mL ice-cold BIOPS (biopsy preservation solution) buffer on ice and split in several samples for histological, omics, and respiration assays.
Muscle biopsy specimens were taken from the vastus lateralis by incision, gently removing the tissue to avoid contraction of muscle fibers. One part was immediately further analyzed for respiration, while another part was snap-frozen for subsequent later transcriptomic analyses.
Mitochondrial respiration
Mitochondrial respiration assessment was carried out within 3 h after the biopsy was taken using the OROBOROS high-resolution respirometry (Oxygraph-2k; Oroboros Instruments) before and after overfeeding (sWAT from 5 female CT individu-als, 5 male CT individuindividu-als, 9 female controls, and 4 male controls and muscle from 4 female CT individuals, 5 male CT individuals, 4 female controls, and 4 male controls). The protocol was used as previously described (15) to evaluate leak, complex I (CI), CI and complex II (CII), CII, and maximal electron transport system (ETS) respiration. Respirometry medium (MiR05) was used for the assay and was prepared as described by OROBOROS protocols (16,17).
Staining and imaging of adipose tissue
Tissues were collected, fixed, and stabilized using Paxgene tissue containers (Qiagen) and paraffin embedded and sectioned (4μm). Hematoxylin and eosin (H&E) staining was performed to determine adipocyte area. Slides were scanned with the Aperio AT2 (Leica; 20×amplification). Ten to 12 images (containing at least 80 adipocytes per image) were evaluated per sample using the Adiposoft software (18) in a semiautomated fashion with manual removal of false positives and negatives (including removal of areas<350 μm2). To evaluate the size distribution frequency, histograms were made by grouping areas from 350 to 15,000 in 500-μm2increments.
Immunohistochemistry for uncoupling protein 1 (UCP1) was performed with primary polyclonal rabbit UCP1 antibody (dilution 1:20, 1-UN009–07; Quartett) on paraffin-embedded tissue sections using an automated immunostainer (BOND-III; Leica Biosystems). As positive control, we used human brown adipose tissue (BAT), taken from around the adrenal gland of a male newborn.
Mitochondrial DNA quantification
Mitochondrial DNA (mtDNA) content analysis in baseline adipose tissue was carried out by quantitative real-time PCR. Briefly, DNA was extracted from the sWAT samples by the classical phenol/chloroform extraction method, and TaqMan real-time PCR was performed on the LightCycler 480 (Roche) using primers specific to human mtDNA in the RNR2 and
MT-ND4 genes and primers specific to ALB and TFRC, single-copy
genes taken as nuclear gene references, as described in Marquis et al. (19).
Gene expression analysis by RNA sequencing
Total RNA was extracted by pulverizing tissues using a Cryoprep CP02 and TT1 bags (Covaris). Then, ∼10 mg pow-dered muscle or∼100 mg powdered adipose tissue, respectively,
was introduced in a Lysing Matrix D tube (MP Biomedicals) placed on ice. Next, 500μL lysis buffer (Agencourt RNAdvance Tissue Kit; Beckman Coulter) was added. The tubes were firmly closed and agitated for 2 × 1 min at speed 6 on a FastPrep-24 (MP Biomedicals). RNA was then extracted using the Agencourt RNAdvance Tissue Kit (Beckman Coulter) following the provider’s recommendations and quantified using the Quant-iT RiboGreen RNA Assay Kit (Invitrogen) on a Spectramax M2 (Molecular Devices). RNA quality was assessed using a Fragment Analyzer 96 with a Standard Sensitivity RNA Analysis Kit (Advanced Analytical Technologies). Sequencing libraries were prepared from 250 ng total RNA using the TruSeq Stranded Total HT Gold Kit (Illumina) with the Ribo-Zero Gold depletion set. The procedure was automated on a Sciclone NGS Workstation (Perkin Elmer). The manufacturer’s protocol was followed, except for the PCR amplification step. The latter was run for 12 cycles with the KAPA HiFi HotStart ReadyMix (Kapa BioSystems). This optimal PCR cycle number has been evaluated using the cycler correction factor method as described previously (20). Purified libraries were quantified with Picogreen (Life Technologies), and the size pattern was controlled with the DNA High Sensitivity Reagent kit on a LabChip GX (Perkin Elmer). Libraries were then pooled by 62. Four pools were generated, and each pool was clustered at a concentration of 9 pmol on 8 lanes of v4 high-output paired-end sequencing flow cells (Illumina). Ten flow cells were necessary to obtain the necessary read depth. Sequencing was performed for 2× 125 cycles on a HiSeq 2500 strictly following Illumina’s recommendations.
The demultiplexing and the quality control steps were per-formed as described in Armenise et al. (21). Briefly, sequencing data were demultiplexed with the Bcl2FastQ Demux Pipeline (UBP_ bcl2fastq v2.19.1). The resulting FASTQ files were mapped onto the human genome (GRCh37.75 assembly) with STAR2.5.3a using default parameters. Multimapper reads, PCR duplicates, and reads with more than 5 mismatches were filtered out. For each sample, the number of reads mapping onto genes was retrieved using HTSEq software. Only reads with both ends mapping onto 1 single gene were considered. Low expressed genes were excluded by using the threshold of at least 1 count per million in a third of the samples. Counts were transformed using the voom transformation (22). To identify genes associated with the group classification (CT or control), the following logistic regressions were fitted for each measured gene: 1) group ∼ transformed count genei+ sex + age (to assess the effect of gene
expression), and 2) group∼ transformed count geneisex+ age
(to assess interaction between gene expression and sex). A Wald test was performed to assess the statistical significance of the coefficient of interest (either transformed count geneifor model
1 or the interaction term for model 2). Multiple testing correction was applied within each fitted model on the derived P values (BH-FDR).
For differential expression analyses after the overfeeding inter-vention, the difference between postintervention and baseline was derived as follows: transformed counts after overfeeding – trans-formed counts at baseline (LogFC_count). Logistic regressions were fitted as before: group∼ LogFC_count + sex + age and group∼ LogFC_countsex + age. Pathway and Gene Ontology (GO) enrichment analysis was performed within Ingenuity Pathway Analysis (Qiagen Bioinformatics), as well as Enrichr
(23). Genes that passed the false discovery rate (FDR)–adjusted
P value< 10% were used as the input data. Validation of gene expression using Nanostring
Gene expression was validated using Nanostring technology. The RNA samples derived from adipose tissue at baseline were used. Probes were designed for the top 62 genes differentially expressed in baseline adipose tissue samples between CT and control individuals from RNA sequencing (RNA-seq) analysis, as well as 9 normalization genes (manually selected based on stable expression in RNA-seq analysis and covering a range of expression levels). Normalization was performed by the Nanostring software. Principal component analysis of the expression FC on the quality-controlled data set did not identify any outliers. For all genes, a correlation test between RNA-seq and Nanostring gene quantification was performed using a nonparametric Spearman correlation test. Benjamini–Hochberg multiple testing correction was applied on corresponding P values.
Statistical analysis of clinical and molecular variables Statistical analyses were performed using R version 3.4.3. Quality control checking of the data was performed to measure missing values proportion and identify outliers by using the IQR range with values set as missing if out of the mean± 3 × IQR range. Because of technical issues, data from 2 participants were excluded (1 control male and 1 CT female). A 2-way ANOVA for repeated measures with age and sex as covariates was conducted with each of the biochemical measures. The effect of group (CT and control status), time (pre- compared with postintervention), and group× time interaction was examined. A sex interacting effect was also added to the model. A group× time interaction measured a different change of the measure over the intervention in the 2 groups. For plasma kinetics of insulin and glucose up to 150 min postingestion of the test meal and internal body temperature, a 3-way repeated-measures ANOVA was used with age and sex as covariates. A logistic regression with age and sex as confounders and sex as interaction term was used to test the association between the status and blood biochemical outcome available at baseline only. For each set of measures (vital signs, lipid metabolism, glucose metabolism, blood and urinary biochemistry, energy variables), a Bonferroni correction was considered to account for multiple testing.
Results
Clinical characterization of CT individuals at baseline Table 1summarizes the results of the clinical characterization of the subjects at baseline. As a sex interaction was not observed for most variables, we combined both sexes within each group. Total fat and lean mass were lower in CT individuals compared with controls (both in absolute and relative terms). We also identified lower systolic and diastolic blood pressure in CT individuals compared with controls. To exclude that the lower weight in CT individuals might be related to defects in gastrointestinal fat absorption, such as steatorrhea, we evaluated
TABLE 1 Clinical variables in CT (n= 29, 14 females and 15 males) compared with control (n = 29, 15 females and 14 males) individuals at baseline1
Characteristic CT Control CT status, P CT status× sex, P
Age, y 24.97± 4.7 22.63± 2.93
BMI, kg/m2 16.96± 0.74 22.99± 1.03
Waist-hip ratio 0.77± 0.06 0.78± 0.07 0.042 0.28
Total fat, kg 9.71± 1.86 18.71± 5.20 1.7× 10−23∗ 0.98
Total fat body mass, % 19.59± 4.97 27.09± 7.89 4.5× 10−08∗ 0.53
Total lean body mass, kg 39.28± 6.70 49.79± 9.70 2.0× 10−26∗ 0.72
Total lean body mass, % 80.41± 4.97 72.56± 8.13 4.4× 10−08∗ 0.61
Heart rate, bpm 69.21± 10.68 65.28± 10.38 0.033 0.031
Systolic blood pressure, mm Hg 115.07± 11.86 125.72± 9.83 4.2× 10−05∗ 0.17 Diastolic blood pressure, mm Hg 66.21± 9.36 71.21± 6.67 6.0× 10−04∗ 0.079
Fat stool, g/24 h 3.16± 2.13 4.14± 2.31 0.25 0.39
Energy variables Free-living condition
Total caloric intake, kcal/24 h 2179.62± 433.09 2004.55± 482.75 0.45 0.062
Carbohydrates, g 264.14± 65.22 227± 58.01 0.16 0.036
Protein, g 79.48± 19.53 80.34± 20.24 0.3 0.053
Lipids, g 88.52± 18.64 81.38± 20.24 0.77 0.23
Snacking calories, kcal/24 h 328.2± 192.67 177.08± 138.82 2.1× 10−03∗ 0.82
Snacking frequency 1.47± 0.72 0.95± 0.48 7.7× 10−03∗ 0.88
Physical activity level 1.55± 0.21 1.75± 0.21 9.1× 10−04∗ 0.016
Fasting respiratory quotient 0.82± 0.04 0.8± 0.05 0.6 0.07
Fat oxidation index, mg/min/kg 1.00± 0.31 0.91± 0.27 0.016∗ 0.027
Carbohydrate oxidation index, mg/min/kg 1.34± 0.84 0.80± 0.59 0.022 0.16
REE, kcal/24 h 1255.14± 228.91 1466.83± 239.82 1.4× 10−10∗ 0.62
TEE, kcal/24 h 1966.14± 458.79 2561.8± 591.65 2.5× 10−10∗ 0.15
Calorimetric chamber
Total caloric intake, kcal/24 h 1919.71± 267.5 2007.39± 235.53 0.025 0.800
REE, kcal/24 h 1442.53± 386.89 1653.98± 331.45 8.10× 10−08∗ 0.62 TEE, kcal/24 h 1819.77± 243.94 2180.2± 284.21 9.10× 10−20∗ 0.88 Lipid metabolism Cholesterol, mmol/L 4.46± 0.78 4.13± 0.78 0.74 0.29 HDL-C, mmol/L 1.55± 0.36 1.36± 0.35 0.18 0.82 LDL-C, mmol/L 2.48± 0.76 2.30± 0.72 0.83 0.55 Triglycerides, mmol/L 0.93± 0.26 0.87± 0.29 0.59 0.33 Glycerol,μmol/L 31.24± 28.47 23.78± 20.08 0.55 0.19 NEFAs,μmol/L 389.97± 202.38 372± 223.82 0.29 0.71 Glucose metabolism
Fasting glucose, mmol/L 4.66± 0.34 4.68± 0.44 0.81 0.46
Fasting insulin, mUI/L 6.07± 3.67 7.51± 2.75 5.7× 10−04∗ 0.36
Blood biochemical parameters
IGF-1,μg/L 241.62± 86.59 254.8± 52.51 0.033 0.097 Leptin,μg/L 3.76± 2.23 9.34± 6.77 0.34 0.27 Metadrenaline, nmol/L 0.20± 0.09 0.16± 0.06 0.18 0.75 Normetadrenaline, nmol/L 0.38± 0.11 0.34± 0.1 0.11 0.063 TSH, mUI/L 2.38± 1.31 2.06± 1.01 0.38 0.33 Free T3, pmol/L 5.98± 1.99 5.44± 0.66 0.66 0.52 Free T4, pmol/L 16.83± 3.38 17.21± 1.68 0.99 0.2 Urinary metabolites Creatinine, mmol/L 10.05± 2.78 13.75± 3.6 4.7× 10−11∗ 0.56 Urea, mmol/L 263.11± 95.08 385.52± 143.25 3.5× 10−09∗ 0.17
Uric acid, mmol/L 2.62± 0.78 3.53± 0.94 7.0× 10−09∗ 0.92
1Data are presented as means± SDs. P values are assessed by repeated-measures ANOVA for outcomes adjusted for sex and age. A Bonferroni correction was applied for each set of measure to define a result as significant (defined by∗). bpm, beats per minute; CT, constitutional thinness; HDL-C, HDL cholesterol; IGF-1, insulin-like growth factor 1; LDL-C, LDL cholesterol; NEFA, nonesterified fatty acid; REE, resting energy expenditure; TEE, total energy expenditure; TSH, thyrotropin; T3, triiodothyronine; T4, thyroxine.
potential excess accumulation of fat in the feces (24). However, neither visual inspection by the Bristol stool scale nor fat quantification in the stool showed any differences between the groups. Food intake was not different between the 2 groups, both in free-living as well as in the calorimetric chambers, and
the proportions for each macronutrient category were similar between the groups (consisting on average of 48% carbohydrates, 37% lipids, and 15% protein relative caloric intake). Snacking frequency and snacking caloric intake were significantly higher in CT individuals than controls, confirming previous results
(6). Based on Actiheart measurements, we did not observe higher spontaneous physical activity in CT compared with control individuals. Rather, CT individuals had lower physical activity compared with controls. Both REE and TEE were significantly lower in CT individuals compared with controls in both free-living and calorimetric chamber conditions, but this difference was blunted when correcting for fat-free mass (P= 0.92 in canopy and P = 0.12 in the calorimetric chamber) (Supplemental Figure 2 ). Fasting RQ by canopy measurement was similar between CT individuals and controls while fasting fat oxidation rate was higher in CT individuals than controls, and the carbohydrate oxidation index was highly variable and nominally higher in CT individuals. To complement standard energy expenditure measures, we also tracked internal Tc for 3 h postingestion with a noninvasive Jonah capsule temperature sensor. Overall results show a slightly higher Tc in CT individuals compared with controls at baseline (Supplemental Figure 3 A; ANOVA, P= 0.0087), with an average increase of +0.14◦C pre-and postmeal.
Assessment of bone quality of the radius and tibia by HR-pQCT demonstrated that many bone quality parameters were lower in CT individuals compared with controls, with the main differences observed in tibia (Supplemental Table 2), confirming previous results in females (25). The lower bone quality was observed in both sexes.
At baseline, on the molecular level, circulating lipid metabo-lites, including cholesterol, triglycerides, free fatty acids, and fasting and postprandial kinetics of glucose and kinetics of insulin, were similar between the groups (Table 1, Supplemental Figure 3B and 3C), confirming previous results (2), while fasting insulin levels were lower in CT individuals. Measured urinary metabolites, including urea, creatinine, and uric acid, were significantly lower in CT individuals than control subjects (FC 0.68, 0.73, and 0.74, respectively). Untargeted proteomic analyses of the plasma samples revealed 11 proteins that were differentially abundant between CT individuals and controls at baseline (Supplemental Table 3), including insulin-like growth factor binding protein 2 and dopamine β-hydroxylase (DBH) among the top plasma proteins with increased levels in CT individuals compared with controls.
Molecular analyses of adipose tissue and muscle demonstrate a distinct adipose-specific mitochondrial signature in CT
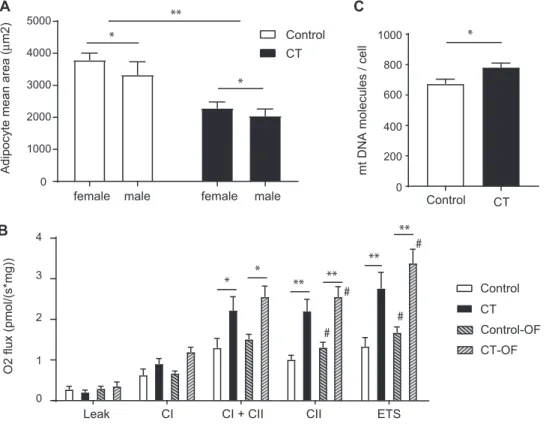
To characterize the metabolic state of CT individuals in more depth, we next performed analyses on 2 key metabolic tissues, adipose tissue and muscle. H&E staining of the sWAT did not reveal any visual difference in terms of extracellular matrix remodeling or inflammation. CT individuals had a marked smaller adipocyte size (black bars, 2174± 142 μm2) compared
with controls (white bars, 3586 ± 216 μm2) at baseline (P< 0.001) (Figure 1A). This decrease was reflected by a higher frequency of small adipocytes in CT individuals (Supplemental
Figure 4). In addition, males overall had on average smaller
adipocytes than their female counterparts (males, 2666± 253
μm2; females, 3067 ± 197 μm2) (P < 0.05) (Figure 1A).
We then evaluated the mitochondrial function through high-resolution respirometry analyses in both sWAT and skeletal muscle. The oxygen fluxes during leak respiration—independent
of ADP-phosphorylating activity—were similar between CT individuals and controls (Figure 1B), suggesting that there was no difference in uncoupling. Immunohistochemical staining of UCP1 also revealed the lack of presence of UCP1 in the sWAT samples compared with a human BAT sample used as positive control (Supplemental Figure 5). Interestingly, we observed significantly higher mitochondrial CII activity in CT individuals (FC 2.17, P= 0.001), as well as CI + CII activity (FC 1.71, P = 0.03) and maximal ETS activity (FC 2.07,
P = 0.001) compared with controls. No significant difference in
mitochondrial activity was detected between males and females. To evaluate if the increase in CII and ETS activity was due to an increase in mitochondrial number, we performed a quantitative mtDNA assay (defined as ratio of mitochondrial compared with nuclear DNA). The results showed a significantly higher amount of mtDNA per adipocyte (CT 784 ± 27 mtDNA molecules compared with control 675± 30 mtDNA molecules per cell) (P= 0.02) (Figure 1C), with no sex difference observed. This suggests that adipocytes of CT individuals have an increased number of mitochondria and that this contributes, at least in part, to the increased CII and ETS activity observed in CT. In skeletal muscle, uncoupled respiration (leak) was not different in CT individuals compared with controls (Supplemental Figure 6). Similarly, maximal respiration in the coupled state, with electron input through CI alone, CI and CII, CII alone, or maximal ETS capacity, was comparable between CT individuals and controls, even though there was a tendency toward lower CI and CII and ETS capacity, but it was not statistically significant. This suggests that the higher mitochondrial activity and content observed in sWAT of CT individuals are not due to a systemic difference in mitochondrial regulation, but rather are specific to the white adipose tissue.
Transcriptomic profiling of adipose tissue and muscle confirm altered lipid metabolism in CT
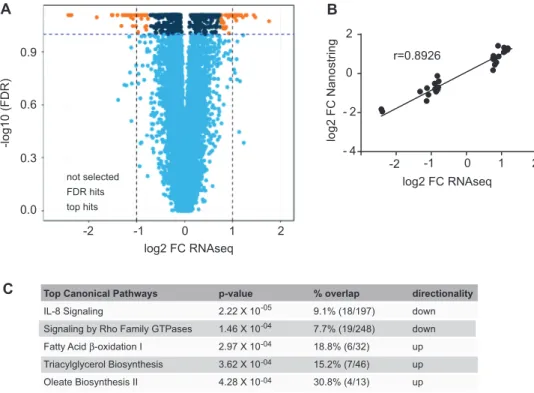
To gain further insights into the molecular basis of the observed differences in mitochondrial respiration and content, we profiled the RNA expression levels of the sWAT and muscle by total RNA-seq. Comparison of the expression profiles in sWAT revealed significant differences between the 2 groups (Figure 2A). We did not observe any sex differences in the gene expression profiles. Using an FDR of 0.1 and a log2 FC
threshold of 0.75, we identified 88 Ensembl gene IDs (ENSG) differentially expressed between CT individuals and controls, of which 62 corresponded to annotated genes. To validate the gene expression results, we designed probes for those 62 genes and assessed gene expression by Nanostring technology. RNA-seq and Nanostring data amply correlated (Figure 2B, Spearman’s
r= 0.8926, P < 0.0001), and 54 genes passed the threshold
FDR of 0.1, corresponding to a validation of 87% of the RNA-seq results. Given the higher number of mitochondria found in CT, we first performed a GO cellular component enrichment analysis and found 21 terms that had a significant adjusted P value lower than 0.01, of which 9 belonged to the mitochondria (Supplemental Table 4), showing indeed an enrichment in genes belonging to the mitochondrial cellular component. In parallel, pathway analyses of the entire data set revealed increased oxidative metabolism as evidenced by significant upregulation of fatty acid oxidation but strikingly also triglyceride biosynthesis
0 200 400 600 800 1000 female 0 1000 2000 3000 4000 5000
Adipocyte mean area (
µ m2) Control CT female male male A
mt DNA molecules / cell
Control CT
C
B
Leak CI CI + CII CII ETS
O2 flux (pmol/(s*mg)) ** * * ** 0 1 2 3 4 Control CT Control-OF CT-OF # # # ** * * * ** # **
FIGURE 1 Distinct differences in adipose tissue in constitutional thinness (CT). (A) Adipocyte area (μm2) measured by histological analysis. Values are expressed as mean and SEM. Mean values are from at least 10 pictures per slide (capturing more than 1000 cells per sample). Black bars correspond to CT individuals ( n= 29, 15 females and 14 males), while white bars correspond to the controls (n = 29, 15 females and 14 males). (B) Respirometry analyses in subcutaneous white adipose tissue (sWAT) using high-resolution respirometry. Values are expressed as mean and SEM from 10 CT individuals (5 females, 5 males; black bars) and 13 controls (9 females, 4 males; white bars) before and after overfeeding (OF; dashed bars). CI, complex I respiration; CI+ CII, complex I and II respiration; CII, complex II activity alone; ETS, maximal electron transport system capacity. (C) Mitochondrial DNA content in sWAT at baseline in CT individuals ( n= 29) compared with controls (n = 29). Associations between CT status and variables were tested using a logistic regression adjusted on confounders (age and sex) at baseline and after intervention. Statistical significance level after correction for multiple testing when comparing CT versus controls is indicated by∗for P< 0.05 and∗∗for P< 0.01, while#indicates a significance level at P < 0.05 of the intervention (before vs after intervention).
(Figure 2C). In addition, the IL-8 signaling pathway was reduced. IL-8 is a key proinflammatory mediator, known to be associated with obesity (26). Enrichment using the MGI Mammalian Phenotype identified nominal enrichment in abnormal lipid levels (MP0001547), decreased body fat amount (MP0010025), and other interesting enrichments such as altered angiogenesis (MP0000260) and improved glucose tolerance (MP0005292) (Supplemental Table 5). Consistently, by zooming in on the specific top differentially expressed genes (Table 2), we found that many of the differences were associated with known positive metabolic outcomes in CT. These included decreased
LEP, EGFL6, MMP9, and HSD11B1; elevated APOC1; and
increased fatty acid synthesis, including elevated expression of FASN, SCD, ELOVL6, and AACS. Several antiangiogenic factors (THBS1, TNMD, and EGFL6), as well as oxidative stress factors (HSPB7, CRYAB, and UCHL1), were significantly downregulated. In addition, we identified multiple differentially expressed genes that have not been previously described for a potential role in metabolism. RNA-seq profiling in skeletal muscle samples did not reveal any significantly differentially expressed genes between CT individuals and controls (passing FDR of 0.1) (Supplemental Figure 7). The lack of robust transcriptomic alterations in the muscle is in line with the fact
that respiration in CT muscle is not significantly affected either. We therefore postulate that the molecular signature correlating with the CT phenotype is most likely specifically linked to an alteration in lipid metabolism in the adipose tissue rather than a systemic difference in mitochondrial biogenesis affecting other metabolically active tissues as well.
Short-term overfeeding did not result in a different metabolic response in CT subjects
To investigate whether the metabolic response to overfeeding was different in CT compared with controls, the participants were next given a 600-kcal surplus to their diet for 14 d (300-mL shake in the evening, containing 30 g protein, 72 g carbohydrate, and 21 g fat). Overall compliance to the overfeeding regimen was confirmed by a significant increase in urea excretion in both groups relative to the baseline (FC 1.22, P < 0.001) (Supplemental Table 6). Both groups gained a small but significant amount of weight during the overfeeding (P< 0.001), but no significant difference in weight gain was observed between the 2 groups (Supplemental Figure 8). Even though some clinical and energy balance parameters were altered upon
A B 0.0 0.6 0.9 -2 -log10 (FDR) 0.3 -1 0 1 2 log2 FC RNAseq not selected FDR hits top hits
Top Canonical Pathways IL-8 Signaling
Signaling by Rho Family GTPases Fatty Acid β-oxidation I
Triacylglycerol Biosynthesis Oleate Biosynthesis II p-value 2.22 X 10 1.46 X 10 2.97 X 10 3.62 X 10 4.28 X 10 % overlap 9.1% (18/197) 7.7% (19/248) 18.8% (6/32) 15.2% (7/46) 30.8% (4/13) directionality down down up up up C - 4 - 2 0 2 -2 -1 0 1 2 log2 FC RNAseq lo g2 FC N an ostrin g r=0.8926 -05 -04 -04 -04 -04
FIGURE 2 Transcriptomic analyses of adipose tissue at baseline. (A) Volcano plot showing differential expression of constitutional thinness (CT) (n= 30) compared with control (n = 30) individuals. Dashed lines correspond to the log2 fold change (FC) and false discovery rate (FDR) of 10%. The top differentially expressed hits are represented by orange dots, the significant hits but not strongly differentially expressed are represented by dark blue dots, and the nonsignificant hits not selected are represented by light blue dots. Differential expression was tested by using a logistic regression model correcting for age and sex followed by a Wald test to assess the statistical significance of the coefficient of interest. As no sex interaction was found, association was evaluated without interaction term. Benjamini–Hochberg multiple testing correction was applied within the fitted model on the derived P values (FDR). (B) Correlation is shown between RNA sequencing (RNA-seq) and Nanostring gene expression analysis of top 65 differentially expressed genes, tested using a nonparametric Spearman correlation (Spearman’s r= 0.8926; 95% CI: 0.82, 0.94; P < 0.0001). (C) Ingenuity Pathway Analysis showing the top 5 significantly affected pathways. Genes that passed the FDR-adjusted P value< 10% were used as input data (orange and dark blue dots in the volcano plot, corresponding to 753 genes). Percentage overlap with the corresponding pathway is shown, as well as the number of hits compared with total number of genes in the pathway in parentheses.
overfeeding (Supplemental Table 6), no differences in response to the overfeeding were observed in CT individuals compared with controls. Similarly, tissue respiration (Figure 1B, Supplemental Figure 6) and transcriptomic profiling (Supplemental Figures 9 and 10), as well as plasma proteomics (Supplemental Table 3), all showed some differences upon the intervention, but none demonstrated a differential response to the overfeeding between CT individuals compared with controls. Together, these results demonstrate that the molecular response to the overfeeding is similar in CT individuals compared with controls and that the main molecular differences observed at baseline remain present after the overfeeding.
Discussion
CT individuals are a unique group of people who, despite our modern world’s obesogenic environment, are characterized by very low absolute fat and lean body mass. However, unlike lipodystrophic people, their relative fat mass is in a similar range to normal-weight people, and they do not exhibit hypertriglyc-eridemia or have any evidence of ectopic lipid accumulation. They are therefore considered healthy people. Results from our study show that there is no sign of gastrointestinal fat malabsorption, as evidenced by a similar amount of fat in the
stool. In the present study, we show for the first time, to our knowledge, that there are distinct molecular differences in the adipose tissue of CT individuals compared with that of normal-weight people: the adipocytes of CT individuals are smaller, contain a higher number of mitochondria that are more active, and have a distinct transcriptomic profile. CT people also have lower lean body mass, and the lower urinary secretion of creatinine, uric acid, and urea in CT individuals is associated with this lower lean mass. A reduced percentage of oxidative type I fibers and cytochrome C oxidase activity within type I fibers has been reported in skeletal muscle samples from CT females (27). Yet, the activity of other major enzymes playing a role in the pre- and post-mitochondrial respiratory chain activity was not different (5,27). Our data on respiration or transcriptomic profiles of the entire skeletal muscle samples could not confirm any significant differences in oxidative potential or mitochondrial activity in muscle from CT individuals. The results from our present study therefore point toward a difference in lipid metabolism in CT and not a systemic difference in mitochondrial biogenesis.
Interestingly, not only is the total amount of mitochondria per adipocyte greater in CT individuals, but respiration assays also showed a specifically higher activity of mitochondrial CII in both male and female adipose tissue, resulting in elevated electron transport chain activity. This greater CII flux rate in
TABLE 2 List of genes differentially expressed in adipose tissue at baseline from CT (n= 30) compared with control (n = 30) individuals at baseline1
RNA-seq Nanostring
Ensembl gene ID Symbol Entrez gene name
Expression log2
FC Expression FDR
Expression log2
FC Expression FDR Correlation FDR ENSG00000198759 EGFL6 Epidermal GF-like domain multiple 6 –2.422 7.78× 10− 02 –1.829 1.17× 10− 02 7.10× 10− 10
ENSG00000119125 GDA Guanine deaminase –2.392 7.78× 10− 02 –1.947 1.87× 10− 02 2.50× 10− 13
ENSG00000123119 NECAB1 N-terminal EF-hand calcium binding protein 1 –2.355 7.78× 10− 02 –3.142 7.00× 10− 03 6.00× 10− 31 ENSG00000100985 MMP9 Matrix metallopeptidase 9 –1.83 8.02× 10− 02 –1.423 1.47× 10− 02 1.20× 10− 10 ENSG00000113389 NPR3 Natriuretic peptide receptor 3 –1.519 7.78× 10− 02 –1.683 5.49× 10− 03 2.20× 10− 16 ENSG00000079689 SCGN Secretagogin, EF-hand calcium binding protein –1.293 7.78× 10− 02 –0.627 5.43× 10− 02 2.20× 10− 16
ENSG00000174697 LEP Leptin –1.243 7.78× 10− 02 –1.214 3.98× 10− 03 2.20× 10− 16
ENSG00000154277 UCHL1 Ubiquitin C-terminal hydrolase L1 –1.218 7.78× 10− 02 –1.081 4.25× 10− 03 7.40× 10− 31 ENSG00000182255 KCNA4 Potassium voltage-gated channel subfamily A m4 –1.132 7.78× 10− 02 –1.407 6.41× 10− 03 2.20× 10− 19 ENSG00000183117 CSMD1 CUB and Sushi multiple domains 1 –1.122 8.02× 10− 02 –0.748 1.87× 10− 02 2.80× 10− 05
ENSG00000113739 STC2 Stanniocalcin 2 –1.108 7.78× 10− 02 –1.116 6.61× 10− 03 2.50× 10− 08
ENSG00000172995 ARPP21 cAMP-regulated phosphoprotein 21 –1.078 8.17× 10− 02 –1.089 5.49× 10− 03 1.30× 10− 04 ENSG00000137801 THBS1 Thrombospondin 1 –1.041 7.78× 10− 02 –1.020 3.98× 10− 03 2.20× 10− 16 ENSG00000163075 CFAP221 Cilia flagella-associated protein 221 –1.024 7.78× 10− 02 –1.135 3.98× 10− 03 2.20× 10− 16
ENSG00000000005 TNMD Tenomodulin –0.975 7.78× 10− 02 –0.768 5.36× 10− 03 2.20× 10− 16
ENSG00000158714 SLAMF8 SLAM family member 8 –0.975 9.79× 10− 02 –0.892 5.58× 10− 02 4.80× 10− 07
ENSG00000186439 TRDN Triadin –0.972 9.70× 10− 02 –1.188 1.24× 10− 02 2.20× 10− 16
ENSG00000178826 TMEM139 Transmembrane protein 139 –0.943 7.78× 10− 02 –1.049 1.47× 10− 02 8.90× 10− 14 ENSG00000099957 P2RX6 Purinergic receptor P2× 6 –0.919 7.78× 10− 02 –1.229 5.22× 10− 03 1.60× 10− 10
ENSG00000110092 CCND1 Cyclin D1 –0.893 7.78× 10− 02 –0.804 4.30× 10− 03 2.20× 10− 16
ENSG00000164188 RANBP3L RAN binding protein 3 like –0.868 7.78× 10− 02 –1.020 6.41× 10− 03 2.20× 10− 16
ENSG00000109846 CRYAB CrystallinαB –0.858 7.78× 10− 02 –0.935 3.98× 10− 03 2.20× 10− 16
ENSG00000117154 FCGBP Immunoglobin superfamily member 21 –1.3181 8.97× 10− 02 –0.921 4.49× 10− 02 8.40× 10− 08
ENSG00000188778 ADRB3 Adrenoceptorβ3 –0.824 9.09× 10− 02 –0.720 4.82× 10− 03 2.20× 10− 16
ENSG00000102359 SRPX2 Sushi repeat containing protein, X-linked 2 –0.816 7.78× 10− 02 –0.852 3.98× 10− 03 4.90× 10− 31 ENSG00000173641 HSPB7 Heat shock protein family B (small) m7 –0.811 7.78× 10− 02 –0.813 3.98× 10− 03 2.20× 10− 16 ENSG00000117594 HSD11B1 Hydroxysteroid 11-β dehydrogenase 1 –0.803 8.99× 10− 02 –0.704 2.54× 10− 02 2.20× 10− 16 ENSG00000147852 VLDLR Very-low-density lipoprotein receptor –0.767 8.17× 10− 02 –0.883 4.82× 10− 03 2.20× 10− 16
ENSG00000077274 CAPN6 Calpain 6 0.76 7.78× 10− 02 0.777 3.98× 10− 03 2.20× 10− 16
ENSG00000169710 FASN Fatty acid synthase 0.769 8.58× 10− 02 0.727 5.49× 10− 03 2.20× 10− 16 ENSG00000206384 COL6A6 Collagen type VIα6 chain 0.772 7.78× 10− 02 0.903 4.55× 10− 03 2.20× 10− 16 ENSG00000183798 EMILIN3 Elastin microfibril interfacer 3 0.811 9.27× 10− 02 0.449 5.96× 10− 02 9.30× 10− 05 ENSG00000081760 AACS Acetoacetyl-CoA synthetase 0.816 8.60× 10− 02 0.783 7.52× 10− 03 2.20× 10− 16 ENSG00000166126 AMN Amnion-associated transmembrane protein 0.855 7.78× 10− 02 0.568 7.63× 10− 02 1.70× 10− 04 ENSG00000112394 SLC16A10 Solute carrier family 16 member 10 0.866 7.78× 10− 02 1.447 3.98× 10− 03 8.60× 10− 13 ENSG00000060709 RIMBP2 RIMS binding protein 2 0.87 9.10× 10− 02 0.708 1.12× 10− 02 2.20× 10− 16 ENSG00000253379 EYA1 EYA transcriptional coactivator and phosphatase 1 0.902 7.78× 10− 02 1.419 3.98× 10− 03 1.50× 10− 17 ENSG00000099194 SCD Stearoyl-CoA desaturase 0.911 7.78× 10− 02 1.100 3.98× 10− 03 2.20× 10− 16 ENSG00000124003 MOGAT1 Monoacylglycerol O-acyltransferase 1 0.912 8.02× 10− 02 1.213 3.98× 10− 03 2.20× 10− 16 ENSG00000168702 LRP1B LDL receptor-related protein 1B 0.919 7.78× 10− 02 0.717 5.44× 10− 02 2.20× 10− 16
ENSG00000130208 APOC1 Apolipoprotein C1 0.92 7.78× 10− 02 0.870 2.76× 10− 02 2.20× 10− 16
ENSG00000140284 SLC27A2 Solute carrier family 27 member 2 0.926 9.88× 10− 02 1.132 1.32× 10− 02 2.20× 10− 16
ENSG00000113494 PRLR Prolactin receptor 0.979 7.78× 10− 02 1.080 5.27× 10− 03 2.20× 10− 16
ENSG00000198963 RORB RAR-related orphan receptor B 0.986 7.78× 10− 02 0.877 5.49× 10− 03 2.20× 10− 16 ENSG00000138678 GPAT3 Glycerol-3-phosphate acyltransferase 3 1.065 7.78× 10− 02 1.087 9.85× 10− 03 2.20× 10− 16 ENSG00000164879 CA3 Carbonic anhydrase 3 1.072 7.78× 10− 02 1.327 7.52× 10− 03 2.20× 10− 16
ENSG00000135744 AGT Angiotensinogen 1.087 7.78× 10− 02 1.116 4.82× 10− 03 2.20× 10− 16
ENSG00000143365 RORC RAR-related orphan receptor C 1.098 7.78× 10− 02 1.660 3.98× 10− 03 2.20× 10− 16 ENSG00000145428 RNF175 Ring finger protein 175 1.098 7.78× 10− 02 1.119 1.87× 10− 02 7.60× 10− 09 ENSG00000170522 ELOVL6 ELOVL fatty acid elongase 6 1.167 7.78× 10− 02 1.204 8.19× 10− 02 2.20× 10− 16
ENSG00000160339 FCN2 Ficolin 2 1.181 7.78× 10− 02 1.294 5.36× 10− 03 2.20× 10− 16
ENSG00000015520 NPC1L1 NPC1-like intracellular cholesterol transporter 1 1.276 7.78× 10− 02 0.765 3.50× 10− 02 5.50× 10− 05 ENSG00000103460 TOX3 TOX high-mobility group box family member 3 1.282 7.78× 10− 02 1.378 8.73× 10− 02 1.70× 10− 11 ENSG00000172425 TTC36 Tetratricopeptide repeat domain 36 1.295 7.78× 10− 02 1.260 6.41× 10− 03 3.50× 10− 10
1Genes passing an FDR of 0.1 and a log
2FC threshold of 0.75 are reported here. Differential expression was tested by using a logistic regression model correcting for age and sex followed by a Wald test to assess the statistical significance of the coefficient of interest. As no sex interaction was found, association was evaluated without interaction term. Benjamini–Hochberg multiple testing correction was applied within the fitted model on the derived P values (FDR). Correlation tests between RNA-seq and Nanostring gene quantification were performed using a nonparametric Spearman correlation test. CT, constitutional thinness; FC, fold change; FDR, false discovery rate; RNA-seq, RNA sequencing.
CT individuals indicates a higher fuel supply through fatty acidβ-oxidation in mitochondrial bioenergetics, consistent with the upregulation of the fatty acid oxidation pathway from the transcriptomic analysis. Moreover, higher systemic fasting lipid oxidation rates were observed by indirect calorimetry. Dietary macronutrient levels and composition were very similar between the groups and thus most likely do not contribute to these observed oxidation rate differences. Studies in humans with extreme altered fat mass, such as obese and lipodystrophic
people, have shown mitochondrial dysfunction in white adipose tissue (28), resulting in reduced oxidative capacity, which can link to the associated metabolic complications. In addition, a recent study elegantly showed that a lower capacity to mobilize adipose tissue through lipolysis is a strong factor of weight gain (29). Differences in mitochondrial energy efficiency have also been proposed to contribute to interindividual variability in weight gain in response to overfeeding (30). On the other hand, increased mitochondrial activity has been suggested to be a mechanism by
which caloric restriction promotes health benefits (31). Induction of fatty acidβ-oxidation and mitochondrial oxidative capacity through CII, with a shift from carbohydrate to fat utilization, was suggested to derive energy during caloric restriction, thereby reducing production of reactive oxygen species (31), as well as link to a lean phenotype (32).
Over the past decade, there have been several studies exploring a potential role of a low REE and low body core temperature as “thrifty” metabolic traits in the onset of obesity (33,34), yet con-flicting results have been reported (35,36). Inversely, it could be that CT individuals have a high REE and/or a higher temperature set point, which could lead to differences in metabolic efficiency. REE and TEE were found to be lower in CT individuals than controls, confirming earlier results (5,6). Yet, after correction for fat-free mass, the REE difference was blunted, as was also found in the previous report (6). Tc is more independent of body size or composition (as it is reflecting a central nervous system set point) (36), and hence it could provide additional valuable information on metabolic differences in CT individuals. Our results at baseline suggest indeed that CT individuals have a slightly higher Tc. However, a recent study pointed out the difficulty of reliably measuring Tc in individuals (37). For the moment, we cannot firmly conclude whether CT people have undergone any metabolic adaptation or have different Tc, and more in-depth analysis of energy homeostasis could be valuable. Pathway analyses of the adipose tissue gene expression profiles demonstrated an increase not only in lipid catabolism in CT but surprisingly also in lipid biosynthesis. This suggests the presence of higher futile lipid cycling, potentially associated with the observed increased mitochondrial activity and buildup of smaller adipocytes. Efficient adipocyte turnover and function are key determinants of a healthy metabolic profile (38). Studies of caloric restriction but also mild cold exposure demonstrated increased fatty acid synthesis alternating with increased fatty acid oxidation (39,40), which could be similar to what we observe in CT. Given that CT individuals tend to snack more often and have constant hunger, we propose that they have an increased whole-body lipid metabolism more active all the time, leading to higher basal energy expenditure. In plasma, no differences in lipid metabolic markers could be detected, suggesting a tight homeostatic regulation. This observation strengthens our finding of an adipose tissue–specific phenotype, as well as augmented futile lipid cycling. Indeed, in contrast to increased lipid oxidation alone, an increase in lipid turnover results in an equilibrated lipid balance, and thus net circulating lipid biomarkers would remain equal. Of note, from the untargeted plasma proteomic profiling, we found 3 plasma proteins with consistent increased levels in CT individuals, one of which is DBH. This intraneuronal enzyme plays a key role in catecholamine synthesis, and its blood levels are used as an index of sympathetic nerve activity (41). An inverse correlation between serum DBH levels and obesity has been previously described (42), and DBH knockout mice have reduced leptin-stimulated lipolysis (43). Even though we did not find any differences in blood (or) metadrenaline levels, we speculate that increased levels of blood DBH in CT individuals could be a potential indicator for increased sympathetic neuroadipose connections linking to increased lipid metabolism in CT individuals.
Another hypothesis often put forward is that CT people might have enhanced BAT activity. An earlier study on CT people
reported indeed some higher BAT activity under thermoneutral conditions (44). Even though we did not observe an increase in uncoupled respiration or UCP1 expression in the sWAT of CT individuals, the presence of beige cells cannot be fully excluded. Indeed, these cells are quiescent and can undergo beiging (increased UCP1 expression to levels similar to that in BAT, as well as morphological transformation) following β-adrenergic stimulation (45).
Overfeeding of the individuals led to metabolic changes that were similar in the CT and control groups, as evidenced by similar body weight increase but also in biochemical measurements and transcriptomic profiles. This similar response to the overfeeding is somewhat different from what was observed before, in which a resistance to weight gain upon overfeeding was described in CT individuals (6). However, our current intervention protocol differs in several ways from the previous one: overfeeding time was twice as long in the earlier study (4 instead of 2 wk), and the latter consisted mainly of fat overfeeding, while our intervention consisted of a more nutritionally balanced overfeeding (600-kcal excess, with 31.5% fat, 20% protein, and 48.5% carbohydrates). Overall, the participants gained a small amount of weight, and some metabolic changes occurred in lowering triglyceride levels and increasing insulin levels. These rapid changes in lipid metabolism with a shift toward storage of lipids and increased insulin levels have been previously described to occur in the early phase of weight gain during overfeeding (46). Longer intervention might be necessary to better evaluate whether CT individuals respond in a metabolically different way to overfeeding.
Conclusions
We show for the first time, to our knowledge, that persistent low body weight in humans is associated with features in the white adipose tissue that are opposite to that of obese patients. In particular, we observed increased lipid oxidation, potentially higher futile cycling of fatty acids, upregulation of mitochondrial function, and many genes differentially regulated and associating with positive metabolic profiles. Our findings postulate an important role of mitochondria as local regulators of adiposity and weight. Male and female CT individuals appear to share most metabolic characteristics. Understanding the molec-ular mechanisms that allow CT individuals to maintain their extremely low body weight despite a challenging environment may allow a more targeted approach for weight management and treatment strategies.
We thank the participants in the clinical study and their commitment to help us enhance scientific knowledge. We are grateful to Julien Marquis from the genomics core for technical input; Bernhard Sonderegger, Polina Mironova, and Ondine Walter for help with data management and biobanking; Emma Wynn and Cécile Dinet for clinical project management; and Armand Valsesia for statistical input.
The authors’ contributions were as follows—BE, JH, BG, and N Germain: initiated and designed the study; BE: led the clinical study performed at CHU Saint-Etienne; YL: executed the study and performed the mitochondrial respiration assays under the guidance of CC; N Gheldof: performed mitochondrial DNA quantification, monitored and performed all data interpretation with the help of CC, and wrote the manuscript with contributions from the other authors; J Carayol: performed the statistical analysis, with help from AM and IV for the transcriptomic data analysis; ANG, J Corthésy, and LD: performed proteomic experiments; OC: analyzed
proteomic experiments; LD: supervised proteomic experiments; AC and SM: performed transcriptomic experiments under the supervision of FR and PD; CM: performed calorimetric chamber assays under the supervision of YB; KM and VA: coordinated all interactions; RP and LF: performed adipose tissue and muscle biopsies; MP and FC: performed adipose (immune) histology; and all authors read and approved the final manuscript. J Carayol, CC, KM, OC, ANG, J Corthésy, LD, AC, SM, FR, PD, JH, and N Gheldof are employed by Nestlé SA.
References
1. Apfelbaum M, Sachet P. [Constitutional thinness]. Rev Prat 1982;32(3):245–7(in French).
2. Germain N, Galusca B, Le Roux CW, Bossu C, Ghatei MA, Lang F, Bloom SR, Estour B. Constitutional thinness and lean anorexia nervosa display opposite concentrations of peptide YY, glucagon-like peptide 1, ghrelin, and leptin. Am J Clin Nutr 2007;85(4):967–71.
3. Estour B, Marouani N, Sigaud T, Lang F, Fakra E, Ling Y, Diamondé A, Minnion JS, Galusca B, Germain N. Differentiating constitutional thinness from anorexia nervosa in DSM 5 era. Psychoneuroendocrinology 2017;84:94–100.
4. Gallagher D, Heymsfield SB, Heo M, Jebb SA, Murgatroyd PR, Sakamoto Y. Healthy percentage body fat ranges: an approach for developing guidelines based on body mass index. Am J Clin Nutr 2000;72(3):694–701.
5. Bossu C, Galusca B, Normand S, Germain N, Collet P, Frere D, Lang F, Laville M, Estour B. Energy expenditure adjusted for body composition differentiates constitutional thinness from both normal subjects and anorexia nervosa. Am J Physiol Endocrinol Metab 2007;292(1): E132–7.
6. Germain N, Galusca B, Caron-Dorval D, Martin JF, Pujos-Guillot E, Boirie Y, Khalfallah Y, Ling Y, Minnion JS, Bloom SR, et al. Specific appetite, energetic and metabolomics responses to fat overfeeding in resistant-to-bodyweight-gain constitutional thinness. Nutr Diabetes 2014;4:e126.
7. Ling Y, Galusca B, Hager J, Feasson L, Valsesia A, Epelbaum J, Alexandre V, Wynn E, Dinet C, Palaghiu R, et al. Rational and design of an overfeeding protocol in constitutional thinness: understanding the physiology, metabolism and genetic background of resistance to weight gain. Ann Endocrinol (Paris) 2016;77(5):563–9.
8. Crouter SE, Churilla JR, Bassett DR Jr. Accuracy of the Actiheart for the assessment of energy expenditure in adults. Eur J Clin Nutr 2008;62(6):704–11.
9. Blond E, Maitrepierre C, Normand S, Sothier M, Roth H, Goudable J, Laville M. A new indirect calorimeter is accurate and reliable for measuring basal energy expenditure, thermic effect of food and substrate oxidation in obese and healthy subjects. e-SPEN 2011;6(1):e7–15.
10. Lazzer S, Boirie Y, Montaurier C, Vernet J, Meyer M, Vermorel M. A weight reduction program preserves fat-free mass but not metabolic rate in obese adolescents. Obes Res 2004;12(2):233–40.
11. Montaurier C, Morio B, Bannier S, Derost P, Arnaud P, Brandolini-Bunlon M, Giraudet C, Boirie Y, Durif F. Mechanisms of body weight gain in patients with Parkinson’s disease after subthalamic stimulation. Brain 2007;130(Pt 7):1808–18.
12. Liu Y, Zhu SH, Wang GH, Ye F, Li PZ. Validity and reliability of multiparameter physiological measurements recorded by the Equivital LifeMonitor during activities of various intensities. J Occup Environ Hyg 2013;10(2):78–85.
13. Dayon L, Núñez Galindo A, Cominetti O, Corthésy J, Kussmann M. A highly automated shotgun proteomic workflow: clinical scale and robustness for biomarker discovery in blood. Methods Mol Biol 2017;1619:433–49.
14. Lan J, Núñez Galindo A, Doecke J, Fowler C, Martins RN, Rainey-Smith SR, Cominetti O, Dayon L. Systematic evaluation of the use of human plasma and serum for mass-spectrometry-based shotgun proteomics. J Proteome Res 2018;17(4):1426–35.
15. Canto C, Garcia-Roves PM. High-resolution respirometry for mitochondrial characterization of ex-vivo mouse tissues. Curr Protoc Mouse Biol 2015;5(2):135–53.
16. Eigentler AE, Fontana-Ayoub M, Fasching M, Lassnig B, Stadlmann S, Rieger G, Haffner B, Lemieux H, Gnaiger E. Selected media and
chemicals for respirometry with mitochondria and permeabilized cells. Mitochondrial Physiol Netw 2012;3:1–9.
17. Fasching M, Fontana-Ayoub M, Gnaiger E. Mitochondrial respiration medium—MiR6. Mitochondrial Physiol Netw 2013;14:1–5. 18. Galarraga M, Campión J, Muñoz-Barrutia A, Boqué N, Moreno H,
Martínez JA, Milagro F, Ortiz-de-Solórzano C. Adiposoft: automated software for the analysis of white adipose tissue cellularity in histological sections. J Lipid Res 2012;53(12):2791–6.
19. Marquis J, Lefebvre G, Kourmpetis YAI, Kassam M, Ronga F, De Marchi U, Wiederkehr A, Descombes P. MitoRS, a method for high throughput, sensitive, and accurate detection of mitochondrial DNA heteroplasmy. BMC Genomics 2017;18(1):326.
20. Atger F, Gobet C, Marquis J, Martin E, Wang J, Weger B, Lefebvre G, Descombes P, Naef F, Gachon F. Circadian and feeding rhythms differentially affect rhythmic mRNA transcription and translation in mouse liver. Proc Natl Acad Sci USA 2015;112(47):E6579–88. 21. Armenise C, Lefebvre G, Carayol J, Bonnel S, Bolton J, Di Cara A,
Gheldof N, Descombes P, Langin D, Saris WH, et al. Transcriptome profiling from adipose tissue during a low-calorie diet reveals predictors of weight and glycemic outcomes in obese, nondiabetic subjects. Am J Clin Nutr 2017;106(3):736–46.
22. Law CW, Chen Y, Shi W, Smyth GK. voom: precision weights unlock linear model analysis tools for RNA-seq read counts. Genome Biol 2014;15(2):R29.
23. Kuleshov MV, Jones MR, Rouillard AD, Fernandez NF, Duan Q, Wang Z, Koplev S, Jenkins SL, Jagodnik KM, Lachmann A, et al. Enrichr: a comprehensive gene set enrichment analysis web server 2016 update. Nucleic Acids Res 2016;44(W1):W90–7.
24. Heizer WD. Normal and abnormal intestinal absorption by humans. Environ Health Perspect 1979;33:101–6.
25. Galusca B, Zouch M, Germain N, Bossu C, Frere D, Lang F, Lafage-Proust MH, Thomas T, Vico L, Estour B. Constitutional thinness: unusual human phenotype of low bone quality. J Clin Endocrinol Metab 2008;93(1):110–7.
26. Sharabiani MT, Vermeulen R, Scoccianti C, Hosnijeh FS, Minelli L, Sacerdote C, Palli D, Krogh V, Tumino R, Chiodini P, et al. Immunologic profile of excessive body weight. Biomarkers 2011;16(3):243–51.
27. Galusca B, Verney J, Meugnier E, Ling Y, Edouard P, Feasson L, Ravelojaona M, Vidal H, Estour B, Germain N. Reduced fibre size, capillary supply and mitochondrial activity in constitutional thinness’ skeletal muscle. Acta Physiol (Oxf) 2018;224(3):e13097.
28. Boudina S, Graham TE. Mitochondrial function/dysfunction in white adipose tissue. Exp Physiol 2014;99(9):1168–78.
29. Arner P, Andersson DP, Bäckdahl J, Dahlman I, Rydén M. Weight gain and impaired glucose metabolism in women are predicted by inefficient subcutaneous fat cell lipolysis. Cell Metab 2018;28(1): 45–54.e3.
30. Galgani J, Ravussin E. Energy metabolism, fuel selection and body weight regulation. Int J Obes (Lond) 2008;32(Suppl 7):S109–19. 31. Guarente L. Mitochondria—a nexus for aging, calorie restriction, and
sirtuins? Cell 2008;132(2):171–6.
32. Flachs P, Rossmeisl M, Kuda O, Kopecky J. Stimulation of mitochondrial oxidative capacity in white fat independent of UCP1: a key to lean phenotype. Biochim Biophys Acta 2013;1831(5): 986–1003.
33. Dulloo AG, Jacquet J, Montani JP, Schutz Y. Adaptive thermogenesis in human body weight regulation: more of a concept than a measurable entity? Obes Rev 2012;13(Suppl 2):105–21.
34. Landsberg L. Core temperature: a forgotten variable in energy expenditure and obesity? Obes Rev 2012;13(Suppl 2):97–104. 35. Heikens MJ, Gorbach AM, Eden HS, Savastano DM, Chen KY,
Skarulis MC, Yanovski JA. Core body temperature in obesity. Am J Clin Nutr 2011;93(5):963–7.
36. Hoffmann ME, Rodriguez SM, Zeiss DM, Wachsberg KN, Kushner RF, Landsberg L, Linsenmeier RA. 24-h core temperature in obese and lean men and women. Obesity (Silver Spring) 2012;20(8):1585–90. 37. Monnard CR, Fares EJ, Calonne J, Miles-Chan JL, Montani JP,
Durrer D, Schutz Y, Dulloo AG. Issues in continuous 24-h core body temperature monitoring in humans using an ingestible capsule telemetric sensor. Front Endocrinol (Lausanne) 2017;8:130.
38. Arner P, Bernard S, Salehpour M, Possnert G, Liebl J, Steier P, Buchholz BA, Eriksson M, Arner E, Hauner H, et al. Dynamics of human adipose lipid turnover in health and metabolic disease. Nature 2011;478(7367):110–3.
39. Bruss MD, Khambatta CF, Ruby MA, Aggarwal I, Hellerstein MK. Calorie restriction increases fatty acid synthesis and whole body fat oxidation rates. Am J Physiol Endocrinol Metab 2010;298(1):E108–16. 40. Vallerand AL, Zamecnik J, Jones PJ, Jacobs I. Cold stress increases lipolysis, FFA Ra and TG/FFA cycling in humans. Aviat Space Environ Med 1999;70(1):42–50.
41. Rush RA, Geffen LB. Dopamineβ-hydroxylase in health and disease. CRC Crit Rev Clin Lab Sci 1980;12(3):241–77.
42. Ryoichi I, Furuno T, Ohnishi T, Okada A. Obesity and serum dopamine-β-hydroxylase activity. Jpn J Health Hum Ecol 1985;51(5): 202–6.
43. Zeng W, Pirzgalska RM, Pereira MM, Kubasova N, Barateiro A, Seixas E, Lu YH, Kozlova A, Voss H, Martins GG, et al.
Sympathetic neuro-adipose connections mediate leptin-driven lipolysis. Cell 2015;163(1):84–94.
44. Pasanisi F, Pace L, Fonti R, Marra M, Sgambati D, De Caprio C, De Filippo E, Vaccaro A, Salvatore M, Contaldo F. Evidence of brown fat activity in constitutional leanness. J Clin Endocrinol Metab 2013;98(3):1214–8.
45. Rosen ED, Spiegelman BM. What we talk about when we talk about fat. Cell 2014;156(1–2):20–44.
46. Alligier M, Meugnier E, Debard C, Lambert-Porcheron S, Chanseaume E, Sothier M, Loizon E, Hssain AA, Brozek J, Scoazec JY, et al. Subcutaneous adipose tissue remodeling during the initial phase of weight gain induced by overfeeding in humans. J Clin Endocrinol Metab 2012;97(2):E183–92.