HAL Id: hal-02390146
https://hal.archives-ouvertes.fr/hal-02390146
Submitted on 8 Dec 2020
HAL is a multi-disciplinary open access
archive for the deposit and dissemination of
sci-entific research documents, whether they are
pub-lished or not. The documents may come from
teaching and research institutions in France or
abroad, or from public or private research centers.
L’archive ouverte pluridisciplinaire HAL, est
destinée au dépôt et à la diffusion de documents
scientifiques de niveau recherche, publiés ou non,
émanant des établissements d’enseignement et de
recherche français ou étrangers, des laboratoires
publics ou privés.
(Chrons 34 and 20)
V. Yatheesh, J. Dyment, G. Bhattacharya, J. Royer, K. Kamesh Raju, T.
Ramprasad, A. Chaubey, P. Patriat, K. Srinivas, Y. Choi
To cite this version:
V. Yatheesh, J. Dyment, G. Bhattacharya, J. Royer, K. Kamesh Raju, et al.. Detailed Structure
and Plate Reconstructions of the Central Indian Ocean Between 83.0 and 42.5 Ma (Chrons 34 and
20). Journal of Geophysical Research : Solid Earth, American Geophysical Union, 2019, 124 (5),
pp.4305-4322. �10.1029/2018JB016812�. �hal-02390146�
(Chrons 34 and 20)
V. Yatheesh1 , J. Dyment2, G. C. Bhattacharya1, J. Y. Royer3, K. A. Kamesh Raju1, T. Ramprasad1, A. K. Chaubey1, P. Patriat2, K. Srinivas1, and Y. Choi2
1CSIR‐National Institute of Oceanography, Goa, India,2Institut de Physique du Globe de Paris, Université Sorbonne Paris
Cité, CNRS UMR 7154, Paris, France,3CNRS and Université de Brest, Institut Universitaire Européen de la Mer,
Plouzané, France
Abstract
The Central Indian Ocean, namely the Central Indian, Crozet, and Madagascar basins, formed by rifting and subsequent drifting of India (now Capricorn), Antarctica, and Africa (now Somalia). We gathered a comprehensive set of sea surface magnetic anomaly profiles over these basins and revisited location and identification of magnetic isochrons between C34ny (83.0 Ma) and C20ny (42.536 Ma) using the objective analytic signal technique. We present high‐resolution magnetic isochrons for 29 periods based on ~1,400 magnetic anomaly picks. From the conjugate sets of picks, we derive two‐plate finite rotation parameters for both the Capricorn‐Antarctica and Capricorn‐Somalia motions. These finite rotations are compared to three‐plate reconstructions of the plate boundaries between the Capricorn, Antarctica, and Somalia plates, constrained by the closure of the Indian Ocean Triple junction. In general, the three‐plate reconstructions slightly overrotate the reconstructed isochrons with respect to the Capricorn‐Antarctica and Capricorn‐Somalia two‐plate reconstructions. Conversely, the two‐plate reconstructions for Somalia‐Antarctica slightly underrotate the isochrons compared to the Capricorn‐Antarctica‐Somalia three‐plate reconstructions. We suspect that the discrepancies between the two‐plate and three‐plate methods result from the recent seafloor deformation in the Capricorn‐India diffuse plate boundary and/or from the contrasted nature and geometry of magnetic isochrons at different spreading rates (i.e., magnetic structure of the three spreading centers). Three‐plate reconstructions better constrain the closure of the triple junction but spread any misfit among all three plate boundaries. When enough quality data are available, two‐plate reconstructions may lead to more realistic plate motion estimates from which additional geological problems can be identified and solved.1. Introduction
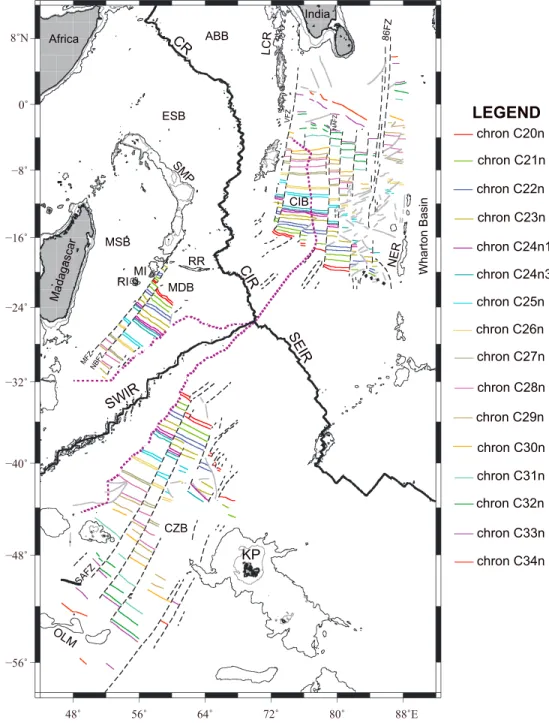
The Central Indian Ocean (Figure 1), which mainly consists of the Central Indian, Crozet, and Madagascar basins, was formed as a result of rifting and subsequent drifting of India, Antarctica, and Africa. The relative motions among these Gondwanaland fragments since the Late Cretaceous created the Crozet Basin and its conjugate, the eastern part of the Central Indian Basin, across the Southeast Indian Ridge (SEIR), and the Madagascar Basin and its conjugate, the western part of the Central Indian Basin, across the Central Indian Ridge (CIR). The CIR, SEIR, and Southwest Indian Ridge (SWIR) meet at the Indian Ocean Triple Junction of the African, Antarctic, and Indian plates whose trace on the Indian plate defines the boundary between the eastern and western parts of the Central Indian Basin. The Central Indian Ocean recorded sev-eral major tectonic events: (i) parts of the basins were affected by the passage of two major hot spots, the Réunion and Kerguelen hot spots, which formed the Chagos‐Laccadive Ridge and Mascarene Plateau on the western side, and the Ninetyeast Ridge, Broken Ridge, and the Kerguelen Plateau on the eastern side; (ii) spreading rates and directions have been affected by the India‐Eurasia collision which resulted in a major reorganization of the Indian Ocean spreading centers between 52 and 35 Ma; and (iii) a large part of the Central Indian Basin has been affected by intense lithospheric deformation and the formation of diffuse plate boundaries separating the Indian, Australian, and Capricorn plates for the last ~20 Ma.
Many studies identified magnetic anomalies and gradually improved the plate tectonic evolution of this region, unraveling its tectonic complexity (e.g., Dyment, 1993; Kamesh Raju & Ramprasad, 1989;
©2019. American Geophysical Union. All Rights Reserved.
Key Points:
• We mapped high‐resolution magnetic isochrons in the Central Indian Ocean between 83.0 and 42.5 Ma
• We derived two‐plate solutions to the relative motion of
Capricorn‐Antarctica and Capricorn‐Somalia plate pairs at higher resolution
• Two‐plate reconstructions may lead to more realistic plate motion estimates when enough quality data are available Supporting Information: • Supporting Information S1 • Data Set S1 Correspondence to: V. Yatheesh, [email protected]; [email protected] Citation:
Yatheesh, V., Dyment, J., Bhattacharya, G. C., Royer, J. Y., Kamesh Raju, K. A., Ramprasad, T., et al. (2019). Detailed structure and plate reconstructions of the Central Indian Ocean between 83.0 and 42.5 Ma (Chrons 34 and 20). Journal of Geophysical Research: Solid Earth, 124, 4305–4322. https://doi.org/ 10.1029/2018JB016812
Received 3 OCT 2018 Accepted 11 APR 2019
Accepted article online 16 APR 2019 Published online 15 MAY 2019
McKenzie & Sclater, 1971; Norton & Sclater, 1979; Patriat & Segoufin, 1988; Royer & Sandwell, 1989; Schlich, 1982). However, these models suffer limitations, as detailed in section 2, which triggered the present study conducted under the auspices of an Indo‐French collaborative project. This paper presents our updated set of magnetic picks and lineation pattern, associated tectonic fabric, and improved rotation parameters for motions between India (Capricorn) and Africa (Somalia), on the one side, and India (Capricorn) and Antarctica, on the other side, between Chrons C34 and C20 (83.0–42.5 Ma following the geomagnetic polarity time scale of Cande & Kent, 1995, consistently used throughout this study; Table 2). We limit our study to two‐plate reconstructions, which are achievable at a high temporal resolution considering the intermediate to fast‐spreading rate of the CIR (between India and Africa) and the SEIR (between India and Antarctica) during the considered period. The third plate boundary, the SWIR (between Africa and Antarctica), spread at much slower spreading rates (e.g., Patriat, 1987) and only some isochrons can be iden-tified with confidence, preventing high‐resolution three‐plate reconstructions. Cande et al. (2010) present several sets of three‐plate reconstructions under various hypotheses for selected isochrons between Chrons C29no (64.745 Ma) and C20ny (42.536 Ma) using a limited set of reliable magnetic anomaly picks and fracture zone crossings. Our different approach of using a larger set of consistent magnetic anomaly picks, all possible isochrons, and two‐plate reconstructions, should be regarded as complementary to this previous study as it allows to compare two‐plate and three‐plate reconstructions and discuss their relative merits.
Figure 1. Plate tectonic setting of the Central Indian Ocean and the adjoining regions with the satellite‐derived seafloor topography (Smith & Sandwell, 1997) and selected GEBCO bathymetric contours (200, 2,000, and 3,000 m). Red lines represent spreading centers, blue lines subduction zones, pink lines transform boundaries, and shaded brown areas diffuse plate boundaries after Royer and Gordon (1997) and Stamps et al. (2008). Black dashed lines mark selected fracture zones, and dotted violet lines the traces of the Indian Ocean Triple Junction (or Rodrigues Triple Junction, RTJ). Abbreviations used are as in Table 1.
2. Background
2.1. Some Limitations of Previous Plate Reconstruction Models
Earlier studies provided a usefulfirst‐order description of the plate tectonic history of the Central Indian Ocean, but are affected by some limitations. Indeed, these models being generally based on different sets of magnetic isochrons, combining them often leads to inconsistencies. In addition, the selected picks were not always consistent, even for a same magnetic anomaly (picked at the beginning, end, or middle), due to the uncertainties in the “manual” interpretation of magnetic anomalies by different researchers. Another important source of uncertainty is the variable quality of the navigation for data spanning more than four decades. Older data from the early 1960s are astronomically navigated, and then came the advent of early satellite navigation in the 1970s and 1980s. Finally, the Global Navigation Satellite Systems provide accurate navigation since the 1990s. Whereas nothing can be done to improve the accuracy of older, poorly navigated data, larger uncertainties have to be considered for plate reconstructions. We revisited the seafloor spreading history of this part of the Indian Ocean to overcome these limitations.
2.2. Complex Subsequent Plate Tectonic History
As previously stated, the opening of the Central Indian Ocean between Chrons C34 (83.0 Ma) and C20 (42.536 Ma) involved three plates, Africa, Antarctica (actually East Antarctica), and India, separated by three spreading centers, the CIR, SEIR, and SWIR, but this plate geometry evolved through geologic times. With the initiation of the East African Rift System, the former African plate divided into several plates including Nubia, Somalia, and Lwandle (Figure 1), with relative motions between these three plates since at least 11 Ma (DeMets et al., 2015; Horner‐Johnson et al., 2007; Royer et al., 2006; Stamps et al., 2008). East Antarctica merged with West Antarctica into a single Antarctic plate at ~11 Ma (Granot & Dyment, 2018). With the spreading cessation in the Wharton Basin between 40 and 35 Ma (e.g. Jacob et al., 2014; Krishna et al., 2012; Liu et al., 1983), India merged with Australia into a single Indo‐Australian plate, then at ~20 Ma this plate divided into three plates, India, Australia, and Capricorn (DeMets et al., 2005; Royer & Gordon, 1997). These changes have no direct consequences for plate reconstructions on the former
Table 1
List of Abbreviations Used to Name Physiographic and Tectonic Features
Abbreviations Tectonic elements and domains Abbreviations Tectonic elements and domains
Plates Aseismic ridges/Submarine plateaus
ANT Antarctic Plate BR Broken Ridge
ARB Arabian Plate CP Crozet Plateau
AUS Australian Plate KP Kerguelen Plateau
CAP Capricorn Plate LCR Laccadive‐Chagos Ridge
IND Indian Plate MDR Madagascar Ridge
LWA Lwandle Plate MI Mauritius Island
NUB Nubian Plate NER Ninety East Ridge
SOM Somalian Plate OLM Ob‐Lena‐Marion Dufresne Seamounts
Ocean basins RI Réunion Island
ABB Arabian Basin RR Rodriguez Ridge
AAB Australian‐Antarctic Basin SMP Seychelles‐Mascarene Plateau
CZB Crozet Basin Fracture zones
ECIB Eastern Central Indian Basin
ESB Eastern Somali Basin ABFZ Andrew Bain Fracture Zone
MDB Madagascar Basin AFZ Atlantis Fracture Zone
MSB Mascarene Basin DFZ Discovery Fracture Zone
WCIB Western Central Indian Basin IFZ Indomed Fracture Zone
WHB Wharton Basin MFZ Mauritius Fracture Zone
Mid‐ocean ridges/Rifts NAFZ Northern Astrolabe Fracture Zone
CR Carlsberg Ridge NBFZ Northern Boussole Fracture Zone
CIR Central Indian Ridge OFZ Owen Fracture Zone
SR Sheba Ridge SAFZ Southern Astrolabe Fracture Zone
SEIR Southeast Indian Ridge SBFZ Southern Boussole Fracture Zone
SWIR Southwest Indian Ridge VFZ Vishnu Fracture Zone
African plate—the Madagascar Basin fully belongs to Somalia—and on the Antarctic plate—to which the Crozet Basin belongs. On the Indian plate, the southern and youngest part of the Central Indian Basin forms the Capricorn plate, whereas its oldest part encompasses the diffuse plate boundary between the Capricorn and Indian plates. The rotation para-meters based on the magnetic and fracture zone crossings in the western Central Indian and Madagascar basins therefore actually describe the relative motions between the Capricorn (CAP) and Somalian (SOM) plates, and those based on the crossings from the eastern Central Indian and Crozet basins describe the relative motions between the Capricorn (CAP) and Antarctic (ANT) plates. Reconstructions relative to India or Nubia (i.e., the main part of Africa) can be obtained by applying the appropriate corrections for the relative motions which took place after Chron C20ny (42.536 Ma) between Capricorn‐India and Somalia‐Nubia, respectively. It is worth noting that the older (pre‐Chron C29) plate reconstructions for CAP and ANT are most likely affected by the deforma-tion in the India‐Capricorn diffuse plate boundary.
3. Data
Our data set is an updated compilation of available digital sea surface magnetic data (of ~150 cruises) in the Central Indian, Crozet, and Madagascar basins. This compilation (Figure 2) includes data collected by Indian and French research vessels, and international data in the pub-lic domain (GEODAS‐NG database from National Centers for Environmental Information: http://maps.ngdc.noaa.gov/viewers/geo-physics/). We built a consistent database corrected for spikes and other inconsistencies. We restricted our study to Chrons C34–C20 (83.0–42.5 Ma), because our compilation offers new data relative to previous works for this period. The total magnetic intensity data have been reduced to residual magnetic anomalies by subtracting the International Geomagnetic Reference Field for appropriate epochs (Thébault et al., 2015). As it is usually the case with sea surface magnetic surveys in deep ocean basins, no correction was applied for the diurnal variation of the Earth's magneticfield, as this correc-tion would not exceed several tens of nanotesla. Addicorrec-tionally, we have digitized from literature (Siddiquie et al., 1983) or obtained from the authors (Desa et al., 2009) a few sea surface magnetic profiles in order to improve our interpretation in data gaps. To our knowledge, this compilation constitutes the most complete database of sea surface magnetic data for the Central Indian Ocean. Existing bathymetric contours from the General Bathymetric Chart of the Oceans (GEBCO) digital data (IOC‐IHO‐BODC, 2003) and free‐air gravity anomalies derived from satellite altimetry data (Sandwell et al., 2014) have been used to delineate fracture zones and other tectonic features.
4. Methods
The methodology used to identify and precisely locate the seafloor spreading chrons in the present study includes the following: (i) anomaly identification using the conventional method of interprofile correlation and comparison with synthetic anomaly models; (ii) precise location of the boundaries of magnetized blocks using the analytic signal method; and (iii) validation of the identified isochrons by iteratively using paleogeographic reconstructions.
4.1. Identification of Magnetic Anomalies
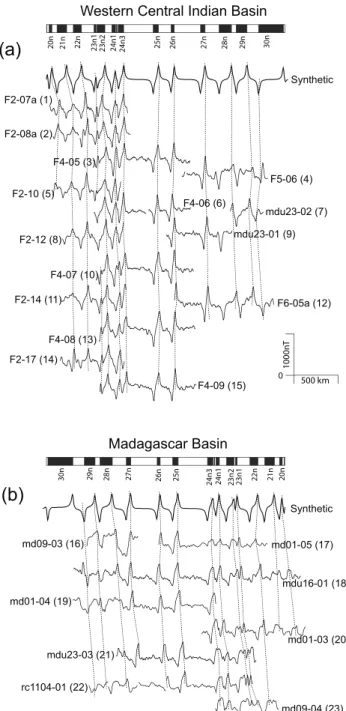
Wherever the magnetic anomalies are clearly identifiable and depict good correlation over longer stretch, a preliminary identification of those anomalies was carried out manually on maps, using the conventional criteria of interprofile correlation, from characteristic shapes of the anomalies and comparison with the synthetic anomalies (Figures 3 and 4). While most of the magnetic anomalies show good correlation,
Table 2
Ages of the Magnetic Anomalies (Chrons) After the Magnetic Reversal Time Scale of Cande and Kent (1995)
Chron Age (Ma)
C20ny 42.536 C20no 43.789 C21ny 46.264 C21no 47.906 C22ny 49.037 C22no 49.714 C23n1y 50.778 C23n2o 51.743 C24n1y 52.364 C24n1o 52.663 C24n3y 52.903 C24n3o 53.347 C25ny 55.904 C25no 56.391 C26ny 57.554 C26no 57.911 C27ny 60.920 C27no 61.276 C28ny 62.499 C28no 63.634 C29ny 63.976 C29no 64.745 C30ny 65.578 C31no 67.610 C32n1y 71.071 C32n2o 73.004 C33ny 73.619 C33no 79.075 C34ny 83.000
Note. The young (y) and old (o) edges of magnetic anomalies refer to the end and beginning, respectively, of normal (n) polarity intervals.
some sequences are difficult to correlate and identify, especially in the eastern part of the Central Indian and Crozet basins. For such complicated sequences, we looked for correlatable detailed features, the “tiny wiggles” (Cande & Kent, 1992), within the main anomalies. This approach, successfully implemented to identify magnetic anomalies in the adjacent Arabian and Eastern Somali basins (Chaubey et al., 2002; Royer et al., 2002), was also effective to unambiguously identify major anomalies in the complex parts of the present study area. The characteristic shape of anomalies C24n and C32n, with their tiny wiggles, was particularly helpful to identify these anomalies.
4.2. Picking of Magnetic Isochrons Using the Analytic Signal Approach
Because neither the ambient geomagneticfield nor the magnetization are vertical vectors, magnetic anoma-lies are usually not observed atop their causative bodies. The anomaly observed on a profile cutting across an elongated body is skewed (or phase‐shifted) by an angle that depends on the inclinations of the magnetiza-tion and present‐day geomagnetic field and the azimuth of the profile (e.g., Cande, 1976; Dyment et al., 1994; Schouten & McCamy, 1972). The Central Indian, Crozet, and Madagascar basins were formed at low south-ern latitudes and have drifted substantially northward from their original location. The inclination of
Figure 2. Ship tracks of sea surface magnetic profiles from French, Indian, and international (GEODAS‐NG database of NCEI) data compiled for the present project. Dashed boxes define the study areas in (a) the Central Indian Basin (CIB), (b) the Crozet Basin (CZB), and (c) the Madagascar Basin (MDB). Black lines with identifiers (letters for ECIB and CZB, and numbers for WCIB and MDB) mark the location of profiles shown in Figures 3 and 4.
magnetization (i.e., the paleolatitude) and the azimuth of the spreading center cannot be determined with enough certainty for an effective reduction to the pole, which would be in some case hampered by a residual“anomalous skewness” (Cande, 1976; Dyment et al., 1994). Picking magnetic polarity boundaries on marine magnetic profiles in such conditions is often ambiguous and may vary among different interpreters. To overcome this difficulty, we used the modulus of the analytic signal (MAS), a zero‐phase
Figure 3. Selected magnetic anomaly profiles of the (a) Eastern Central Indian Basin and (b) Crozet Basin, projected per-pendicular to the strike of the lineations. Profile locations are shown in Figure 2. For Eastern Central Indian Basin, synthetic magnetic profile is computed for a ridge striking at N60°W at latitude of 30°S and now observed at 8°S, 80°E. For Crozet Basin, synthetic magnetic profile is computed for a ridge striking N60°W at latitude of 30°S and now observed at 45°S, 55°E. Normally magnetized blocks are indicated by black bars. Magnetized layer (with a magnetization of 20 A/m) is considered to be 0.5‐km thick and upper surface is approximated to 7.0 km below the sea level. It is assumed that half‐spreading rates are as shown in Figure 8. Magnetic anomaly identifications follow the geomagnetic polarity reversal time scale of Cande and Kent (1995). Dotted lines indicate correlations of magnetic anomalies. Light gray‐shaded areas indicate complex regions with asymmetric spreading, and dark gray‐shaded areas the presence of volcanics.
signal easily computed from the Hilbert transform of the original signal (Nabighian, 1972, 1974), which corresponds to the envelope of all possible phase shifts of an observed anomaly. This envelope is independent of the skewness of the observed profile and has maxima located above the mag-netization contrasts, providing an easy way to unambiguously locate the polarity boundaries. We have applied this method (see Roest et al., 1992 and Chaubey et al., 2002, for a more complete description), and in an initial phase, automatically determined the maxima of MAS over the entire area. However, all detected maxima are not necessarily associated with a real polarity boundary but may instead be related either to other magnetization contrasts, such as geomagneticfield intensity variations and peculiar tectonic or volcanic features, or to biases in applying the ana-lytic signal analysis on profiles crossing noncylindrical magnetic sources (i.e., close to spreading segment ends), or also to the noise inherent to data measurements. So, in a second phase each detected maximum of MAS was compared with the original magnetic anomaly, and a large number of secondary maxima mostly associated with geomagneticfield intensity variations were discarded. Among the primary maxima associated with geomagnetic polarity reversals, a small number was inconsistent with the anomaly signal and deleted, or possibly repicked manually. An exam-ple is given in Figure S1 in the supporting information S1. Applying these methods to our extended database provided a large set of magnetic anom-aly crossings and lineation pattern in the major part of the study area. 4.3. Validation of Interpreted Isochrons
We initially chose to identify and pick all magnetic chrons between C34 and C20 and attempted to use them for plate reconstructions, but found that it was impossible to propose consistent plate reconstructions at inter-vals shorter than 1 Myr. We only used our consistent set of magnetic picks and did not include any additional picks from other works in our study area. For the reconstructions, we assigned the uncertainties on the magnetic crossings as a function of the year of the data acquisition. In few areas such as the eastern Central Indian Basin (east of ~82°E), the identification of some isolated anomalies or short sequences of anomalies was difficult due to lack of characteristic tiny wiggles or the presence of additional unexpected normal and/or reverse events. Furthermore, several magnetic anomalies observed in the eastern Central Indian Basin seem lacking conjugates in the Crozet Basin. These observations reflect complex asymmetric seafloor spreading possibly involving ridge jumps (Krishna et al., 1995, 2012; Royer et al., 1991), ridge propagation (e.g., Chaubey et al., 1998, 2002; Dyment, 1998), and/or the formation of microplates (Matthews et al., 2016; Royer & Sandwell, 1989) in relation with the nearby Ninetyeast Ridge and Kerguelen hotspot (see later discus-sion). In order to identify these anomalies and refine our interpretation in these complex areas, we used the plate reconstruction software (Chang, 1988; Kirkwood et al., 1999; Royer & Chang, 1991) in an iterative way to reconstruct the magnetic isochrons at various times. We first computed thefinite rotation parameters (pole and angle) from our consis-tent set of confidently identified magnetic picks for Chrons C30ny to C20ny (65.578–42.536 Ma) for Capricorn‐Somalia and C34ny to C20ny (83.0–42.536 Ma) for Capricorn‐Antarctica, respectively. We subsequently applied the computed rotations to the corresponding magnetic picks, including picks lacking conjugate and therefore not used in the determination of thefinite rotations. Applying this trial and error process helped us to decide whether the interpretation of these picks was justified and consistent with the regional tectonic framework.
Figure 4. Selected magnetic anomaly profiles of the (a) Western Central Indian Basin and (b) Madagascar Basin, projected perpendicular to the strike of the lineations. Profile locations are shown in Figure 2. For Western Central Indian Basin, synthetic magnetic profile is computed for a ridge striking N60°W at latitude of 30°S and now observed at 8°S, 80°E. For Madagascar Basin, synthetic magnetic profile is computed for a ridge strik-ing N60°W at latitude of 30°S and now observed at 25°S, 55°E. Other details are as in Figure 3.
5. Results
5.1. Magnetic Lineation Pattern in the Central Indian Ocean
A total number of 1,399 magnetic anomaly picks (846, 287, and 266 picks from Central Indian, Crozet, and Madagascar basins, respectively) has been obtained from the analysis of our database. They are available in the supporting information S2 of this paper. Figure 5 displays these magnetic anomaly picks, superimposed to the satellite‐derived free‐air gravity anomaly (Sat‐FAA; Sandwell et al., 2014). Figure S2 in the supporting information S1 provides details of the magnetic anomaly picks for individual basins. Figure S3 in the supporting information S1 presents the magnetic anomaly picks together with the magnetic profile tracks
Figure 5. Updated magnetic anomaly picks superposed on satellite‐derived free‐air gravity anomaly map in the Central Indian Ocean. Age of the lineations are indicated by colors as in the legend. Abbreviations are as in Figure 1.
and wiggles. Figures 5 and S2 clearly show that magnetic isochrons are divided into several compartments, offset by fracture zones. These fracture zones are clearly observed in the Sat‐FAA data and have been deli-neated by Wessel et al. (2015), which we used subsequently. The fracture zones provide essential constraints for the plate reconstructions. The magnetic isochron maps (Figures 6 and S4) show that C30ny (65.861 Ma) is the oldest magnetic lineation in the Madagascar Basin, whereas C34ny (83.0 Ma) is the oldest magnetic linea-tion in the Crozet and Central Indian basins. The whole sequence of anomalies C34ny to C20ny (83.0–42.536 Ma) is observed in the conjugate Crozet and eastern Central Indian basins, and the sequence of anomalies C30ny to C20ny (65.578–42.536 Ma) in the conjugate Madagascar and western Central Indian basins.
Figure 6. Updated magnetic isochrons and associated tectonic fabric between Chrons C34ny and C20ny (83.0–42.536 Ma) in the Central Indian Ocean. Age of the lineations is indicated by colors as in the legend. Dashed lines represent the fracture zones and thick gray lines the tectonic trends interpreted from satellite‐derived free‐air gravity anomaly map. Purple dotted line marks the trace of the triple junction. Abbreviations are as in Figure 1.
In the Central Indian Basin, magnetic lineations (Figures 6 and S4a) from C33ny to C20ny (73.619–42.536 Ma) consistently trends in E‐W direction; however, the trend of magnetic lineations C33no (79.075 Ma) and C34ny (83.0 Ma) is in the NW‐SE direction. Such a striking difference in isochron geometry within a set of well identifiable anomaly sequence warrants explanation. The most immediate explanation is that a major reorganization of the spreading center occurred at or slightly after (younger) anomaly C34ny (83.0 Ma). However, in detail, we noticed that the observed C34ny and C33no lineations are made of short seg-ments with various orientations, some perpendicular to the spreading direction before the reorganization and others to that after the reorganization, with the overall trend of the lineations preserving the old NW‐SE orientation. This spreading ridge configuration was a transient configuration that might have rapidly evolved, either by progressive readjustment, ridge propagation, ridge jumps, or a combination of the above, to a stable configuration. This latter configuration consists of long E‐W trending segments separated by long‐ lived N‐S fracture zones, consistent with the prevailing N‐S spreading direction. Interestingly, C34ny coincides with other tectonic events such as the opening of the Mascarene Basin west of the study area (e.g., Bernard & Munschy, 2000; Bhattacharya & Yatheesh, 2015; Eagles & Wibisono, 2013; Schlich, 1982; Shuhail et al., 2018) and to a major change of spreading direction east of the study area between the older West Australian Basins (Perth, Gascoyne, and Cuvier basins) and the younger Wharton Basin (e.g., Jacob et al., 2014). It may therefore correspond to major plate boundary reorganization in the Indian Ocean. Compared to the Central Indian Basin side, magnetic crossings in the conjugate Crozet Basin are sparse, partly because of sparse marine magnetic profiles in that area and partly because the magnetic data were obliterated by the onset of the Ob, Lena, and Marion Dufresne seamount chain. Crustal transfer processes such as ridge propagation (e.g., Chaubey et al., 2002; Dyment, 1998; Royer et al., 2002) may also explain the absence of some of the C34ny and C33ny lineations in the western Crozet Basin. This inference of crustal transfer is supported from the fact that in the northwestern part of the Central Indian Basin, the oceanic crust generated between anomalies C31no (68.737 Ma) and C33no (79.075 Ma) is much wider than that observed in the nearby corridors (Figure S4a).
Another observation is that some of the very prominent fracture zones in the Central Indian Basin are not observed for oceanic crust younger than anomalies C27ny (60.920 Ma) to C23n2o (51.743 Ma) in the Sat‐ FAA map (Figure 5). A similar situation is found in the conjugate Crozet Basin in the corresponding corri-dors for the same time interval. This suggests that these fracture zone offsets have been overcome by ridge propagation of the adjacent ridge segments, an inference consistent with the lack of magnetic anomaly iden-tifications in this area. More generally, quite a systematic episode of ridge propagation seems to have taken place in the eastern Central Indian Basin, between the Ninetyeast Ridge and 86°E Fracture Zone and 0° and 12°S latitude. This episode seems to have ended with the formation of the Mammerickx microplate at anom-aly C21ny (Matthews et al., 2016) after which a normal spreading situation resumed. Evidence for this epi-sode comes from the free‐air gravity anomaly map, which depicts several NE‐SW trending features consistent with the outer pseudofault of such propagators and also with duplicated magnetic anomalies on many profiles of this area which are typical of complex tectonic areas involving several propagators (e.g., Chaubey et al., 2002; Dyment, 1998). This observation may also provide an alternative explanation for the anomalous additional crust observed in the region west of Ninetyeast Ridge between 0° and 18°S (Figures 5 and 6), compared to similar age crust of C30ny to C24n3o (65.578 to 53.347 Ma) in the western Central Indian Basin and the remaining part of the eastern Central Indian Basin. Previous explanations involved a complex mechanism of successive ridge jumps (Krishna et al., 1995; Royer & Sandwell, 1989), evi-dences of which is not apparent from our updated compilation of magnetic data of this study. Instead, it appears that the ridge segments adjacent to the Ninetyeast Ridge propagated away from the Ninetyeast Ridge toward the eastern Central Indian Basin. This process transferred a significant part of the crust created in the Antarctic plate to the Capricorn plate causing tremendous spreading asymmetry, while at the same time maintaining a progressively lengthened segment of the ridge in the close vicinity of Ninetyeast Ridge. Such a situation is commonly encountered during the interaction of a spreading ridge with a hot spot such as, the Central Indian and Carlsberg ridges with the Réunion hotspot (Chaubey et al., 2002; Dyment, 1998; Royer et al., 2002). From this observation, we deduce that between Chrons C30ny and C24n3o (65.578–53.347 Ma), the easternmost segments of the Central Indian Basin were located in close vicinity of a hot spot, most probably the Kerguelen hot spot, which has a causal relationship with the Ninetyeast Ridge. Further, we could confirm the existence of another prominent westward ridge propagator between
anomalies C23n2o (51.743) and C21no (47.906 Ma) in the Western Central Indian Basin, associated with the Indian Ocean Triple Junction at that time (Dyment, 1993).
5.2. Finite Rotations, Spreading Rates and Spreading Directions, Flow Lines
Thefinite rotation parameters derived from the magnetic anomaly picks and several reliable fracture zone locations in the three basins are given in Table 3. The poles offinite rotation and their confidence ellipse are shown in Figure 7. We estimated half‐spreading rates (HSR) and spreading direc-tions for CAP‐SOM and CAP‐ANT plate boundaries based on these finite rotation parameters (Figure 8). Our estimates suggest that at the Capricorn‐Antarctica plate boundary (i.e., at the SEIR) the HSR was rela-tively low (~4.5 cm/year) during the interval C34ny–C32n1y (83.0 Ma– 71.071 Ma), and it started increasing rapidly later to reach the high level of ~ 9.0 cm/year at the time of C29no (64.745 Ma). Corresponding esti-mates of HSR for the CAP‐SOM plate boundary (i.e., CIR) at the same per-iod are either not available prior to C30ny (65.578 Ma) or not reliable later. CAP‐SOM oceanic crust was only created at Mascarene Basin spreading center before C30ny, and the few available magnetic picks used for recon-structions between C30ny and C29no result in large uncertainties on the HSR. An increase in spreading rate between C33ny (73.619 Ma) and C29no (64.745 Ma) has been reported there (Bissessur, 2011; Shuhail et al., 2018). The rapid increase of spreading rate at the Mascarene Basin spreading center and SEIR most likely marks the complete separation of the Indian (now Capricorn) plate from the African (now Somalian) and Antarctic plates and thereby the establishment of seafloor spreading along all the divergent boundaries. The ascent of the Réunion hotspot in the mantle beneath the southern part of the Indian plate may have had an additional effect in further pushing India northward (Cande & Stegman, 2011) or reducing its basal drag (Eagles & Wibisono, 2013).
Surprisingly, the HSR did not remain stable after this initial increase. Instead, on the SEIR it sharply decreased from ~9.3 cm/year (C28ny at ~62.499 Ma) to ~5.8 cm/year (C26r at ~59 Ma) and then increased gradu-ally to ~7.9 cm/year (C24n1o at ~ 52.663 Ma). Similarly, on the CIR it sharply decreased from ~7.9 cm/year (C28ny) to ~5.0 cm/year (C26r at ~59 Ma) and then increased gradually to ~7.9 cm/year (C24n1o; Figure 8). This observation is probably related to events that affected the Indian‐African (now Somalian) plate boundary westward and the Indian plate northward. The Réunion hot spot reached the Indian litho-sphere at ~65 Ma, creating the Deccan trapflood basalt and leading to a major reorganization of the NW Indian Ocean spreading centers. Spreading in the Gop‐Laxmi and Mascarene basins slowed down drastically and a new spreading center, the Carlsberg Ridge, initiated between the Laxmi Ridge and Seychelles microcontinents (Bhattacharya et al., 1994; Bhattacharya & Yatheesh, 2015; Dyment, 1991; Royer et al., 2002; Schlich, 1982; Yatheesh et al., 2009). The sharp drop of HSR at Chron C28ny (62.499 Ma) accompanies the onset of this new spreading center, 600 km north of the soon extinct Mascarene Basin spreading center, and its connection by a system of long (>1,000 km) transform faults to the existing CIR and SEIR southeastward. Conversely, the subsequent gradual HSR increase corresponds to the progressive establishment of the active Carlsberg Ridge between C27no and C25ny (and the concomitant cessation of spreading in the Mascarene Basin at ~60 Ma and Laxmi‐Gop basins at 56.4 Ma).
Later on, we observe that the HSR started decreasing rapidly. On the SEIR, it declined from ~8.8 cm/year at the time of C23n2o (~51.743 Ma) to ~3.2 cm/year by the time of C21ny (~ 47.906 Ma), and at CIR from about
Table 3
Finite Rotation Parameters Describing Relative Motion of (a) Indian (Now Capricorn) Plate With Respect to Antarctic Plate Between Chrons C20ny and C34ny and (b) Indian (Now Capricorn) Plate With Respect to African (Now Somalian) Plate Between Chrons C20ny and C30ny
Anomaly Age (Ma) Latitude (°N) Longitude (°E) Angle (deg) (a) Capricorn‐Antarctica (fixed Antarctica)
20ny 42.536 20.245 25.802 −23.774 20no 43.789 17.774 27.431 −25.013 21ny 46.264 15.270 27.937 −26.924 21no 47.906 14.357 27.658 −28.298 22ny 49.037 15.348 24.595 −28.614 23n1y 50.778 14.961 22.997 −30.673 23n2o 51.743 15.039 21.635 −31.578 24n1o 52.663 14.727 20.216 −32.802 24n3o 53.347 14.422 19.782 −33.719 25ny 55.904 14.193 17.190 −36.732 26ny 57.554 12.793 17.254 −39.020 27ny 60.920 9.911 18.291 −43.525 28ny 62.499 7.449 20.102 −46.525 28no 63.634 10.786 14.754 −46.076 29no 64.745 10.873 13.633 −47.619 30ny 65.578 9.994 14.252 −49.116 31no 67.610 9.281 13.988 −52.793 32n1y 71.071 11.359 10.470 −53.537 33ny 73.619 10.675 10.810 −55.792 33no 79.075 9.806 11.178 −60.485 34ny 83.000 8.960 12.081 −64.331
(b) Capricorn‐Somalia (fixed Somalia)
20ny 42.536 18.209 47.476 −22.552 20no 43.789 14.950 48.534 −24.708 21ny 46.264 13.921 48.451 −26.400 21no 47.906 13.984 47.415 −27.331 22ny 49.037 18.386 43.025 −25.324 23n1y 50.778 13.042 44.280 −30.335 23n2o 51.743 14.315 42.188 −30.242 24n1o 52.663 15.663 39.594 −30.420 24n3o 53.347 15.793 38.510 −31.071 25ny 55.904 17.175 34.255 −32.958 26ny 57.554 16.451 33.187 −35.108 27ny 60.920 14.430 32.871 −39.711 28ny 62.499 13.822 32.810 −42.095 28no 63.634 17.570 26.924 −39.800 30ny 65.578 16.950 25.152 −42.355
Note. Angles are positive counterclockwise. Ages of the magnetic anoma-lies after Cande and Kent (1995).
7.9 cm/year at the time of C23n2o (51.743 Ma) to ~1.8 cm/year by the time of C21ny (46.264 Ma). This rapid decrease of spreading rate on both CIR and SEIR from the time of C23n2o onward marks the onset of India‐ Eurasia soft collision (Cande et al., 2010; Copley et al., 2010; Patriat & Achache, 1984), or collision of India (including its continental margin in the north) with an intraoceanic island arc system (Aitchison et al., 2000; Gibbons et al., 2015).
The rotation parameters derived from the plate reconstructions also allow the construction offlow lines, that is, lines tracing the motion of a point at the ridge axis through time. Suchflow lines can be compared to the fracture zones to assess the quality of the plate reconstructions. Figures S5a–S5c display such flow lines for the Central Indian, Crozet, and Madagascar basins, respectively.
6. Discussion: Two‐Plate Versus Three‐Plate
Reconstructions
The Central Indian Ocean is the result of seafloor spreading among the Indian (now Capricorn), African (now Somalian), and Antarctic plates: the CIR separates the Capricorn and Somalian plates, the SEIR the Capricorn and Antarctic plates, and the SWIR the Somalian and Antarctic plates. In such a three‐plate configuration, finite rotations can be derived either independently for each pair of plates using a two‐plate approach or simultaneously for all three plate boundaries using a three‐ plate approach. This study used a two‐plate approach to estimate the Capricorn‐Somalia and Capricorn‐Antarctica relative motions. Cande et al. (2010) used a three‐plate approach to jointly estimate the Capricorn‐Somalia‐Antarctica relative motions. In this section, we com-pare the results of the two approaches and evaluate the advantages and drawbacks of each method.
To perform this comparison, wefirst display the two sets of finite rotation poles for Capricorn‐Antarctica and Capricorn‐Somalia obtained with the two approaches (Figure 7). We observe that the pole paths are rather simi-lar, withfluctuations happening at the same time. However, the amplitude of these fluctuations is markedly more important in the pole path resulting from two‐plate reconstructions, as a result of the tendency of the three‐plate reconstruction method to smooth and distribute uncertainties. Error ellipses from the three‐ plate reconstructions are smaller than with the two‐plate reconstruction, as expected given the additional constraints of the triple junction closure. However, this should be considered with caution as the uncertainty ascribed to the magnetic picks may not be fully consistent in Cande et al. (2010) and our study.
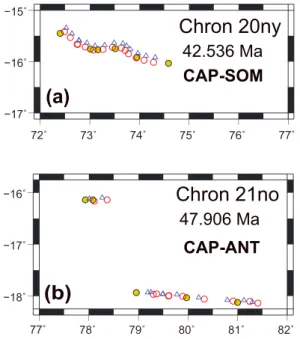
Comparison of spreading rates and directions (Figure 8) andflow lines (Figure S5 in the supporting informa-tion S1) from the two approaches shows no significant difference between Cande et al. (2010) and our results. To go a step further, we apply the two sets offinite rotations to our set of magnetic anomaly picks, since they are more complete than that of Cande et al. (2010) and are based on an objective analytical method, potentially less biased than“manual” interpretations of magnetic profiles. Figure 9a shows plate reconstructions at the Capricorn‐Somalia plate boundary (CIR) for the time of Anomaly C20ny (42.536 Ma). Supporting information Figure S6 shows similar plate reconstructions for all the other anomalies. In most cases, the three‐plate reconstructions overrotate the magnetic crossings. The overrotation is not con-stant (as it would be if the crossings were consistently misidentified or not matching the selected time) but is larger in the western part of the plate boundary, away from the triple junction. Similarly, Figure 9b shows plate reconstructions at the Capricorn‐Antarctica plate boundary (SEIR) for the time of Anomaly C21no (47.906 Ma). Supporting information Figure S7 shows similar plate reconstructions for the other anomalies. Agreement between the two sets of reconstructions is much better. However, in some cases the three‐plate reconstructions still overrotate the picks, although less dramatically than for the CIR. This
Figure 7. Location and ellipse error offinite rotation poles for Capricorn‐ Antarctica (a) and Capricorn‐Somalia (b) for the two‐plate (red, Table 3) and three‐plate (blue, Cande et al., 2010) reconstructions. On (b), the open black triangle marks thefinite rotation pole for Chron C22no (16.252°N, 43.554°E,−27.040°), which is not listed in Table 3 but reinforces our confi-dence in the observedfluctuation between Chrons C23 and C21.
overrotation is also larger in the eastern part of the plate boundary, away from the triple junction. We suspect that the systematic overrotation of the three‐plate approach partly comes from a different interpretation of the reversal boundary due to manual picking. The larger overrotation away from the triple junction (observed for both CIR and SEIR) is likely due to the strong additional constraint of closure at the triple junction in the three‐plate approach.
In a second attempt, we tried reconstructing magnetic picks across the SWIR. To this end, we selected a set of conjugate magnetic picks from bothflanks of the SWIR (Bernard et al., 2005; Patriat, 1987). Several difficul-ties hamper this comparison. First, whereas the sole Antarctic plate bounds the southernflank of the SWIR, its northernflank is bounded by the Nubian, Somalian, and an inferred Lwandle plates. Postulated diffuse plate boundaries separate these three plates (Figure 1; Horner‐Johnson et al., 2007; Stamps et al., 2008), the easternmost one (Lwandle‐Somalia) being most likely located west of the Gallieni Fracture Zone (DeMets et al., 2015). Therefore, only the SWIR magnetic picks located east of 52°E longitude are considered representative of the Somalia‐Antarctica plate motion. Another difficulty is to delineate high‐resolution magnetic picks corresponding to each magnetic polarity reversal boundary as we did for the fast‐spreading SEIR and CIR. The SWIR between Chrons C33ny and C20ny (73.619–42.536 Ma) was spreading at ultraslow to slow rates (HSR varying between 0.8 and 1.5 cm/year; Cande & Patriat, 2015), making short or closed chrons hardly distinguishable on the available profiles (the “sequence effect” of Dyment et al. (1994)). Since the analytic signal method is not operative in such case, we have to rely on manual picking. Due to these difficulties, we kept only a few well‐identified set of magnetic picks (Chrons C20no, C21no, C22no, C23n2o, and C24n3o) from the eastern SWIR. Figure 10 shows plate reconstructions at the
Figure 8. Variation of half‐spreading rates and directions for the two‐plate (red) and three‐plate (blue, Cande et al., 2010) reconstructions (a) between C34ny (83.0 Ma) and C20ny (42.5 Ma) at location (17.69°S, 78.12°E) of the conjugate Eastern Central Indian and Crozet basins, as predicted by thefinite rotation parameters estimated for India (Capricorn)‐Antarctica plate boundaries, and (b) between C30ny (66 Ma) and C20ny (42.5 Ma) at location (15.78°S, 73.02°E) of the conjugate Western Central Indian and Madagascar basins, as predicted by thefinite rotation parameters estimated for India (Capricorn)‐Africa (Somali) plate boundaries.
Somalia‐Antarctica plate boundary (SWIR) for the time of Anomaly C20no (43.789 Ma). Supporting information Figure S8 shows similar plate reconstructions for the other anomalies. The three‐plate reconstructions generally result in a much better match of the reconstructed picks. This was expected since data from the SWIR are constraining the three‐plate solution of Cande et al. (2010) and are not considered in our two‐plate approach. In the latter, conjugate picks on either flank of the SWIR are underrotated by various amounts for different anomalies, closer to the triple junction (Figures 10 and S8). The slight mismatch observed between the two‐plate and three‐plate solutions may reflect either a real problem in the Central Indian Ocean plate closure and/or some inade-quacy in the adopted methodology. In the next section we investigate the two possibilities.
The plate circuit closure at the Indian Ocean Triple Junction between Chrons C34ny and C20ny (83.0–42.536 Ma) may be hampered by the onset of subsequent deformation in plates that are assumed to be rigid in the classical plate tectonic framework. As noted above, the diffuse plate boundary separating the Somalian and Lwandle plates imposes the exclu-sion of all magnetic anomaly picks identified west of 52°E in the plate reconstruction. It is much more difficult to alleviate the effects of the Capricorn‐India and Capricorn‐Australia diffuse plate boundaries that affect a large part of the Central Indian Basin since 20 Ma. The Capricorn‐India diffuse plate boundary cuts across the Central Indian Basin between 9°S and 7°N latitude. Magnetic anomalies younger than Chron C27ny (60.920 Ma) lie south of this diffuse plate boundary and are not affected by the Capricorn‐India deformation, whereas anomalies older than Chron C27ny are affected at various degrees, with more defor-mation to be expected northward. Taking this defordefor-mation into account is difficult, as it probably does not increase uniformly across the diffuse plate boundary. Qualitatively, the western part of the Central Indian Basin is less deformed as it is close to the India‐Capricorn finite rotation poles computed by various authors (DeMets et al., 2005; Gordon et al., 1998; Royer et al., 1997). This deformation should produce less error in the Capricorn‐Somalia motion estimates than in the Capricorn‐Antarctica ones. In addition, the complexity of the magnetic anomaly pattern (propa-gation, microplate, etc.) in the easternmost part of the Central Indian Basin, near the Ninetyeast Ridge, does not help in constraining the Capricorn‐Antarctica plate reconstructions. Although not critical to fit conjugate crossings, the Capricorn‐India diffuse plate boundary remains a real difficulty that affects closure of the plate circuit at the Indian Ocean Triple Junction for both the two‐plate and three‐plate solutions. Plate reconstructions assume that the geometry of a given isochron is identically imprinted on the conjugateflanks of a spreading ridge. If this assumption is exact at thefirst order, detailed investigation of the spread-ing rates for recent successive magnetic anomalies has shown that the actual location of the anomaly is slightly shifted toward older ages (DeMets & Wilson, 2008). This“outward displacement” of the magnetic anomalies averages 2.2 km, may reach 5 km, and results from the pro-cesses of oceanic crust formation. Extrusive lava, the major source of the magnetic anomalies (e.g., Dyment & Arkani‐Hamed, 1995), is flowing away from the ridge axis, making inward‐dipping polarity reversal bound-aries. Intrusive dolerites mark the past ridge axis location and correspond to vertical polarity reversal boundaries. The deeper gabbro and peridotite slowly cool away from the axis, making outward dipping polarity reversal boundaries along Curie isotherms. Neither studies (Cande et al., 2010 or
Figure 10. Comparison of two‐plate (this paper) and three‐plate (Cande et al., 2010) tectonic reconstructions of the Somalia‐Antarctica plate boundary at Chron C20no (43.789 Ma). Somalia isfixed and magnetic anomalies from this plate (northern SWIRflank) are shown by filled circles. Empty symbols are reconstructed anomaly picks from the Antarctic plate (southern SWIRflank), using our two‐plate approach (red circles) and the three‐plate approach of Cande et al. (2010; blue triangles).
Figure 9. Comparison of two‐plate (this paper) and three‐plate (Cande et al., 2010) tectonic reconstructions in two examples: (a) the Capricorn‐ Somalia plate boundary at Chron C20ny (42.536 Ma) and (b) the Capricorn‐ Antarctic plate boundary at Chron C21no (47.906 Ma). Capricorn isfixed and magnetic anomalies from this plate are shown byfilled circles. Empty symbols are reconstructed anomaly picks from the Madagascar Basin (a) and Crozet Basin (b), using our two‐plate approach (red circles) and the three‐plate approach of Cande et al. (2010; blue triangles).
ours) accounted for such outward displacement in the plate reconstructions. A way to deal with it would be to add up to 5 km to the initial uncertainty in the pick location due to navigational errors or uncertain interpretation. DeMets and Wilson (2008) did notfind a clear relationship between outward displacement and spreading rate, although their Figure 7 shows a much wider range of outward displacements at slow spreading rates (almost 6 km for HSR of 1 cm/year) than at fast‐spreading rates (2 km for HSR between 3 and 5 cm/year).
The spreading rates has been markedly slower along the SWIR than along the CIR and SEIR during most of the Indian Ocean Triple Junction history, resulting in different processes of crustal formation and structures, as suggested by their contrasted fabric shown by the satellite‐derived gravity anomaly (Sandwell et al., 2014). Significant differences in their magnetic structure and properties may also be expected (Dyment et al., 1997; Dyment & Arkani‐Hamed, 1995), possibly resulting in contrasting outward displacements. The underrota-tion observed at the SWIR for the two‐plate reconstructions, on the one hand, and the overrotation observed at the CIR and in a lesser amount at the SEIR in the three‐plate reconstructions, on the other hand, may (at least partially) be explained if the anomalies of the (then) ultraslow to slow SWIR are affected by a high out-ward displacement, similar to that of the present Reykjanes Ridge and those of the fast CIR and SEIR by a low outward displacement. The variability of the underrotation at the SWIR for the two‐plate reconstruc-tions and the overrotation at the CIR and SEIR for the three‐plate reconstructions may be an effect of the sequence effect in interpreting and locating (manually) the SWIR magnetic anomalies.
This comparison of two‐plate versus three‐plate reconstructions outlines the advantages and drawbacks of each method. Three‐plate reconstructions have the advantage of better constraining the closure at the triple junction but will spread among all three plate boundaries any error arising from problems such as deformed isochrons in the Capricorn‐India diffuse plate boundary or contrasted shift of the isochrons due to different spreading rate, thermal evolution and magnetic structure of the three spreading centers. Conversely, two‐ plate reconstruction may lead, if a sufficient amount of data is available, to more realistic plate motion estimates and well‐identified problems, of which geological causes can be directly addressed. The causes of the discrepancies between the two‐plate and three‐plate reconstructions in the Central Indian Ocean remain unsolved, they could be either due to the deformation in the Capricorn‐India diffuse plate boundary and/or different outward displacements due to contrasting magnetic structure of the CIR and SEIR versus the SWIR.
7. Conclusions
We gathered the most comprehensive data set to date over the Central Indian, Madagascar, and Crozet basins and identified seafloor spreading magnetic anomalies in the most objective way, using the analytic signal technique, over the (then) intermediate to fast‐spreading CIR and SEIR. The resulting magnetic isochrons for the conjugate Capricorn‐Somalia and Capricorn‐Antarctica plates have been reconstructed and provide a set of finite rotation parameters. Comparisons of these two‐plate reconstructions with the Somalia‐Capricorn‐Antarctica three‐plate reconstructions achieved by Cande et al. (2010) show that, in general, the three‐plate reconstructions slightly overrotate the reconstructed isochrons with respect to the Somalia‐Capricorn and Antarctica‐Capricorn two‐plate reconstructions. Conversely, the two‐plate Somalia‐Antarctica finite rotations slightly underrotate the reconstructed isochrons relative to the three‐ plate Somalia‐Capricorn‐Antarctica reconstructions. We suspect that this discrepancy results from the deformation of the isochrons in the Capricorn‐India diffuse plate boundary and contrasting outward displa-cement of the isochrons among the three spreading centers. Three‐plate reconstructions better constrain the closure at the triple junction but spread potential misfits among all three plate boundaries. If enough quality data are available, two‐plate reconstructions lead to more realistic plate motion estimates from which addi-tional geological problems can be identified.
One of these problems is the nature and geometry of the magnetic isochrons. Various studies suggest that the magnetic structure of the oceanic lithosphere varies with the spreading rate (e.g., Dyment et al., 1997; Dyment & Arkani‐Hamed, 1995) and the temperature of the underlying mantle, modulating the strength and frequency of magmatic events, and therefore the thickness of the extrusive basalt, affecting the outward displacement (DeMets & Wilson, 2008). For instance, reconstructions over Iceland and the Mid‐Atlantic Ridge (MAR) will be biased by a stronger outward displacement over Iceland and the Reykjanes Ridge.
Conversely, the presence of outcropping gabbro and serpentinite on a large part of slow and ultraslow spreading centers (Cannat et al., 2006; Escartín et al., 2008) has also consequences on the exact location of isochrons resulting from slow cooling and the presence of water. At slow‐spreading centers like the MAR, isochrons at the magmatic segment centers reflect the fast cooling of titanomagnetite (Curie temperature ~100–300 °C) in the extrusive layer, whereas those at the magma‐poor segment ends reflect the slow cooling of magnetite (Curie temperature ~580 °C) in gabbro and maybe the penetration of seawater through faults to achieve serpentinization in peridotite. Unfortunately, the data quality is not sufficient over the MAR to quantitatively test this hypothesis. If the scale of such processes was negligible with respect to navigational errors at the onset of Plate Tectonics to determinefirst‐order motions between main plates, it is no longer the case with GPS navigation and when unraveling detailed plate motions (e.g., Granot & Dyment, 2018). It therefore remains of primeval importance to continue collecting well‐navigated marine magnetic data in all parts of the world's ocean to solve these important but still pending issues.
References
Aitchison, J. C., Badengzhu, Davis, A. M., Liu, J., Luo, H., Malpas, J. G., et al. (2000). Remnants of a Cretaceous intra‐oceanic subduction system within the Yarlung–Zangbo suture (southern Tibet). Earth and Planetary Science Letters, 183(1‐2), 231–244. https://doi.org/ 10.1016/S0012‐821X(00)00287‐9
Bernard, A., & Munschy, M. (2000). Le bassin des Mascareignes et le bassin de Laxmi (ocen Indien occidental) se sont‐ils formes a I'axe d'un meme centre d'expansion ? Comptes Rendus de I'Academie des Sciences‐ Series IIA ‐ Earth and Planetary Science, 330(11), 777–783. Bernard, A., Munschy, M., Rotstein, Y., & Sauter, D. (2005). Refined spreading history at the Southwest Indian Ridge for the last 96 Ma,
with the aid of satellite gravity data. Geophysical Journal International, 162(3), 765–778. https://doi.org/10.1111/j.1365‐ 246X.2005.02672.x
Bhattacharya, G. C., Chaubey, A. K., Murty, G. P. S., Srinivas, K., Sarma, K. V. L. N. S., Subrahmanyam, V., & Krishna, K. S. (1994). Evidence for seafloor spreading in the Laxmi Basin, northeastern Arabian Sea. Earth and Planetary Science Letters, 125(1‐4), 211–220. https://doi.org/10.1016/0012‐821X(94)90216‐X
Bhattacharya, G. C., & Yatheesh, V. (2015). Plate‐tectonic evolution of the deep ocean basins adjoining the western continental margin of India—A proposed model for the early opening scenario. In S. Mukherjee (Ed.), Petroleum Geoscience: Indian Contexts, (pp. 1–61). Switzerland: Springer International Publishing.
Bissessur, D. (2011). Structure, âge et évolution du Bassin des Mascareignes, Océan Indien Occidental (Thèse de Doctorat), France: Institut de Physique du Globe de Paris.
Cande, S. C. (1976). A paleomagnetic pole from Late Cretaceous marine magnetic anomalies in the Pacific. Geophysical Journal of the Royal Astronomical Society, 44(3), 547–566. https://doi.org/10.1111/j.1365‐246X.1976.tb00292.x
Cande, S. C., & Kent, D. V. (1992). A new geomagnetic polarity timescale for the Late Cretaceous and Cenozoic. Journal of Geophysical Research, 97(B10), 13,917–13,951. https://doi.org/10.1029/92JB01202
Cande, S. C., & Kent, D. V. (1995). Revised calibration of the geomagnetic polarity time scale for the Late Cretaceous and Cenozoic. Journal of Geophysical Research, 100(B4), 6093–6095. https://doi.org/10.1029/94JB03098
Cande, S. C., & Patriat, P. (2015). The anticorrelated velocities of Africa and India in the Late Cretaceous and early Cenozoic. Geophysical Journal International, 200(1), 227–243. https://doi.org/10.1093/gji/ggu392
Cande, S. C., Patriat, P., & Dyment, J. (2010). Motion between the Indian, Antarctic and African plates in the early Cenozoic. Geophysical Journal International, 183(1), 127–149. https://doi.org/10.1111/j.1365‐246X.2010.04737.x
Cande, S. C., & Stegman, D. R. (2011). Indian and African plate motions driven by the push force of the Reunion plume head. Nature, 475(7354), 47–52. https://doi.org/10.1038/nature10174
Cannat, M., Sauter, D., Mendel, V., Ruellan, E., Okino, K., Escartin, J., et al. (2006). Modes of seafloor generation at a melt‐poor ultraslow‐ spreading ridge. Geology, 34(7), 605–608. https://doi.org/10.1130/G22486.1
Chang, T. (1988). Estimating the relative rotation of two tectonic plates from boundary crossings. Journal of the American Statistical Association, 83(404), 1178–1183. https://doi.org/10.1080/01621459.1988.10478717
Chaubey, A. K., Bhattacharya, G. C., Murty, G. P. S., Srinivas, K., Ramprasad, T., & Rao, D. G. (1998). Early Tertiary seafloor spreading magnetic anomalies and paleo‐propagators in the northern Arabian Sea. Earth and Planetary Science Letters, 154(1‐4), 41–52. https://doi. org/10.1016/S0012‐821X(97)00178‐7
Chaubey, A. K., Dyment, J., Bhattacharya, G. C., Royer, J. Y., Srinivas, K., & Yatheesh, V. (2002). Paleogene magnetic isochrons and palaeo‐propagators in the Arabian and Eastern Somali basins, NW Indian Ocean. In P. D. Clift, D. Croon, C. Gaedicke, & J. Craig (Eds.), The Tectonic and Climatic Evolution of the Arabian Sea Region, Special Publication, (Vol. 195, pp. 71–85). London: Geological Society.
Copley, A., Avouac, J.‐P., & Royer, J.‐Y. (2010). The India‐Asia collision and the Cenozoic slowdown of the Indian plate: Implications for the forces driving plate motions. Journal of Geophysical Research, 115(B3). https://doi.org/10.1029/2009JB006634
DeMets, C., Gordon, R., & Royer, J.‐Y. (2005). Motion between the Indian, Capricorn and Somalian plates since 20 Ma: Implications for the timing and magnitude of distributed lithospheric deformation in the equatorial Indian ocean. Geophysical Journal International, 161(2), 445–468. https://doi.org/10.1111/j.1365‐246X.2005.02598.x
DeMets, C., Merkouriev, S., & Sauter, D. (2015). High‐resolution estimates of Southwest Indian Ridge plate motions, 20 Ma to present. Geophysical Journal International, 203(3), 1495–1527. https://doi.org/10.1093/gji/ggv366
DeMets, C., & Wilson, D. S. (2008). Toward a minimum change model for recent plate motions: Calibrating seafloor spreading rates for outward displacement. Geophysical Journal International, 174(3), 825–841. https://doi.org/10.1111/j.1365‐246X.2008.03836.x Desa, M., Ramana, M. V., & Ramprasad, T. (2009). Evolution of the Late Cretaceous crust in the equatorial region of the Northern Indian
Ocean and its implication in understanding the plate kinematics. Geophysical Journal International, 177(3), 1265–1278. https://doi.org/ 10.1111/j.1365‐246X.2009.04096.x
Dyment, J. (1991). Structure et évolution de la lithosphère océanique dans l'océan Indien: apport des anomalies magnétiques (Thèse de Doctorat). Strasbourg: Université Louis Pasteur.
Acknowledgments
The authors are thankful to the Directors of CSIR‐National Institute of Oceanography, India, and Institut de Physique du Globe de Paris, France, for support and encouragement to carry out this work. This study was carried out with funding support from the Indo‐French Centre for the Promotion of Advanced Research (IFCPAR), New Delhi, under project grant 3307‐1. V. Y. gratefully acknowledges the support provided by IFCPAR for a Post‐ Doctoral Fellowship at Institut de Physique du Globe de Paris, France. Constructive reviews by two anon-ymous reviewers and the Editor have helped to improve the manuscript and are kindly acknowledged. Allfigures were drafted with GMT software (Wessel & Smith, 1995). Magnetic crossings are available in the support-ing information S2 of this paper. This is NIO contribution 6386 and IPGP con-tribution 4034.
Dyment, J. (1993). Evolution of the Indian‐Ocean triple junction between 65 and 49 Ma (Anomalies 28 to 21). Journal of Geophysical Research, 98(B8), 13,863–13,877. https://doi.org/10.1029/93JB00438
Dyment, J. (1998). Evolution of the Carlsberg Ridge between 60 and 45 Ma: Ridge propagation, spreading asymmetry, and the Deccan‐ Reunion hotspot. Journal of Geophysical Research, 103(B10), 24,067–24,084. https://doi.org/10.1029/98JB01759
Dyment, J., & Arkani‐Hamed, J. (1995). Spreading‐rate‐dependent magnetization of the oceanic lithosphere inferred from the anomalous skewness of marine magnetic anomalies. Geophysical Journal International, 121(3), 789–804. https://doi.org/10.1111/j.1365‐246X.1995. tb06439.x
Dyment, J., Arkani‐Hamed, J., & Ghods, A. (1997). Contribution of serpentinized ultramafics to marine magnetic anomalies at slow and intermediate spreading centres: Insights from the shape of the anomalies. Geophysical Journal International, 129(3), 691–701. https:// doi.org/10.1111/j.1365‐246X.1997.tb04504.x
Dyment, J., Cande, S. C., & Arkani‐Hamed, J. (1994). Skewness of marine magnetic anomalies created between 85 and 40 Ma in the Indian Ocean. Journal of Geophysical Research, 99(B12), 24,121–24,134. https://doi.org/10.1029/94JB02061
Eagles, G., & Wibisono, A. D. (2013). Ridge push, mantle plumes and the speed of the Indian plate. Geophysical Journal International, 194(2), 670–677. https://doi.org/10.1093/gji/ggt162
Escartín, J., Smith, D. K., Cann, J., Schouten, H., Langmuir, C. H., & Escrig, S. (2008). Central role of detachment faults in accretion of slow‐ spreading oceanic lithosphere. Nature, 455(7214), 790–794. https://doi.org/10.1038/nature07333
Gibbons, A. D., Zahirovic, S., Müller, R. D., Whittaker, J. M., & Yatheesh, V. (2015). A tectonic model reconciling evidence for the collisions between India, Eurasia and intra‐oceanic arcs of the central‐eastern Tethys. Gondwana Research, 28(2), 451–492. https://doi.org/ 10.1016/j.gr.2015.01.001
Gordon, R. G., DeMets, C., & Royer, J.‐Y. (1998). Evidence for long‐term diffuse deformation of the lithosphere of the equatorial Indian Ocean. Nature, 395(6700), 370–374. https://doi.org/10.1038/26463
Granot, R., & Dyment, J. (2018). Late Cenozoic unification of East and West Antarctica. Nature Communications, 9(1), 3189. https://doi. org/10.1038/s41467‐018‐05270‐w
Horner‐Johnson, B. C., Gordon, R. G., & Argus, D. F. (2007). Plate kinematic evidence for the existence of a distinct plate between the Nubian and Somalian plates along the Southwest Indian Ridge. Journal of Geophysical Research, B112,
112(B5). https://doi.org/10.1029/2006jb004519
IOC‐IHO‐BODC (2003), Centenary edition of the GEBCO digital atlas, published on CD‐ROM on behalf of the Intergovernmental Oceanographic Commission and the International Hydrographic Organization as part of the General Bathymetric Chart of the Oceans, British Oceanographic Data Centre, Liverpool, UK.
Jacob, J., Dyment, J., & Yatheesh, V. (2014). Revisiting the structure, age and evolution of the Wharton basin to better understand sub-duction under Indonesia. Journal of Geophysical Research: Solid Earth, 119, 169–190. https://doi.org/10.1002/2013JB010285 Kamesh Raju, K. A., & Ramprasad, T. (1989). Magnetic lineations in the Central Indian basin for the period A24‐A21: A study in relation to
the Indian Ocean triple junction trace. Earth and Planetary Science Letters, 95(3‐4), 395–402. https://doi.org/10.1016/0012‐ 821X(89)90113‐1
Kirkwood, B. H., Royer, J. Y., Chang, T., & Gordon, R. G. (1999). Statistical tools for estimating and combiningfinite rotations and their uncertainties. Geophysical Journal International, 137(2), 408–428. https://doi.org/10.1046/j.1365‐246X.1999.00787.x
Krishna, K. S., Abraham, H., Sager, W. W., Pringle, M. S., Frey, F., Gopala Rao, D., & Levchenko, O. V. (2012). Tectonics of the Ninetyeast Ridge derived from spreading records in adjacent oceanic basins and age constraints of the ridge. Journal of Geophysical Research, 117(B4). https://doi.org/10.1029/2011JB008805
Krishna, K. S., Rao, D. G., Ramana, M. V., Subrahmanyam, V., Sarma, K. V. L. N. S., Pilipenko, A. I., et al. (1995). Tectonic model for the evolution of oceanic crust in the northeastern Indian Ocean from the Late Cretaceous to the Early Tertiary. Journal of Geophysical Research, 100(B10), 20,011–20,024. https://doi.org/10.1029/94JB02464
Liu, C. S., Curray, J. R., & Mc Donald, J. M. (1983). New constraints on the tectonic evolution of the Eastern Indian Ocean. Earth and Planetary Science Letters, 65(2), 331–342. https://doi.org/10.1016/0012‐821X(83)90171‐1
Matthews, K. J., Müller, R. D., & Sandwell, D. T. (2016). Oceanic microplate formation records the onset of India–Eurasia collision. Earth and Planetary Science Letters, 433, 204–214. http://doi.org/10.1016/j.epsl.2015.10.040
McKenzie, D., & Sclater, J. G. (1971). The evolution of the Indian Ocean since the Late Cretaceous. Geophysical Journal of the Royal Astronomical Society, 24(5), 437–528. https://doi.org/10.1111/j.1365‐246X.1971.tb02190.x
Nabighian, M. N. (1972). The analytic signal of two‐dimensional magnetic bodies with polygonal cross‐section: Its properties and use for automated anomaly interpretation. Geophysics, 37(3), 507–517. https://doi.org/10.1190/1.1440276
Nabighian, M. N. (1974). Additional comments on the analytic signal of two‐dimensional magnetic bodies with polygonal cross section. Geophysics, 39(1), 85–92. https://doi.org/10.1190/1.1440416
Norton, I. O., & Sclater, J. G. (1979). A model for the evolution of the Indian Ocean and the break‐up of Gondwanaland. Journal of Geophysical Research, 84(B12), 6803–6830. https://doi.org/10.1029/JB084iB12p06803
Patriat, P. (1987), Reconstitution de l'évolution du système de dorsales de l'océan Indien par les méthodes de la cinématique des plaques, Territoire des Terres Australes et Antarctiques Francaises, France.
Patriat, P., & Achache, J. (1984). India‐Eurasia collision chronology has implications for crustal shortening and driving mechanism of plates. Nature, 311(5987), 615–621. https://doi.org/10.1038/311615a0
Patriat, P., & Segoufin, J. (1988). Reconstruction of the Central Indian Ocean. Tectonophysics, 155(1‐4), 211–234. https://doi.org/10.1016/ 0040‐1951(88)90267‐3
Roest, W. R., Arkani‐Hamed, J., & Verhoef, J. (1992). The seafloor spreading rate dependence of the anomalous skewness of marine magnetic anomalies. Geophysical Journal International, 109(3), 653–669. https://doi.org/10.1111/j.1365‐246X.1992.tb00123.x Royer, J. Y., & Chang, T. (1991). Evidence for relative motions between the Indian and Australian plates during the last 20 m.y. from plate
tectonic reconstructions: Implications for the deformation of the Indo‐Australian plate. Journal of Geophysical Research, 96(B7), 11,779–11,802. https://doi.org/10.1029/91JB00897
Royer, J. Y., Chaubey, A. K., Dyment, J., Bhattacharya, G. C., Srinivas, K., Yatheesh, V., & Ramprasad, T. (2002). Paleogene plate tectonic evolution of the Arabian and Eastern Somali basins. In P. D. Clift, D. Croon, C. Gaedicke, & J. Craig (Eds.), The Tectonic and Climatic Evolution of the Arabian Sea Region, Special Publication, (Vol. 195, pp. 7–23). London: Geological Society.
Royer, J. Y., & Gordon, R. (1997). The motion and boundary between the Capricorn and Australian plates. Science, 277(5330), 1268–1274. https://doi.org/10.1126/science.277.5330.1268
Royer, J. Y., Gordon, R. G., Demets, C., & Vogt, P. R. (1997). New limits on the motion between India and Australia since chron 5 (11 Ma) and implications for lithospheric deformation in the equatorial Indian Ocean. Geophysical Journal International, 129(1), 41–74. https:// doi.org/10.1111/j.1365‐246X.1997.tb00937.x
Royer, J. Y., Gordon, R. G., & Horner‐Johnson, B. C. (2006). Motion of Nubia relative to Antarctica since 11 Ma: Implications for Nubia‐Somalia, Pacific‐North America, and India‐Eurasia motion. Geology, 34(6), 501–504. https://doi.org/10.1130/G22463.1 Royer, J. Y., Peirce, J. W., & Weissel, J. K. (1991). Tectonic constraints on the hotspot formation of Ninetyeast Ridge. Proceeding of the Ocean
Drilling Program, Scientific Results, 121, 763–776. https://doi.org/10.2973/odp.proc.sr.121.122.1991
Royer, J. Y., & Sandwell, D. T. (1989). Evolution of the Eastern Indian Ocean since the Late Cretaceous: Constraints from Geosat altimetry. Journal of Geophysical Research, 94(B10), 13,755–13,782. https://doi.org/10.1029/JB094iB10p13755
Sandwell, D. T., Müller, R. D., Smith, W. H. F., Garcia, E., & Francis, R. (2014). New global marine gravity model from CryoSat‐2 and Jason‐ 1 reveals buried tectonic structure. Science, 346(6205), 65–67. https://doi.org/10.1126/science.1258213
Schlich, R. (1982). The Indian Ocean: Aseismic Ridges, spreading centres and basins. In A. E. M. Nairn, & F. G. Stehli (Eds.), The Ocean Basins and Margins, (pp. 51–147). New York: Plenum Press. https://doi.org/10.1007/978‐1‐4615‐8038‐6_2
Schouten, H., & McCamy, K. (1972). Filtering marine magnetic anomalies. Journal of Geophysical Research, 77(35), 7089–7099. https://doi. org/10.1029/JB077i035p07089
Shuhail, M., Yatheesh, V., Bhattacharya, G. C., Dietmar Müller, R., Kamesh Raju, K. A., & Mahender, K. (2018). Formation and evolution of the Chain‐Kairali Escarpment and the Vishnu Fracture Zone in the Western Indian Ocean. Journal of Asian Earth Sciences, 164, 307–321. https://doi.org/10.1016/j.jseaes.2018.06.022
Siddiquie, H. N., Bhattacharya, G. C., Pathack, M. C., & Qasim, S. Z. (1983). Indira mount‐ An underwater mountain in the Antarctic Ocean. Scientific report of first Indian Expedition to Antarctica, DOD Technical Publication 1, 161‐165.
Smith, W. H. F., & Sandwell, D. T. (1997). Global seafloor topography from satellite altimetry and ship depth soundings. Science, 277(5334), 1956–1962. https://doi.org/10.1126/science.277.5334.1956
Stamps, D. S., Calais, E., Saria, E., Hartnady, C., Nocquet, J. M., Ebinger, C. J., & Fernandes, R. M. (2008). A kinematic model for the East African rift. Geophysical Research Letters, 35, L05304. https://doi.org/10.1029/2007gl032781
Thébault, E., Finlay, C. C., Beggan, C. D., Alken, P., Aubert, J., Barrois, O., et al. (2015). International geomagnetic referencefield: The 12th generation. Earth, Planets and Space, 67(1), 79. https://doi.org/10.1186/s40623‐015‐0228‐9
Wessel, P., Matthews, K. G., Müller, R. D., Mazzoni, A., Whittaker, J. M., Myhill, R., & Chandler, M. T. (2015). Semi‐automatic fracture zone tracking. Geochemistry, Geophysics, Geosystems, 16, 2462–2472. https://doi.org/10.1002/2015GC005853
Wessel, P., & Smith, W. H. F. (1995). New version of the generic mapping tools released. Eos, Transactions of the American Geophysical Union, 76(33), 329. https://doi.org/10.1029/95EO00198
Yatheesh, V., Bhattacharya, G. C., & Dyment, J. (2009). Early oceanic opening off Western India‐Pakistan margin: The Gop Basin revisited. Earth and Planetary Science Letters, 284(3‐4), 399–408. http://doi.org/10.1016/j.epsl.2009.04.044