Ancient human genomes suggest three ancestral
populations for present-day Europeans
The MIT Faculty has made this article openly available.
Please share
how this access benefits you. Your story matters.
Citation
Lazaridis, Iosif, Nick Patterson, Alissa Mittnik, Gabriel Renaud,
Swapan Mallick, Karola Kirsanow, Peter H. Sudmant, et al. “Ancient
Human Genomes Suggest Three Ancestral Populations for
Present-Day Europeans.” Nature 513, no. 7518 (September 17, 2014): 409–
413.
As Published
http://dx.doi.org/10.1038/nature13673
Publisher
Nature Publishing Group
Version
Author's final manuscript
Citable link
http://hdl.handle.net/1721.1/110186
Terms of Use
Creative Commons Attribution-Noncommercial-Share Alike
Ancient human genomes suggest three ancestral populations
for present-day Europeans
A full list of authors and affiliations appears at the end of the article.
Abstract
We sequenced the genomes of a ~7,000 year old farmer from Germany and eight ~8,000 year old hunter-gatherers from Luxembourg and Sweden. We analyzed these and other ancient genomes1–4 with 2,345 contemporary humans to show that most present Europeans derive from at least three highly differentiated populations: West European Hunter-Gatherers (WHG), who contributed ancestry to all Europeans but not to Near Easterners; Ancient North Eurasians (ANE) related to Upper Paleolithic Siberians3, who contributed to both Europeans and Near Easterners; and Early European Farmers (EEF), who were mainly of Near Eastern origin but also harbored WHG-related ancestry. We model these populations’ deep relationships and show that EEF had ~44% ancestry from a “Basal Eurasian” population that split prior to the diversification of other non-African lineages.
Near Eastern migrants played a major role in the introduction of agriculture to Europe, as ancient DNA indicates that early European farmers were distinct from European hunter-gatherers4,5 and close to present-day Near Easterners4,6. However, modelling present-day Europeans as a mixture of these two ancestral populations4 does not account for the fact that they are also admixed with a population related to Native Americans7,8. To clarify the prehistory of Europe, we sequenced nine ancient genomes (Fig. 1A; Extended Data Fig. 1): “Stuttgart” (19-fold coverage), a ~7,000 year old skeleton found in Germany in the context
Users may view, print, copy, and download text and data-mine the content in such documents, for the purposes of academic research, subject always to the full Conditions of use:http://www.nature.com/authors/editorial_policies/license.html#terms
†Correspondence and requests for materials should be addressed to David Reich (reich@genetics.med.harvard.edu) or Johannes
Krause (johannes.krause@uni-tuebingen.de).
53Currently employed by AMGEN; 33 Kazantzaki Str, Ilioupolis 16342, Athens, Greece 83Present address: Banaras Hindu University, Varanasi, 221 005, India
Supplementary Information is linked to the online version of the paper at www.nature.com/nature. The fully public version of the Human Origins dataset can be found at http://genetics.med.harvard.edu/reichlab/Reich_Lab/Datasets.html. The full version of the dataset (including additional samples) is available to researchers who send a signed letter to DR indicating that they will abide by specified usage conditions (SI9).
Author contributions
BB, EEE, JBu, MS, SP, JKe, DR and JKr supervised the study. IL, NP, AM, GR, SM, KK, PHS, JGS, SC, ML, QF, HL, CdF, KP, WH, MMet, MMey and DR analyzed genetic data. FH, EF, DD, MF, J-MG, JW, AC and JKr obtained human remains. AM, CE, RBo, KB, SS, CP, NR and JKr processed ancient DNA. IL, NP, SN, NR, GA, HAB, GBa, EB, OB, RBa, GBe, HB-A, JBe, FBe, CMB, FBr, GBJB, FC, MC, DECC, DCor, LD, GvD, SD, J-MD, SAF, IGR, MG, MH, BH, TH, UH, ARJ, SK-Y, RKh, EK, RKi, TK, WK, VK, AK, LL, SL, TL, RWM, BM, EM, JMol, JMou, KN, DN, TN, LO, JP, FP, OLP, VR, FR, IR, RR, HS, ASaj, ASal, EBS, ATar, DT, ST, IU, OU, RVa, MVi, MVo, CW, LY, PZ, TZ, CC, MGT, AR-L, SAT, LS, KT, RVi, DCom, RS, MMet, SP and DR assembled the genotyping dataset. IL, NP, DR and JKr wrote the manuscript with help from all co-authors.
The aligned sequences are available through the European Nucleotide Archive under accession number PRJEB6272.
HHS Public Access
Author manuscript
Nature. Author manuscript; available in PMC 2015 March 18. Published in final edited form as:
Nature. 2014 September 18; 513(7518): 409–413. doi:10.1038/nature13673.
Author Manuscript
Author Manuscript
Author Manuscript
of artifacts from the first widespread farming culture of central Europe, the Linearbandkeramik; “Loschbour” (22-fold), an ~8,000 year old skeleton from the
Loschbour rock shelter in Luxembourg, discovered in the context of hunter-gatherer artifacts (SI1; SI2); and seven ~8,000 year old samples (0.01–2.4-fold) from a hunter-gatherer burial in Motala, Sweden (the highest coverage individual was “Motala12”).
Sequence reads from all samples revealed >20% C→T and G→A deamination-derived mismatches at the ends of the molecules that are characteristic of ancient DNA9,10 (SI3). We
estimate nuclear contamination rates to be 0.3% for Stuttgart and 0.4% for Loschbour (SI3), and mitochondrial (mtDNA) contamination rates to be 0.3% for Stuttgart, 0.4% for
Loschbour, and 0.01–5% for the Motala individuals (SI3). Stuttgart has mtDNA haplogroup T2, typical of Neolithic Europeans11, and Loschbour and all Motala individuals have the U5
or U2 haplogroups, typical of hunter-gatherers5,9 (SI4). Stuttgart is female, while Loschbour
and five Motala individuals are male (SI5) and belong to Y-chromosome haplogroup I, suggesting that this was common in pre-agricultural Europeans (SI5).
We carried out large-scale sequencing of libraries prepared with uracil DNA glycosylase (UDG), which removes deaminated cytosines, thus reducing errors arising from ancient DNA damage (SI3). The ancient individuals had indistinguishable levels of Neanderthal ancestry when compared to each other (~2%) and to present-day Eurasians (SI6). The heterozygosity of Stuttgart (0.00074) is at the high end of present-day Europeans, while that of Loschbour (0.00048) is lower than in any present humans (SI2), reflecting a strong bottleneck in Loschbour’s ancestors as the genetic data show that he was not recently inbred (Extended Data Fig. 2). High copy numbers for the salivary amylase gene (AMY1) have been associated with a high starch diet12; our data are consistent with this finding in that the ancient hunter gatherers La Braña (from Iberia)2, Motala12, and Loschbour had 5, 6 and 13 copies respectively, whereas the Stuttgart farmer had 16 (SI7). Both Loschbour and Stuttgart had dark hair (>99% probability); and Loschbour, like La Braña and Motala12, likely had blue or intermediate-colored eyes (>75%) while Stuttgart likely had brown eyes (>99%) (SI8). Neither Loschbour nor La Braña carries the skin-lightening allele in SLC24A5 that is homozygous in Stuttgart and nearly fixed in Europeans today2, but Motala12 carries at least one copy of the derived allele, showing that this allele was present in Europe prior to the advent of agriculture.
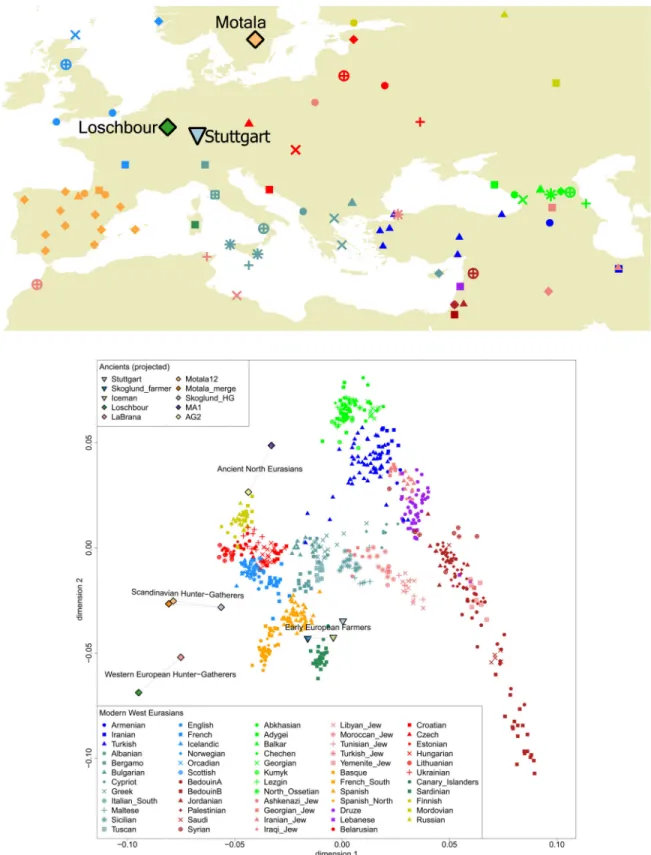
We compared the ancient genomes to 2,345 present-day humans from 203 populations genotyped at 594,924 autosomal single nucleotide polymorphisms (SNPs) with the Human Origins array8 (SI9) (Extended Data Table 1). We used ADMIXTURE13 to identify 59 “West Eurasian” populations that cluster with Europe and the Near East (SI9 and Extended Data Fig. 3). Principal component analysis (PCA)14 (SI10) (Fig. 1B) indicates a
discontinuity between the Near East and Europe, with each showing north-south clines bridged only by a few populations of mainly Mediterranean origin. We projected15 the newly sequenced and previously published1–4 ancient genomes onto the first two principal components (PCs) (Fig. 1B). Upper Paleolithic hunter-gatherers3 from Siberia like the MA1 (Mal’ta) individual project at the northern end of the PCA, suggesting an “Ancient North Eurasian” meta-population (ANE). European hunter-gatherers from Spain2, Luxembourg, and Sweden4 fall beyond present-day Europeans in the direction of European differentiation
Author Manuscript
Author Manuscript
Author Manuscript
from the Near East, and form a “West European Hunter-Gatherer” (WHG) cluster including Loschbour and La Braña2, and a “Scandinavian Hunter-Gatherer” (SHG) cluster including the Motala individuals and ~5,000 year old hunter-gatherers from the Pitted Ware Culture4. An “Early European Farmer” (EEF) cluster includes Stuttgart, the ~5,300 year old Tyrolean Iceman1 and a ~5,000 year old Swedish farmer4.
Patterns observed in PCA may be affected by sample composition (SI10) and their interpretation in terms of admixture events is not straightforward, so we rely on formal analysis of f-statistics8 to document mixture of at least three source populations in the ancestry of present Europeans. We began by computing all possible statistics of the form f3(Test; Ref1, Ref2) (SI11), which if significantly negative show unambiguously8 that Test is
admixed between populations anciently related to Ref1 and Ref2 (we choose Ref1 and Ref2
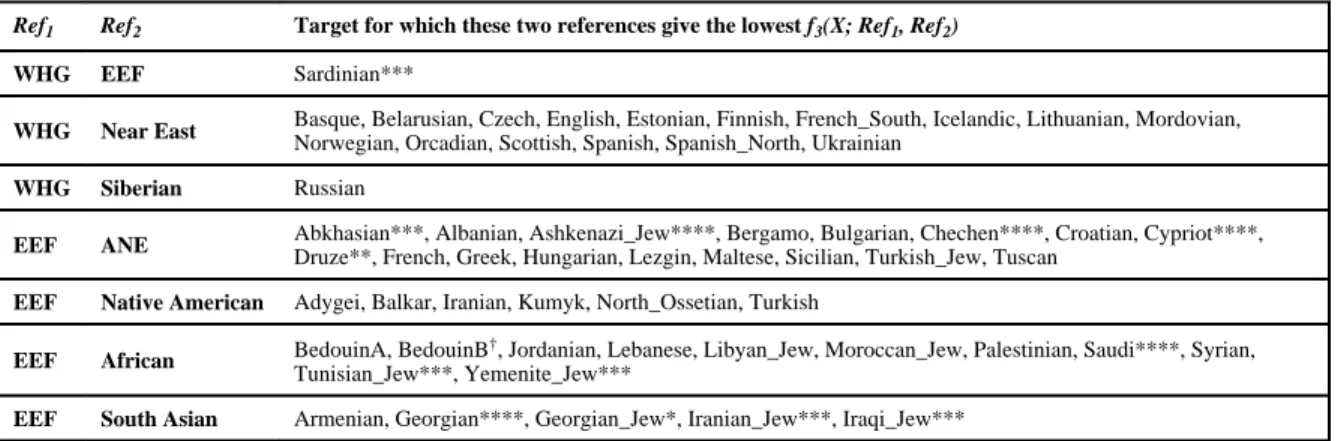
from 5 ancient and 192 present populations). The lowest f3-statistics for Europeans are
negative (93% are >4 standard errors below 0), with most showing strong support for at least one ancient individual being one of the references (SI11). Europeans almost always have their lowest f3 with either (EEF, ANE) or (WHG, Near East) (SI11, Table 1, Extended Data
Table 1), which would not be expected if there were just two ancient sources of ancestry (in which case the best references for all Europeans would be similar). The lowest f3-statistic for
Near Easterners always takes Stuttgart as one of the reference populations, consistent with a Near Eastern origin for Stuttgart’s ancestors (Table 1). We also computed the statistic f4(Test, Stuttgart; MA1, Chimp), which measures whether MA1 shares more alleles with a
Test population or with Stuttgart. This statistic is significantly positive (Extended Data Fig. 4, Extended Data Table 1) if Test is nearly any present-day West Eurasian population, showing that MA1-related ancestry has increased since the time of early farmers like Stuttgart (the analogous statistic using Native Americans instead of MA1 is correlated but smaller in magnitude (Extended Data Fig. 5), indicating that MA1 is a better surrogate than the Native Americans who were first used to document ANE ancestry in Europe7,8). The analogous statistic f4(Test, Stuttgart; Loschbour, Chimp) is nearly always positive in
Europeans and negative in Near Easterners, indicating that Europeans have more ancestry from populations related to Loschbour than do Near Easterners (Extended Data Fig. 4, Extended Data Table 1). Extended Data Table 2 documents the robustness of key f4
-statistics by recomputing them using transversion polymorphisms not affected by ancient DNA damage, and also using whole-genome sequencing data not affected by SNP ascertainment bias. Extended Data Fig. 6 shows the geographic gradients in the degree of allele sharing of present-day West Eurasians (as measured by f4-statistics) with Stuttgart
(EEF), Loschbour (WHG) and MA1 (ANE).
To determine the minimum number of source populations needed to explain the data for many European populations taken together, we studied the matrix of all possible statistics of the form f4(Testbase, Testi; Obase, Oj) (SI12). Testbase is a reference European population,
Testi is the set of all other European Test populations, Obase is a reference outgroup, and Oj
is the set of other outgroups (ancient DNA samples, Onge, Karitiana, and Mbuti). The rank of the (i, j) matrix reflects the minimum number of sources that contributed to the Test populations16,17. For a pool of individuals from 23 Test populations representing most present-day European groups, this analysis rejects descent from just two sources (P<10−12
Author Manuscript
Author Manuscript
Author Manuscript
by a Hotelling T-test17). However, three source populations are consistent with the data after excluding the Spanish who have evidence for African admixture18–20 (P=0.019, not
significant after multiple-hypothesis correction), consistent with the results from
ADMIXTURE (SI9), PCA (Fig. 1B, SI10) and f-statistics (Extended Data Table 1, Extended Data Fig. 6, SI11, SI12). We caution that the finding of three sources could be consistent with a larger number of mixture events. Moreover, the source populations may themselves have been mixed. Indeed, the positive f4(Stuttgart, Test; Loschbour, Chimp) statistics obtained when Test is Near Eastern (Extended Data Table 1) imply that the EEF had some WHG-related ancestry, which was greater than 0% and as high as 45% (SI13).
We used the ADMIXTUREGRAPH software8,15 to fit a model (a tree structure augmented by admixture events) to the data, exploring models relating the three ancient populations (Stuttgart, Loschbour, and MA1) to two eastern non-Africans (Onge and Karitiana) and sub-Saharan Africans (Mbuti). We found no models that fit the data with 0 or 1 admixture events, but did find a model that fit with 2 admixture events (SI14). The successful model (Fig. 2A) confirms the existence of MA1-related admixture in Native Americans3, but includes the novel inference that Stuttgart is partially (44 ± 10%) derived from a lineage that split prior to the separation of eastern non-Africans from the common ancestor of WHG and ANE. The existence of such “Basal Eurasian” admixture into Stuttgart provides a simple explanation for our finding that diverse eastern non-African populations share significantly more alleles with ancient European and Upper Paleolithic Siberian hunter-gatherers than with Stuttgart (that is, f4(Eastern non-African, Chimp; Hunter-gatherer, Stuttgart) is
significantly positive), but that hunter-gatherers appear to be equally related to most eastern groups (SI14). We verified the robustness of the model by reanalyzing the data using the unsupervised MixMapper7 (SI15) and TreeMix21 software (SI16), which both identified the same admixture events. The ANE/WHG split must have occurred >24,000 years ago (as it must predate the age of MA13), and the WHG/Eastern non-African split must have occurred >40,000 years ago (as it must predate the Tianyuan22 individual from China which clusters with Asians to the exclusion of Europeans). The Basal Eurasian split must be even older, and might be related to early settlement of the Levant23 or Arabia24,25 prior to the diversification of most Eurasians, or more recent gene flow from Africa26. However, the Basal Eurasian population shares much of the genetic drift common to non-African populations after their separation from Africans, and thus does not appear to represent gene flow between sub-Saharan Africans and the ancestors of non-Africans after the out-of-Africa bottleneck (SI14).
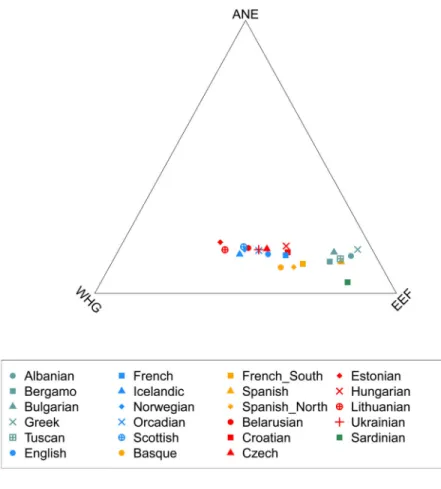
Fitting present-day Europeans into the model, we find that few populations can be fit as 2-way mixtures, but nearly all are compatible with 3-2-way mixtures of ANE/EEF/WHG (SI14). The mixture proportions from the fitted model (Fig. 2B; Extended Data Table 3) are encouragingly consistent with those obtained from a separate method that relates European populations to diverse outgroups using f4-statistics, assuming only that MA1 is an unmixed
descendent of ANE, Loschbour of WHG, and Stuttgart of EEF (SI17). We infer that EEF ancestry in Europe today ranges from ~30% in the Baltic region to ~90% in the
Mediterranean, consistent with patterns of identity-by-descent (IBD) sharing27,28 (SI18) and shared haplotype analysis (chromosome painting)29 (SI19) in which Loschbour shares more
Author Manuscript
Author Manuscript
Author Manuscript
segments with northern Europeans and Stuttgart with southern Europeans. Southern Europeans inherited their European hunter-gatherer ancestry mostly via EEF ancestors (Extended Data Fig. 6), while Northern Europeans acquired up to 50% of WHG ancestry above and beyond the WHG-related ancestry which they received through their EEF ancestors. Europeans have a larger proportion of WHG than ANE ancestry in general. By contrast, in the Near East there is no detectable WHG ancestry, but up to ~29% ANE in the Caucasus (SI14). A striking feature of these findings is that ANE ancestry is inferred to be present in nearly all Europeans today (with a maximum of ~20%), but was absent in both farmers and hunter-gatherers from central/western Europe during the Neolithic transition. At the same time, we infer that ANE ancestry was not completely absent from the larger European region at that time: we find that it was present in ~8,000 years old Scandinavian hunter-gatherers, since MA1 shares more alleles with Motala12 (SHG) than with Loschbour, and Motala12 fits as a mixture of 81% WHG and 19% ANE (SI14).
Two sets of European populations are poor fits for the model. Sicilians, Maltese, and Ashkenazi Jews have EEF estimates of >100% consistent with their having more Near Eastern ancestry than can be explained via EEF admixture (SI17). They also cannot be jointly fit with other Europeans (SI14), and they fall in the gap between European and Near Easterners (Fig. 1B). Finns, Mordovians and Russians (from the northwest of Russia) also do not fit (SI14; Extended Data Table 3) due to East Eurasian gene flow into the ancestors of these northeastern European populations. These populations (and Chuvash and Saami) are more related to East Asians than can be explained by ANE admixture (Extended Data Fig. 7), likely reflecting a separate stream of Siberian gene flow into northeastern Europe (SI14). Several questions will be important to address in future ancient DNA work. Where and when did the Near Eastern farmers admix with European hunter-gatherers to produce the EEF? How did the ancestors of present-day Europeans first acquire their ANE ancestry? Discontinuity in central Europe during the late Neolithic (~4,500 years ago) associated with the appearance of mtDNA types absent in earlier farmers and hunter-gatherers30 raises the possibility that ANE ancestry may have also appeared at this time. Finally, it is important to study ancient genome sequences from the Near East to provide insights into the history of the Basal Eurasians.
Online Methods
Archeological context, sampling and DNA extraction
The Loschbour sample stems from a male skeleton excavated in 1935 at the Loschbour rock shelter in Heffingen, Luxembourg. The skeleton was AMS radiocarbon dated to 7,205 ± 50 years before present (OxA-7738; 6,220-5,990 cal BC)31. At the Palaeogenetics Laboratory in Mainz, material for DNA extraction was sampled from tooth 16 (an upper right M1 molar) after irradiation with UV-light, surface removal, and pulverization in a mixer mill. DNA extraction took place in the palaeogenetics facilities in the Institute for Archaeological Sciences at the University of Tübingen. Three extracts were made in total, one from 80 mg of powder using an established silica based protocol32 and two additional extracts from 90 mg of powder each with a protocol optimized for the recovery of short DNA molecules33.
Author Manuscript
Author Manuscript
Author Manuscript
The Stuttgart sample was taken from a female skeleton excavated in 1982 at the site Viesenhäuser Hof, Stuttgart-Mühlhausen, Germany. It was attributed to the
Linearbandkeramik (5,500-4,800 BC) through associated pottery artifacts and the
chronology was corroborated by radiocarbon dating of the stratigraphy34. Both sampling and DNA extraction took place in the Institute for Archaeological Sciences at the University of Tübingen. Tooth 47 (a lower right M2 molar) was removed and material from the inner part was sampled with a sterile dentistry drill. An extract was made using 40 mg of bone powder33.
The Motala individuals were recovered from the site of Kanaljorden in the town of Motala, Östergötland, Sweden, excavated between 2009 and 2013. The human remains at this site are represented by several adult skulls and one infant skeleton. All individuals are part of a ritual deposition at the bottom of a small lake. Direct radiocarbon dates on the remains range between 7,013 ± 76 and 6,701 ± 64 BP (6,361-5,516 cal BC), corresponding to the late Middle Mesolithic of Scandinavia. Samples were taken from the teeth of the nine best preserved skulls, as well as a femur and tibia. Bone powder was removed from the inner parts of the teeth or bones with a sterile dentistry drill. DNA from 100 mg of bone powder was extracted35 in the ancient DNA laboratory of the Archaeological Research Laboratory, Stockholm.
Library preparation
Illumina sequencing libraries were prepared using either double- or single-stranded library preparation protocols36,37 (SI1). For high-coverage shotgun sequencing libraries, a DNA repair step with Uracil-DNA-glycosylase (UDG) and endonuclease VIII (endo VIII) treatment was included in order to remove uracil residues38. Size fractionation on a PAGE gel was also performed in order to remove longer DNA molecules that are more likely to be contaminants37. Positive and blank controls were carried along during every step of library preparation.
Shotgun sequencing and read processing
All non-UDG-treated libraries were sequenced either on an Illumina Genome Analyzer IIx with 2×76 + 7 cycles for the Loschbour and Motala libraries, or on an Illumina MiSeq with 2×150 + 8 + 8 cycles for the Stuttgart library. We followed the manufacturer’s protocol for multiplex sequencing. Raw overlapping forward and reverse reads were merged and filtered for quality39 and mapped to the human reference genome (hg19/GRCh37/1000Genomes) using the Burrows-Wheeler Aligner (BWA)40 (SI2). For deeper sequencing, UDG-treated libraries of Loschbour were sequenced on 3 Illumina HiSeq 2000 lanes with 50-bp single-end reads, 8 Illumina HiSeq 2000 lanes of 100-bp paired-single-end reads and 8 Illumina HiSeq 2500 lanes of 101-bp paired-end reads. The UDG-treated library for Stuttgart was sequenced on 8 HiSeq 2000 lanes and 101-bp paired-end reads. The UDG-treated libraries for Motala were sequenced on 8 HiSeq 2000 lanes of 100-bp paired-end reads, with 4 lanes each for two pools (one of 3 individuals and one of 4 individuals). We also sequenced an additional 8 HiSeq 2000 lanes for Motala12, the Motala sample with the highest percentage of
endogenous human DNA. For the Loschbour and Stuttgart high coverage individuals, diploid genotype calls were obtained using the Genome Analysis Toolkit (GATK)41.
Author Manuscript
Author Manuscript
Author Manuscript
Enrichment of mitochondrial DNA and sequencing
To test for DNA preservation and mtDNA contamination non-UDG-treated libraries of Loschbour and all Motala samples were enriched for human mitochondrial DNA using a bead-based capture approach with present-day human DNA as bait42. UDG-treatment was omitted in order to allow characterization of damage patterns typical for ancient DNA10. The captured libraries were sequenced on an Illumina Genome Analyzer IIx platform with 2 × 76 + 7 cycles and the resulting reads were merged and quality filtered39. The sequences were mapped to the Reconstructed Sapiens Reference Sequence, RSRS43, using a custom iterative mapping assembler, MIA44 (SI4).
Contamination estimates
We assessed if the sequences had the characteristics of authentic ancient DNA using four approaches. First we searched for evidence of contamination by determining whether the sequences mapping to the mitochondrial genome were consistent with deriving from more than one individual44,45. Second, for the high-coverage Loschbour and Stuttgart genomes, we used a maximum-likelihood-based estimate of autosomal contamination that uses variation at sites that are fixed in the 1000 Genomes data to estimate error, heterozygosity and contamination46 simultaneously. Third, we estimated contamination based on the rate of polymorphic sites on the X chromosome of the male Loschbour individual47 (SI3) Fourth, we analyzed non-UDG treated reads mapping to the RSRS to search for aDNA-typical damage patterns resulting in C→T changes at the 5′-end of the molecule10 (SI3). Phylogenetic analysis of the mitochondrial genomes
All nine complete mitochondrial genomes that fulfilled the criteria of authenticity were assigned to haplogroups using Haplofind48. A Maximum Parsimony tree including present day humans and previously published ancient mtDNA sequences was generated with MEGA49. The effect of branch shortening due to a lower number of substitutions in ancient lineages was studied by calculating the nucleotide edit distance to the root for all haplogroup R sequences (SI4).
Sex determination and Y-chromosome analysis
We assessed the sex of all sequenced individuals by using the ratio of (chrY) to (chrY +chrX) aligned reads50. We downloaded a list of Y-chromosome SNPs curated by the International Society of Genetic Genealogy (ISOGG, http://www.isogg.org) v. 9.22 (accessed Feb. 18, 2014) and determined the state of the ancient individuals at positions where a single allele was observed and MAPQ≥30. We excluded C/G or A/T SNPs due to uncertainty about the polarity of the mutation in the database. The ancient individuals were assigned haplogroups based on their derived state (SI5). We also used BEAST v1.7.5151 to assess the phylogenetic position of Loschbour using 623 males from around the world with 2,799 variant sites across 500kb of non-recombining Y-chromosome sequence52 (SI5). Estimation of Neanderthal admixture
We estimate Neanderthal admixture in ancient individuals with the f4-ratio or
S-statistic8,53,54α̂ = f
4(Altai, Denisova; Test, Yoruba)/f4(Altai, Denisova; Vindija, Yoruba)
Author Manuscript
Author Manuscript
Author Manuscript
which uses whole genome data from Altai, a high coverage (52×) Neanderthal genome sequence55, Denisova, a high coverage sequence37 from another archaic human population (31×), and Vindija, a low coverage (1.3×) Neanderthal genome from a mixture of three Neanderthal individuals from Vindija Cave in Croatia53.
Inference of demographic history and inbreeding
We used the Pairwise Sequentially Markovian Coalescent (PSMC)56 to infer the size of the ancestral population of Stuttgart and Loschbour. This analysis requires high quality diploid genotype calls and cannot be performed in the low-coverage Motala samples. To determine whether the low effective population size inferred for Loschbour is due to recent inbreeding, we plotted the time-to-most-recent common ancestor (TMRCA) along each of chr1-22 to detect runs of low TMRCA.
Analysis of segmental duplications and copy number variants
We built read-depth based copy number maps for the Loschbour, Stuttgart and Motala12 genomes in addition to the Denisova and Altai Neanderthal genome and 25 deeply
sequenced modern genomes55 (SI7). We built these maps by aligning reads, subdivided into their non-overlapping 36-bp constituents, against the reference genome using the mrsFAST aligner57, and renormalizing read-depth for local GC content. We estimated copy numbers in windows of 500 unmasked base pairs slid at 100 bp intervals across the genome. We called copy number variants using a scale space filter algorithm. We genotyped variants of interest and compared the genotypes to those from individuals sequenced as part of the 1000 Genomes Project58.
Phenotypic inference
We inferred likely phenotypes (SI8) by analyzing DNA polymorphism data in the VCF format59 using VCFtools (http://vcftoools.sourceforge.net/). For the Loschbour and Stuttgart individuals, we included data from sites not flagged as LowQuality, with genotype quality (GQ) of ≥30, and SNP quality (QUAL) of ≥50. For Motala12, which is of lower coverage, we included sites having at least 2× coverage and that passed visual inspection of the local alignment using samtools tview (http://samtools.sourceforge.net)60
Human Origins dataset curation
The Human Origins array consists of 14 panels of SNPs for which the ascertainment is well known8,61. All population genetics analysis were carried out on a set of 594,924 autosomal SNPs, after restricting to sites that had >90% completeness across 7 different batches of sequencing, and that had >97.5% concordance with at least one of two subsets of samples for which whole genome sequencing data was also available. The total dataset consists of 2,722 individuals, which we filtered to 2,345 individuals (203 populations) after removing outlier individuals or relatives based on visual inspection of PCA plots14,62 or model-based clustering analysis13. Whole genome amplified (WGA) individuals were not used in analysis, except for a Saami individual who we included because of the special interest of this population for Northeastern European population history (Extended Data Fig. 7).
Author Manuscript
Author Manuscript
Author Manuscript
ADMIXTURE analysis
We merged all Human Origins genotype data with whole genome sequencing data from Loschbour, Stuttgart, MA1, Motala12, Motala_merge, and LaBrana. We then thinned the resulting dataset to remove SNPs in linkage-disequilibrium with PLINK 1.0763, using a window size of 200 SNPs advanced by 25 SNPs and an r2 threshold of 0.4. We ran ADMIXTURE 1.2313,64 for 100 replicates with different starting random seeds, default 5-fold cross-validation, and varying the number of ancestral populations K between 2 and 20. We assessed clustering quality using CLUMPP65. We used the ADMIXTURE results to identify a set of 59 “West Eurasian” (European/Near Eastern) populations based on values of a “West Eurasian” ancestral population at K=3 (SI9). We also identified 15 populations for use as “non-West Eurasian outgroups” based on their having at least 10 individuals and no evidence of European or Near Eastern admixture at K=11, the lowest K for which Near Eastern/European-maximized ancestral populations appeared consistently across all 100 replicates.
Principal Components Analysis
We used smartpca14 (version: 10210) from EIGENSOFT62,66 5.0.1 to carry out Principal Components Analysis (PCA) (SI10). We performed PCA on a subset on individuals and then projected others using the lsqproject: YES option that gives an unbiased inference of the position of samples even in the presence of missing data (especially important for ancient DNA).
f3-statistics
We use the f3-statistic8 , where ti, r1,i and
r2,i are the allele frequencies for the ith SNP in populations Test, Ref1, Ref2, respectively, to
determine if there is evidence that the Test population is derived from admixture of populations related to Ref1 and Ref2 (SI11). A significantly negative statistic provides
unambiguous evidence of mixture in the Test population8. We allow Ref1 and Ref2 to be any
Human Origins population with 4 or more individuals, or Loschbour, Stuttgart, MA1, Motala12, LaBrana. We assess significance of the f3-statistics using a block jackknife67 and
a block size of 5cM. We report significance as the number of standard errors by which the statistic differs from zero (Z-score). We also perform an analysis in which we constrain the reference populations to be (i) EEF (Stuttgart) and WHG (Loschbour or LaBrana), (ii) EEF and a Near Eastern population, (iii) EEF and ANE (MA1), or (iv) any two present-day populations, and compute a Zdiff score between the lowest f3-statistic observed in the
dataset, and the f3-statistic observed for the specified pair. f4-statistics
We analyze f4-statistics8 of the form to assess if
populations A, B are consistent with forming a clade in an unrooted tree with respect to C, D. If they form a clade, the allele frequency differences between the two pairs should be uncorrelated and the statistic has an expected value of 0. We set the outgroup D to be a sub-Saharan African population or Chimpanzee. We systematically tried all possible
Author Manuscript
Author Manuscript
Author Manuscript
combinations of the ancient samples or 15 “non-West Eurasian outgroups” identified by ADMIXTURE analysis as A, B, C to determine their genetic affinities (SI14). Setting A as a present-day test population and B as either Stuttgart or BedouinB, we documented
relatedness to C=(Loschbour or MA1) or C=(MA1 and Karitiana) or C=(MA1 or Han) (Extended Data Figs. 4, 5, 7). Setting C as a test population and (A, B) a pair from
(Loschbour, Stuttgart, MA1) we documented differential relatedness to ancient populations (Extended Data Fig. 6). We computed D-statistics53 using transversion polymorphisms in whole genome sequence data55 to confirm robustness to ascertainment and ancient DNA
damage (Extended Data Table 2).
Minimum number of source populations for Europeans
We used qpWave16,17 to study the minimum number of source populations for a designated
set of Europeans (SI12). We use f4-statistics of the form X(l, r) = f4(l0, l; r0, r) where l0,r0
are arbitrarily chosen “base” populations, and l, r are other populations from two sets L and R respectively. If X(l, r) has rank r and there were n waves of immigration into R with no back-migration from R to L, then r+1 ≤ n. We set L to include Stuttgart, Loschbour, MA1, Onge, Karitiana, Mbuti and R to include 23 modern European populations who fit the model of SI14 and had admixture proportions within the interval [0,1] for the method with minimal modeling assumptions (SI17).
Admixture proportions for Stuttgart in the absence of a Near Eastern ancient genome We used Loschbour and BedouinB as surrogates for “Unknown hunter-gatherer” and Near Eastern (NE) farmer populations that contributed to Stuttgart (SI13). Ancient Near Eastern ancestry in Stuttgart is estimated by the f4-ratio8,15 f4(Outgroup, X; Loschbour,
Stuttgart)/f4(Outgroup, X; Loschbour, NE). A complication is that BedouinB is a mixture of
NE and African ancestry. We therefore subtracted17 the effects of African ancestry using estimates of the BedouinB African admixture proportion from ADMIXTURE (SI9) or ALDER68.
Admixture graph modeling
We used ADMIXTUREGRAPH8 (version 3110) to model population relationships between Loschbour, Stuttgart, Onge, and Karitiana using Mbuti as an African outgroup. We assessed model fit using a block jackknife of differences between estimated and fitted f-statistics for the set of included populations (we expressed the fit as a Z score). We determined that a model failed if |Z|>3 for at least one f-statistic. A basic tree model failed and we manually amended the model to test all possible models with a single admixture event, which also failed. Further manual amendment to include 2 admixture events resulted in 8 successful models, only one of which could be amended to also fit MA1 as an additional constraint. We successfully fit both the Iceman and LaBrana into this model as simple clades and Motala12 as a 2-way mixture. We also fit present-day West Eurasians as clades, 2-way mixtures, or 3-way mixtures in this basic model, achieving a successful fit for a larger number of European populations (n=26) as 3-way mixtures. We estimated the individual admixture proportions from the fitted model parameters. To test if fitted parameters for different populations are consistent with each other, we jointly fit all pairs of populations A and B by modifying
Author Manuscript
Author Manuscript
Author Manuscript
ADMIXTUREGRAPH to add a large constant (10,000) to the variance term f3(A0, A, B). By
doing this, we can safely ignore recent gene flow within Europe that affects statistics that include both A and B.
Ancestry estimates from f4-ratios
We estimate EEF ancestry using the f4-ratio8,15 f4(Mbuti, Onge; Loschbour, European)/
f4(Mbuti, Onge; Loschbour, Stuttgart), which produces consistent results with
ADMIXTUREGRAPH (SI14). We use f4(Stuttgart, Loschbour; Onge MA1)/f4(Mbuti, MA1;
Onge, Loschbour) to estimate Basal Eurasian admixture into Stuttgart. We use f4(Stuttgart,
Loschbour; Onge Karitiana)/f4(Stuttgart, Loschbour; Onge MA1) to estimate ANE mixture
in Karitiana (Fig. 2B). We use f4(Test, Stuttgart; Karitiana, Onge)/f4(MA1, Stuttgart;
Karitiana, Onge) to lower bound ANE mixture into North Caucasian populations.
MixMapper analysis
We carried out MixMapper 2.07 analysis, a semi-supervised admixture graph fitting technique. First, we infer a scaffold tree of populations without strong evidence of mixture relative to each other (Mbuti, Onge, Loschbour and MA1). We do not include European populations in the scaffold as all had significantly negative f3-statistics indicating admixture.
We then ran MixMapper to infer the relatedness of the other ancient and present-day samples, fitting them onto the scaffold as 2- or 3-way mixtures. The uncertainty in all parameter estimates is measured by block bootstrap resampling of the SNP set (100 replicates with 50 blocks).
TreeMix analysis
We applied TreeMix21 to Loschbour, Stuttgart, Motala12, and MA13, LaBrana2 and the Iceman1, along with the present-day samples of Karitiana, Onge and Mbuti. We restricted the analysis to 265,521 Human Origins array sites after excluding any SNPs where there were no-calls in any of the studied individuals. The tree was rooted with Mbuti and standard errors were estimated using blocks of 500 SNPs. We repeated the analysis on whole-genome sequence data, rooting with Chimp and replacing Onge with Dai since we did not have Onge whole genome sequence data55. We varied the number of migration events (m) between 0 and 5.
Inferring admixture proportions with minimal modeling assumptions
We devised a method to infer ancestry proportions from three ancestral populations (EEF, WHG, and ANE) without strong phylogenetic assumptions (SI17). We rely on 15 “non-West Eurasian” outgroups and study f4(European, Stuttgart; O1, O2) which equals αβ
f4(Loschbour, Stuttgart; O1, O2) + α(1−β) f4(MA1, Stuttgart; O1, O2) if European has 1−a
ancestry from EEF and β, 1−β ancestry from WHG and ANE respectively. This defines a
system of equations with unknowns αβ, α(1−β), which we solve with least squares implemented in the function lsfit in R to obtain estimates of α and β. We repeated this computation 22 times dropping one chromosome at a time20 to obtain block jackknife67 estimates of the ancestry proportions and standard errors, with block size equal to the
Author Manuscript
Author Manuscript
Author Manuscript
number of SNPs per chromosome. We assessed consistency of the inferred admixture proportions with those derived from the ADMIXTUREGRAPH model based on the number of standard errors between the two (Extended Data Table 1).
Haplotype-based analyses
We used RefinedIBD from BEAGLE 427 with the settings ibdtrim=20 and ibdwindow=25 to study IBD sharing between Loschbour and Stuttgart and populations from the POPRES dataset69. We kept all IBD tracts spanning at least 0.5 centimorgans (cM) and with a LOD
score >3 (SI18). We also used ChromoPainter29 to study haplotype sharing between
Loschbour and Stuttgart and present-day West Eurasian populations (SI19). We identified 495,357 SNPs that were complete in all individuals and phased the data using Beagle 427
with parameters phase-its=50 and impute-its=10. We did not keep sites with missing data to avoid imputing modern alleles into the ancient individuals. We used both unlinked (-k 1000) and linked modes (estimating -n and -M by sampling 10% of individuals). We combined ChromoPainter output for chromosomes 1-22 using ChromoCombine29. We carried out a PCA of the co-ancestry matrix using fineSTRUCTURE29.
Extended Data
Extended Data Figure 1.
Photographs of analyzed ancient samples.
(A) Loschbour skull; (B) Stuttgart skull, missing the lower right M2 we sampled; (C) excavation at Kanaljorden in Motala, Sweden; (D) Motala 1 in situ.
Author Manuscript
Author Manuscript
Author Manuscript
Extended Data Figure 2.
Pairwise Sequential Markovian Coalescent (PSMC) analysis.
(A) Inference of population size as a function of time, showing a very small recent
population size over the most recent period in the ancestry of Loschbour (at least the last 5– 10 thousand years). (B) Inferred time since the most recent common ancestor from the PSMC for chromosomes 20, 21, 22 (top to bottom); Stuttgart is plotted on top and Loschbour at bottom.
Author Manuscript
Author Manuscript
Author Manuscript
Extended Data Figure 3.
ADMIXTURE analysis (K=2 to K=20).
Ancient samples (Loschbour, Stuttgart, Motala_merge, Motala12, MA1, and LaBrana) are at left.
Author Manuscript
Author Manuscript
Author Manuscript
Extended Data Figure 4.
ANE ancestry is present in both Europe and the Near East but WHG ancestry is restricted to Europe, which cannot be due to a single admixture event.
(x-axis) We computed the statistic f4(Test, Stuttgart; MA1, Chimp), which measures where
MA1 shares more alleles with a test population than with Stuttgart. It is positive for most European and Near Eastern populations, consistent with ANE (MA1-related) gene flow into both regions. (y-axis) We computed the statistic f4(Test, Stuttgart; Loschbour, Chimp),
which measures whether Loschbour shares more alleles with a test sample than with Stuttgart. Only European populations show positive values of this statistic, providing evidence of WHG (Loschbour-related) admixture only in Europeans.
Author Manuscript
Author Manuscript
Author Manuscript
Extended Data Figure 5.
MA1 is the best surrogate for ANE for which we have data.
Europeans share more alleles with MA1 than with Karitiana, as we see from the fact that in a plot of f4(Test, BedouinB; MA1, Chimp) and f4(Test, BedouinB; Karitiana, Chimp), the
European cline deviates in the direction of MA1, rather than Karitiana (the slope is >1 and European populations are above the line indicating equality of these two statistics).
Author Manuscript
Author Manuscript
Author Manuscript
Extended Data Figure 6.
The differential relatedness of West Eurasians to Stuttgart (EEF), Loschbour (WHG), and MA1 (ANE) cannot be explained by two-way mixture.
We plot on a West Eurasian map the statistic f4(Test, Chimp; A1, A2), where A1 and A2 are a
pair of the three ancient samples representing the three ancestral populations of Europe. (A) In both Europe and the Near East/Caucasus, populations from the south have more
relatedness to Stuttgart than those from the north where ANE influence is also important. (B) Northern European populations share more alleles with Loschbour than with Stuttgart, as they have additional WHG ancestry beyond what was already present in EEF. (C) We observe a striking contrast between Europe west of the Caucasus and the Near East in degree of relatedness to WHG. In Europe, there is a much higher degree of allele sharing with Loschbour than with MA1, which we ascribe to the 60–80% WHG/(WHG+ANE) ratio in most Europeans that we report in SI14. In contrast, the Near East has no appreciable WHG ancestry but some ANE ancestry, especially in the northern Caucasus. (Jewish populations are marked with a square in this figure to assist in interpretation as their ancestry is often anomalous for their geographic regions.)
Author Manuscript
Author Manuscript
Author Manuscript
Extended Data Figure 7.
Evidence for Siberian gene flow into far northeastern Europe.
Some northeastern European populations (Chuvash, Finnish, Russian, Mordovian, Saami) share more alleles with Han Chinese than with other Europeans who are arrayed in a cline from Stuttgart to Lithuanians/Estonians in a plot of f4(Test, BedouinB; Han, Mbuti) against
f4(Test, BedouinB; MA1, Mbuti).
Extended Data Table 1
West Eurasians genotyped on the Human Origins array and key f-statistics.
Sampling Location Lowest f3(X; Ref1, Ref2) Lowest f3(X; EEF, WHG) (Z<0 and Zdiff<3 reported)
Lowest f3(X; Near East, WHG) (Z<0 and Zdiff<3 reported)
Lowest f3(X; EEF, ANE) (Z<0 and Zdiff<3 reported)
f4(Stuttgart, X; Loschbour, Chimp)
f4(Stuttgart, X; MA1, Chimp)
X N Lat. Long. Ref1 Ref2 statistic Z Ref1 Ref2 statistic Z Zdiff Ref1 Ref2 statistic Z Zdiff Ref1 Ref2 statistic Z Zdiff statistic Z statistic Z
Abkhasian 9 43 41.02 Stu MA1 −0.0053 −2.9 Georgian LaB −0.0004 −0.5 2.6 Stu MA1 −0.0053 −2.9 0.0 0.0020 4.2 −0.0023 −4.7
Adygei 17 44 39 Piapoco Stu −0.0073 −5.9 Stu MA1 −0.0067 −4.1 0.3 0.0013 2.6 −0.0029 −6.0
Albanian 6 41.33 19.83 Stu MA1 −0.0121 −7.0 Iraqi_Jew Los −0.0090 −9.1 1.7 Stu MA1 −0.0121 −7.0 0.0 −0.0009 −1.8 −0.0027 −5.4
Armenian 10 40.19 44.55 GujaratiC Stu −0.0070 −8.2 Stu MA1 −0.0068 −4.1 0.1 0.0022 4.5 −0.0016 −3.3
Ashkenazi_Jew 7 52.23 21.02 Stu MA1 −0.0057 −3.4 Iraqi_Jew Los −0.0042 −4.7 1.0 Stu MA1 −0.0057 −3.4 0.0 0.0008 1.7 −0.0010 −2.0
Balkar 10 43.48 43.62 Piapoco Stu −0.0113 −8.9 Stu MA1 −0.0092 −5.5 1.1 0.0014 2.9 −0.0027 −5.6
Basque 29 43.04 −0.65 Iraqi_Jew Los −0.0083 −10.3 Stu Los −0.0061 −3.8 1.3 Iraqi_Jew Los −0.0083 −10.3 0.0 Stu MA1 −0.0041 −2.4 2.2 −0.0034 −7.2 −0.0032 −6.7
BedouinA 25 31 35 Esan Stu −0.0162 −18.2 0.0062 13.0 0.0026 5.4
BedouinB 19 31 35 Esan Stu 0.0089 7.8 0.0046 9.3 0.0019 3.9
Belarusian 10 53.92 28.01 Georgian Los −0.0133 −17.6 Georgian Los −0.0133 −17.6 0.0 Stu MA1 −0.0102 −6.1 1.9 −0.0035 −6.9 −0.0042 −8.6
Bergamo 12 46 10 Stu MA1 −0.0106 −6.2 Stu Los −0.0068 −4.2 1.7 Iraqi_Jew Los −0.0100 −11.9 0.3 Stu MA1 −0.0106 −6.2 0.0 −0.0018 −3.9 −0.0028 −5.8
Bulgarian 10 42.16 24.74 Stu MA1 −0.0130 −8.2 Stu LaB −0.0074 −4.5 2.8 Iraqi_Jew Los −0.0106 −12.4 1.5 Stu MA1 −0.0130 −8.2 0.0 −0.0012 −2.5 −0.0028 −5.9
Chechen 9 43.33 45.65 Stu MA1 −0.0056 −3.2 Georgian Los −0.0002 −0.3 2.8 Stu MA1 −0.0056 −3.2 0.0 0.0011 2.3 −0.0031 −6.2
Croatian 10 43.51 16.45 Stu MA1 −0.0114 −6.7 Stu Los −0.0065 −3.8 2.1 Iraqi_Jew Los −0.0112 −13.0 0.2 Stu MA1 −0.0114 −6.7 0.0 −0.0023 −4.7 −0.0035 −7.4
Cypriot 8 35.13 33.43 Stu MA1 −0.0057 −3.2 Yemenite_Jew Los −0.0013 −1.5 2.5 Stu MA1 −0.0057 −3.2 0.0 0.0019 3.9 −0.0012 −2.5
Czech 10 50.1 14.4 Georgian Los −0.0137 −17.9 Stu Los −0.0088 −5.3 3.0 Georgian Los −0.0137 −17.9 0.0 Stu MA1 −0.0121 −7.2 0.9 −0.0032 −6.6 −0.0040 −8.2
Druze 39 32 35 Stu MA1 −0.0024 −1.5 Stu MA1 −0.0024 −1.5 0.0 0.0028 5.9 −0.0006 −1.3
English 10 50.75 −2.09 Iraqi_Jew Los −0.0129 −14.8 Stu Los −0.0090 −5.5 2.2 Iraqi_Jew Los −0.0129 −14.8 0.0 Stu MA1 −0.0125 −7.4 0.1 −0.0032 −6.5 −0.0041 −8.5
Estonian 10 58.54 24.89 Abkhasian Los −0.0124 −15.1 Abkhasian Los −0.0124 −15.1 0.0 Stu MA1 −0.0094 −5.6 1.9 −0.0043 −8.5 −0.0051 −10.1
Author Manuscript
Author Manuscript
Author Manuscript
Sampling Location Lowest f3(X; Ref1, Ref2) Lowest f3(X; EEF, WHG) (Z<0 and Zdiff<3 reported)
Lowest f3(X; Near East, WHG) (Z<0 and Zdiff<3 reported)
Lowest f3(X; EEF, ANE) (Z<0 and Zdiff<3 reported)
f4(Stuttgart, X; Loschbour, Chimp)
f4(Stuttgart, X; MA1, Chimp)
X N Lat. Long. Ref1 Ref2 statistic Z Ref1 Ref2 statistic Z Zdiff Ref1 Ref2 statistic Z Zdiff Ref1 Ref2 statistic Z Zdiff statistic Z statistic Z
Finnish 7 60.2 24.9 Abkhasian Los −0.0102 −11.3 Abkhasian Los −0.0102 −11.3 0.0 Stu MA1 −0.0078 −4.4 1.4 −0.0035 −6.9 −0.0045 −9.1
French 25 46 2 Stu MA1 −0.0131 −8.4 Stu Los −0.0098 −6.3 1.5 Iraqi_Jew Los −0.0129 −16.8 0.2 Stu MA1 −0.0131 −8.4 0.0 −0.0027 −5.6 −0.0036 −7.7
French_South 7 43.44 −0.62 Iraqi_Jew Los −0.0095 −9.5 Stu LaB −0.0089 −5.0 0.3 Iraqi_Jew Los −0.0095 −9.5 0.0 Stu MA1 −0.0086 −4.8 0.4 −0.0030 −6.2 −0.0031 −6.2
Georgian 10 42.5 41.85 GujaratiC Stu −0.0036 −4.0 Stu MA1 −0.0036 −2.1 −0.2 0.0020 4.2 −0.0019 −3.9
Georgian_Jew 7 41.72 44.78 GujaratiC Stu −0.0009 −0.9 Stu MA1 −0.0002 −0.1 0.3 0.0022 4.3 −0.0017 −3.4
Greek 20 39.84 23.17 Stu MA1 −0.0118 −7.4 Iraqi_Jew Los −0.0080 −11.1 2.3 Stu MA1 −0.0118 −7.4 0.0 −0.0004 −0.9 −0.0026 −5.6
Hungarian 20 47.49 19.08 Stu MA1 −0.0133 −8.4 Stu Los −0.0087 −5.6 2.2 Iraqi_Jew Los −0.0127 −15.9 0.4 Stu MA1 −0.0133 −8.4 0.0 −0.0025 −5.3 −0.0037 −7.8
Icelandic 12 64.13 −21.93 Abkhasian Los −0.0121 −15.6 Stu Los −0.0078 −4.8 2.7 Abkhasian Los −0.0121 −15.6 0.0 Stu MA1 −0.0097 −5.9 1.5 −0.0038 −7.7 −0.0043 −8.9
Iranian 8 35.59 51.46 Piapoco Stu −0.0094 −7.2 Stu MA1 −0.0087 −5.2 0.4 0.0031 6.3 −0.0016 −3.2
Iranian_Jew 9 35.7 51.42 GujaratiC Stu −0.0018 −2.0 Stu MA1 −0.0012 −0.6 0.2 0.0028 5.7 −0.0011 −2.2
Iraqi_Jew 6 33.33 44.42 Vishwabrahmin Stu −0.0026 −2.6 Stu MA1 −0.0009 −0.5 0.9 0.0030 6.1 −0.0005 −1.0
Jordanian 9 32.05 35.91 Esan Stu −0.0145 −14.3 0.0048 9.6 0.0014 2.8
Kumyk 8 43.25 46.58 Piapoco Stu −0.0111 −8.2 Stu MA1 −0.0109 −6.5 0.1 0.0015 3.1 −0.0028 −5.7
Lebanese 8 33.82 35.57 Esan Stu −0.0105 −9.4 Stu MA1 −0.0068 −3.9 1.9 0.0038 7.7 0.0002 0.4
Lezgin 9 42.12 48.18 Stu MA1 −0.0100 −6.0 Stu MA1 −0.0100 −6.0 0.0 0.0013 2.7 −0.0037 −7.5
Libyan_Jew 9 32.92 13.18 Esan Stu −0.0051 −4.4 Stu MA1 0.0000 0.0 2.7 0.0030 6.2 0.0004 0.9
Lithuanian 10 54.9 23.92 Abkhasian Los −0.0119 −14.9 Abkhasian Los −0.0119 −14.9 0.0 Stu MA1 −0.0069 −3.9 2.8 −0.0045 −9.0 −0.0048 −9.9
Maltese 8 35.94 14.38 Stu MA1 −0.0086 −4.9 Yemenite_Jew Los −0.0051 −6.0 2.0 Stu MA1 −0.0086 −4.9 0.0 0.0013 2.7 −0.0011 −2.3
Mordovian 10 54.18 45.18 Abkhasian Los −0.0115 −14.4 Abkhasian Los −0.0115 −14.4 0.0 Stu MA1 −0.0113 −6.6 0.3 −0.0028 −5.5 −0.0044 −9.0
Moroccan_Jew 6 34.02 −6.84 Esan Stu −0.0062 −5.2 Yemenite_Jew Los −0.0021 −2.2 2.9 Stu MA1 −0.0032 −1.7 1.4 0.0021 4.3 −0.0001 −0.1
North_Ossetian 10 43.02 44.65 Piapoco Stu −0.0093 −7.2 Stu MA1 −0.0076 −4.4 1.0 0.0014 2.9 −0.0028 −5.6
Norwegian 11 60.36 5.36 Georgian Los −0.0120 −14.8 Georgian Los −0.0120 −14.8 0.0 Stu MA1 −0.0093 −5.4 1.4 −0.0035 −7.3 −0.0042 −8.7
Orcadian 13 59 −3 Armenian Los −0.0102 −13.4 Stu Los −0.0059 −3.6 2.5 Armenian Los −0.0102 −13.4 0.0 Stu MA1 −0.0098 −5.9 0.5 −0.0032 −6.7 −0.0042 −8.6
Palestinian 38 32 35 Esan Stu −0.0120 −13.2 0.0047 10.2 0.0014 3.1
Russian 22 61 40 Chukchi Los −0.0119 −11.3 Abkhasian Los −0.0119 −17.1 0.0 Stu MA1 −0.0106 −6.6 0.8 −0.0030 −6.2 −0.0046 −9.4
Sardinian 27 40 9 Stu LaB −0.0044 −2.6 Stu LaB −0.0044 −2.6 0.0 Iraqi_Jew Los −0.0033 −4.2 0.0 Stu MA1 −0.0035 −2.1 0.3 −0.0016 −3.4 −0.0015 −3.3
Saudi 8 18.49 42.52 Kgalagadi Stu −0.0042 −3.6 0.0042 8.6 0.0015 3.1
Scottish 4 56.04 −3.94 Iraqi_Jew Los −0.0103 −8.3 Iraqi_Jew Los −0.0103 −8.3 0.0 Stu MA1 −0.0090 −4.7 0.7 −0.0034 −6.4 −0.0045 −8.7
Sicilian 11 37.59 13.77 Stu MA1 −0.0108 −6.5 Yemenite_Jew Los −0.0066 −8.1 2.4 Stu MA1 −0.0108 −6.5 0.0 0.0006 1.3 −0.0015 −3.2
Spanish 53 40.43 −2.83 Iraqi_Jew Los −0.0126 −17.8 Stu Los −0.0104 −6.8 1.4 Iraqi_Jew Los −0.0126 −17.8 0.0 Stu MA1 −0.0120 −7.6 0.3 −0.0019 −4.2 −0.0024 −5.2
Spanish_North 5 42.8 −2.7 Iraqi_Jew Los −0.0112 −9.9 Stu Los −0.0102 −5.4 0.5 Iraqi_Jew Los −0.0112 −9.9 0.0 Stu MA1 −0.0082 −4.4 1.3 −0.0035 −6.9 −0.0032 −6.4
Syrian 8 35.13 36.87 Esan Stu −0.0101 −8.7 0.0044 8.6 0.0012 2.4
Tunisian_Jew 7 36.8 10.18 Gambian Stu −0.0026 −2.0 0.0026 5.2 0.0002 0.5
Turkish 56 39.22 32.66 Piapoco Stu −0.0129 −11.3 Stu MA1 −0.0106 −6.9 1.3 0.0018 3.8 −0.0019 −4.0
Turkish_Jew 8 41.02 28.95 Stu MA1 −0.0075 −4.3 Yemenite_Jew Los −0.0049 −5.8 1.4 Stu MA1 −0.0075 −4.3 0.0 0.0017 3.6 −0.0006 −1.3
Tuscan 8 43 11 Stu MA1 −0.0109 −6.4 Stu Los −0.0055 −3.2 2.3 Iraqi_Jew Los −0.0092 −10.1 0.9 Stu MA1 −0.0109 −6.4 0.0 −0.0011 −2.2 −0.0024 −5.0
Ukrainian 9 50.29 31.56 Georgian Los −0.0134 −16.7 Georgian Los −0.0134 −16.7 0.0 Stu MA1 −0.0114 −6.6 1.3 −0.0032 −6.4 −0.0041 −8.5
Yemenite_Jew 8 15.35 44.2 Esan Stu −0.0027 −2.4 0.0046 9.1 0.0013 2.6
Note: Zdiff is the number of standard errors of the difference between the lowest f3-statistic over all reference pairs and the lowest f3-statistic for a subset of reference pairs.
Abbreviations used: Stu: Stuttgart; Los: Loschbour; LaB: LaBrana.
Extended Data Table 2
Confirmation of key findings on transversions and on whole genome sequence data.
Interpretation
D(A, B; C, D) on Human Origins genotype data D(A, B; C, D) on whole genome sequence data transversions
A B C D 594,924 SNPs 110,817 transversions A B C D statistic Z statistic Z statistic Z Stuttgart has Near Eastern ancestry
Stuttgart Armenian Loschbour Chimp 0.0219 4.5 0.0189 2.9 Europeans
have more WHG-related ancestry than Stuttgart
Stuttgart French Loschbour Chimp −0.0266 −5.7 −0.031 −5.0 Stuttgart French2 Loschbour Chimp −0.03 −4.7 Lithuanian Stuttgart Loschbour Chimp 0.0446 9.1 0.0477 7.2
West Eurasians have more ANE-related ancestry than Stuttgart
French Stuttgart MA1 Chimp 0.0367 7.7 0.0386 5.5 French2 Stuttgart MA1 Chimp 0.037 6.4 Lezgin Stuttgart MA1 Chimp 0.0372 7.6 0.0409 5.6
MA1 is a better surrogate of ANE ancestry than Karitiana
French Chimp MA1 Karitiana 0.0207 4.5 0.0214 2.8 French2 Chimp MA1 Karitiana2 0.026 3.8
Author Manuscript
Author Manuscript
Author Manuscript
Interpretation
D(A, B; C, D) on Human Origins genotype data D(A, B; C, D) on whole genome sequence data transversions
A B C D 594,924 SNPs 110,817 transversions A B C D statistic Z statistic Z statistic Z Eastern non-Africans closer to WHG/ANE/S HG than to EEF
Loschbour Stuttgart Onge Chimp 0.0196 3.5 0.0202 2.5
Loschbour Stuttgart Papuan Chimp 0.0142 2.6 0.0127 1.5 Loschbour Stuttgart Papuan2 Chimp 0.017 2.7 Loschbour Stuttgart Dai Chimp 0.0164 3.2 0.021 2.8 Loschbour Stuttgart Dai2 Chimp 0.018 2.9 MA1 Stuttgart Papuan Chimp 0.0139 2.2 0.0103 1.0 MA1 Stuttgart Papuan2 Chimp 0.018 2.8 MA1 Stuttgart Dai Chimp 0.0174 3.0 0.016 1.7 MA1 Stuttgart Dai2 Chimp 0.028 4.3 Motala12 Stuttgart Papuan Chimp 0.0182 3.2 0.011 1.1 Motala12 Stuttgart Papuan2 Chimp 0.023 3.7 Motala12 Stuttgart Dai Chimp 0.0156 2.8 0.0149 1.6 Motala12 Stuttgart Dai2 Chimp 0.02 3.2 LaBrana Stuttgart Papuan Chimp 0.0123 2.3 0.0101 1.1 LaBrana Stuttgart Papuan2 Chimp 0.02 3.2 LaBrana Stuttgart Dai Chimp 0.0149 2.9 0.0228 2.5 LaBrana Stuttgart Dai2 Chimp 0.024 3.7 Native
Americans closer to ANE than to WHG
Karitiana Chimp MA1 Loschbour 0.0467 7.1 0.0467 4.4 Karitiana2 Chimp MA1 Loschbour 0.052 7.1
West Eurasians closer to Native Americans than to other Eastern non-Africans
Stuttgart Chimp Karitiana Papuan 0.0559 10.9 0.0474 6.6 Stuttgart Chimp Karitiana2 Papuan2 0.052 7.6 Stuttgart Chimp Karitiana Onge 0.0237 5.1 0.0179 2.6
Ancient Eurasian hunter-gatherers equally related to Eastern non-Africans other than Native Americans
Loschbour MA1 Dai Chimp −0.0015 −0.2 0.0016 0.2 Loschbour MA1 Dai2 Chimp −0.013 −1.9 Loschbour MA1 Papuan Chimp 0.0002 0.0 0.0012 0.1 Loschbour MA1 Papuan2 Chimp −0.003 −0.4 Loschbour Motala12 Dai Chimp 0.0024 0.4 0.009 0.9 Loschbour Motala12 Dai2 Chimp −0.002 −0.3 Loschbour Motala12 Papuan Chimp −0.0028 −0.4 0.0046 0.5 Loschbour Motala12 Papuan2 Chimp −0.004 −0.6 MA1 Motala12 Dai Chimp 0.0026 0.4 0.0047 0.4 MA1 Motala12 Dai2 Chimp 0.01 1.5 MA1 Motala12 Papuan Chimp −0.0047 −0.7 −0.001 −0.1 MA1 Motala12 Papuan2 Chimp −0.004 −0.5 LaBrana and
Loschbour are a clade
LaBrana Loschbour Dai Chimp −0.0028 −0.5 0.0024 0.3 LaBrana Loschbour Dai2 Chimp 0.007 1.1 LaBrana Loschbour Papuan Chimp −0.0031 −0.5 −0.0012 −0.1 LaBrana Loschbour Papuan2 Chimp 0.002 0.3 LaBrana Loschbour MA1 Chimp −0.006 −0.8 0.0101 0.7 LaBrana Loschbour MA1 Chimp 0.005 0.7 SHG closer to
ANE than to WHG
Motala12 Loschbour MA1 Chimp 0.0425 5.3 0.0353 2.6 Motala12 Loschbour MA1 Chimp 0.042 5.9 Motala12 LaBrana MA1 Chimp 0.0465 5.8 0.0347 2.4 Motala12 LaBrana MA1 Chimp 0.038 5.4 LaBrana and
Loschbour equally related to Stuttgart
LaBrana Loschbour Stuttgart Chimp −0.0176 −2.6 −0.0106 −1.0 LaBrana Loschbour Stuttgart Chimp −0.012 −1.8
Extended Data Table 3
Admixture proportions for European populations. The estimates from the model with minimal assumptions are from SI17. The estimates from the full modeling are from SI14 either by single population analysis or co-fitting population pairs and averaging over fits (these averages are the results plotted in Fig. 2B). Populations that do not fit the models are not reported. Full modeling of population relationships (individual fits) Full modeling of population relationships (averaged fits) Modeling of population relationships with minimal assumptions Model-based (averaged) - Model with minimal assumptions (Z-score) EEF WHG ANE EEF WHG ANE EEF WHG ANE EEF WHG ANE
Mean Range Mean Range Mean Range
Albanian 0.781 0.092 0.127 0.781 0.772–0.819 0.082 0.032–0.098 0.137 0.129–0.158 0.595 ± 0.112 0.353 ± 0.150 0.052 ± 0.049 1.658 −1.807 1.741 Ashkenazi_Jew 0.931 0 0.069 0.938 ± 0.146 −0.021 ± 0.185 0.083 ± 0.049 Basque 0.593 0.293 0.114 0.569 0.527–0.616 0.335 0.255–0.392 0.096 0.076–0.129 0.569 ± 0.091 0.315 ± 0.124 0.115 ± 0.041 −0.001 0.165 −0.472 Belarusian 0.418 0.431 0.151 0.426 0.397–0.464 0.408 0.338–0.443 0.167 0.150–0.199 0.272 ± 0.094 0.554 ± 0.131 0.174 ± 0.047 1.637 −1.118 −0.158 Bergamo 0.715 0.177 0.108 0.721 0.704–0.793 0.163 0.061–0.189 0.117 0.104–0.147 0.644 ± 0.125 0.248 ± 0.170 0.108 ± 0.053 0.615 −0.503 0.162
Author Manuscript
Author Manuscript
Author Manuscript
Author Manuscript
Full modeling of population relationships (individual fits) Full modeling of population relationships (averaged fits) Modeling of population relationships with minimal assumptions Model-based (averaged) - Model with minimal assumptions (Z-score) EEF WHG ANE EEF WHG ANE EEF WHG ANE EEF WHG ANE
Mean Range Mean Range Mean Range
Bulgarian 0.712 0.147 0.141 0.718 0.707–0.778 0.132 0.047–0.151 0.151 0.138–0.175 0.556 ± 0.110 0.328 ± 0.143 0.116 ± 0.043 1.469 −1.372 0.804 Croatian 0.561 0.293 0.145 0.564 0.548–0.586 0.285 0.242–0.310 0.151 0.137–0.172 0.453 ± 0.122 0.407 ± 0.159 0.140 ± 0.046 0.911 −0.768 0.238 Czech 0.495 0.338 0.167 0.489 0.460–0.531 0.348 0.273–0.382 0.163 0.145–0.196 0.402 ± 0.117 0.400 ± 0.162 0.198 ± 0.050 0.744 −0.322 −0.698 English 0.495 0.364 0.141 0.503 0.476–0.536 0.353 0.296–0.382 0.144 0.130–0.169 0.475 ± 0.091 0.357 ± 0.125 0.168 ± 0.043 0.304 −0.028 −0.561 Estonian 0.322 0.495 0.183 0.323 0.293–0.345 0.49 0.451–0.520 0.187 0.172–0.205 0.072 ± 0.121 0.778 ± 0.176 0.150 ± 0.064 2.070 −1.636 0.584 French 0.554 0.311 0.135 0.563 0.537–0.601 0.297 0.230–0.328 0.14 0.126–0.169 0.498 ± 0.097 0.359 ± 0.127 0.142 ± 0.039 0.672 −0.487 −0.060 French_South 0.675 0.195 0.13 0.636 0.589–0.738 0.256 0.111–0.323 0.108 0.088–0.151 0.636 ± 0.116 0.225 ± 0.165 0.140 ± 0.057 −0.003 0.189 −0.558 Greek 0.792 0.058 0.151 0.791 0.780–0.816 0.048 0.019–0.060 0.161 0.150–0.171 0.658 ± 0.098 0.255 ± 0.127 0.086 ± 0.039 1.357 −1.627 1.915 Hungarian 0.558 0.264 0.179 0.548 0.520–0.590 0.279 0.199–0.313 0.174 0.156–0.210 0.391 ± 0.109 0.454 ± 0.153 0.155 ± 0.050 1.437 −1.145 0.371 Icelandic 0.394 0.456 0.15 0.409 0.386–0.424 0.448 0.409–0.473 0.143 0.126–0.170 0.342 ± 0.102 0.476 ± 0.137 0.182 ± 0.045 0.654 −0.204 −0.861 Lithuanian 0.364 0.464 0.172 0.352 0.327–0.384 0.488 0.433–0.527 0.16 0.135–0.184 0.248 ± 0.117 0.548 ± 0.163 0.205 ± 0.052 0.886 −0.367 −0.864 Maltese 0.932 0 0.068 1.298 ± 0.185 −0.509 ± 0.248 0.211 ± 0.079 Norwegian 0.411 0.428 0.161 0.417 0.388–0.438 0.423 0.383–0.450 0.16 0.140–0.181 0.273 ± 0.115 0.557 ± 0.161 0.170 ± 0.055 1.252 −0.831 −0.185 Orcadian 0.457 0.385 0.158 0.465 0.439–0.493 0.378 0.329–0.403 0.157 0.140–0.179 0.395 ± 0.088 0.437 ± 0.122 0.168 ± 0.041 0.798 −0.487 −0.264 Sardinian 0.817 0.175 0.008 0.818 0.791–0.874 0.141 0.058–0.182 0.041 0.026–0.068 0.883 ± 0.128 0.075 ± 0.166 0.042 ± 0.048 −0.510 0.400 −0.024 Scottish 0.39 0.428 0.182 0.408 0.387–0.424 0.421 0.384–0.448 0.171 0.149–0.201 0.286 ± 0.112 0.532 ± 0.156 0.182 ± 0.053 1.091 −0.712 −0.210 Sicilian 0.903 0 0.097 1.012 ± 0.149 −0.131 ± 0.199 0.119 ± 0.060 Spanish 0.809 0.068 0.123 0.759 0.736–0.804 0.126 0.066–0.170 0.115 0.091–0.151 0.856 ± 0.126 −0.015 ± 0.165 0.160 ± 0.049 −0.769 0.855 −0.922 Spanish_North 0.713 0.125 0.163 0.612 0.561–0.660 0.292 0.214–0.365 0.096 0.072–0.126 0.581 ± 0.120 0.298 ± 0.158 0.121 ± 0.046 0.254 −0.038 −0.533 Tuscan 0.746 0.136 0.118 0.751 0.737–0.806 0.123 0.047–0.145 0.126 0.114–0.150 0.734 ± 0.118 0.153 ± 0.160 0.113 ± 0.054 0.141 −0.188 0.249 Ukrainian 0.462 0.387 0.151 0.463 0.445–0.491 0.376 0.322–0.399 0.16 0.148–0.187 0.259 ± 0.123 0.596 ± 0.173 0.145 ± 0.057 1.661 −1.269 0.269 Finnish −0.299 ± 0.204 1.194 ± 0.296 0.105 ± 0.105 Mordovian −0.255 ± 0.173 1.151 ± 0.246 0.104 ± 0.090 Russian −0.303 ± 0.211 1.230 ± 0.301 0.072 ± 0.106
Supplementary Material
Refer to Web version on PubMed Central for supplementary material.
Authors
Iosif Lazaridis1,2, Nick Patterson2, Alissa Mittnik3, Gabriel Renaud4, Swapan
Mallick1,2, Karola Kirsanow5, Peter H. Sudmant6, Joshua G. Schraiber7, Sergi
Castellano4, Mark Lipson8, Bonnie Berger2,8, Christos Economou9, Ruth
Bollongino5, Qiaomei Fu1,4,10, Kirsten I. Bos3, Susanne Nordenfelt1,2, Heng Li1,2,
Cesare de Filippo4, Kay Prüfer4, Susanna Sawyer4, Cosimo Posth3, Wolfgang
Haak11, Fredrik Hallgren12, Elin Fornander12, Nadin Rohland1,2, Dominique
Delsate13,14, Michael Francken15, Jean-Michel Guinet13, Joachim Wahl16, George
Ayodo17, Hamza A. Babiker18,19, Graciela Bailliet20, Elena Balanovska21, Oleg
Balanovsky21,22, Ramiro Barrantes23, Gabriel Bedoya24, Haim Ben-Ami25, Judit
Bene26, Fouad Berrada27, Claudio M. Bravi20, Francesca Brisighelli28, George B. J.
Busby29,30, Francesco Cali31, Mikhail Churnosov32, David E. C. Cole33, Daniel
Corach34, Larissa Damba35, George van Driem36, Stanislav Dryomov37,
Jean-Michel Dugoujon38, Sardana A. Fedorova39, Irene Gallego Romero40, Marina
Gubina35, Michael Hammer41, Brenna M. Henn42, Tor Hervig43, Ugur Hodoglugil44,
Aashish R. Jha40, Sena Karachanak-Yankova45, Rita Khusainova46,47, Elza
Khusnutdinova46,47, Rick Kittles48, Toomas Kivisild49, William Klitz7, Vaidutis
Kučinskas50, Alena Kushniarevich51, Leila Laredj52, Sergey Litvinov46,47,51,
Author Manuscript
Author Manuscript
Author Manuscript
Theologos Loukidis53, Robert W. Mahley54, Béla Melegh26, Ene Metspalu55, Julio Molina56, Joanna Mountain57, Klemetti Näkkäläjärvi58, Desislava Nesheva45, Thomas Nyambo59, Ludmila Osipova35, Jüri Parik55, Fedor Platonov60, Olga Posukh35, Valentino Romano61, Francisco Rothhammer62,63,64, Igor Rudan65, Ruslan Ruizbakiev66, Hovhannes Sahakyan51,67, Antti Sajantila68,69, Antonio Salas70, Elena B. Starikovskaya37, Ayele Tarekegn71, Draga Toncheva45, Shahlo Turdikulova72, Ingrida Uktveryte50, Olga Utevska73, René Vasquez74, Mercedes Villena74, Mikhail Voevoda35,75, Cheryl Winkler76, Levon Yepiskoposyan67, Pierre Zalloua77,78, Tatijana Zemunik79, Alan Cooper11, Cristian Capelli29, Mark G. Thomas80, Andres Ruiz-Linares80, Sarah A. Tishkoff81, Lalji Singh82,83, Kumarasamy Thangaraj82, Richard Villems51,55,84, David Comas85, Rem Sukernik37, Mait Metspalu51, Matthias Meyer4, Evan E. Eichler6,86, Joachim Burger5, Montgomery Slatkin7, Svante Pääbo4, Janet Kelso4, David Reich1,2,87,†, and Johannes Krause3,88,90,†
Affiliations
1Department of Genetics, Harvard Medical School, Boston, MA, 02115, USA 2Broad
Institute of Harvard and MIT, Cambridge, MA, 02142, USA 3Institute for
Archaeological Sciences, University of Tübingen, Tübingen, 72074, Germany 4Max
Planck Institute for Evolutionary Anthropology, Leipzig, 04103, Germany 5Johannes
Gutenberg University Mainz, Institute of Anthropology, Mainz, D-55128, Germany
6Department of Genome Sciences, University of Washington, Seattle, WA, 98195,
USA 7Department of Integrative Biology, University of California, Berkeley, CA,
94720-3140, USA 8Department of Mathematics and Computer Science and Artificial
Intelligence Laboratory, Massachusetts Institute of Technology, Cambridge, MA 02139, USA 9Archaeological Research Laboratory, Stockholm University, 114 18,
Sweden 10Key Laboratory of Vertebrate Evolution and Human Origins of Chinese
Academy of Sciences, IVPP, CAS, Beijing, 100049, China 11Australian Centre for
Ancient DNA, School of Earth and Environmental Sciences, University of Adelaide, Adelaide, South Australia, SA 5005, Australia 12The Cultural Heritage Foundation,
Västerås, 722 12, Sweden 13National Museum of Natural History, L-2160,
Luxembourg 14National Center of Archaeological Research, National Museum of
History and Art, L-2345, Luxembourg 15Department of Paleoanthropology,
Senckenberg Center for Human Evolution and Paleoenvironment, University of Tübingen, Tübingen, D-72070, Germany 16State Office for Cultural Heritage
Management Baden-Württemberg, Osteology, Konstanz, D-78467, Germany
17Center for Global Health and Child Development, Kisumu, 40100, Kenya 18Institutes of Evolution, Immunology and Infection Research, School of Biological
Sciences, University of Edinburgh, Edinburgh, EH9 3JT, UK 19Biochemistry
Department, Faculty of Medicine, Sultan Qaboos University, Alkhod, Muscat, 123, Oman 20Laboratorio de Genética Molecular Poblacional, Instituto Multidisciplinario
de Biología Celular (IMBICE), CCT-CONICET & CICPBA, La Plata, B1906APO, Argentina 21Research Centre for Medical Genetics, Moscow, 115478, Russia 22Vavilov Institute for General Genetics, Moscow, 119991, Russia 23Escuela de
Biología, Universidad de Costa Rica, San José, 2060, Costa Rica 24Institute of