UWS Academic Portal
Long-term effects of high intensity resistance and endurance exercise on plasma
leptin and ghrelin in overweight individuals
Tremblay, Angelo; Dutheil, Frédéric; Drapeau, Vicky; Metz, Lore; Lesourd, Bruno; Chapier,
Robert; Pereira, Bruno; Verney, Julien; Baker, Julien S.; Vinet, Agnes; Walther, Guillaume;
Obert, Philippe; Courteix, Daniel; Thivel, David
Published in:
Applied Physiology, Nutrition, and Metabolism
DOI:
10.1139/apnm-2019-0019
Published: 01/11/2019
Document Version
Peer reviewed version
Link to publication on the UWS Academic Portal
Citation for published version (APA):
Tremblay, A., Dutheil, F., Drapeau, V., Metz, L., Lesourd, B., Chapier, R., Pereira, B., Verney, J., Baker, J. S.,
Vinet, A., Walther, G., Obert, P., Courteix, D., & Thivel, D. (2019). Long-term effects of high intensity resistance
and endurance exercise on plasma leptin and ghrelin in overweight individuals: the RESOLVE Study. Applied
Physiology, Nutrition, and Metabolism, 44(11), 1172-1179. https://doi.org/10.1139/apnm-2019-0019
General rights
Copyright and moral rights for the publications made accessible in the UWS Academic Portal are retained by the authors and/or other copyright owners and it is a condition of accessing publications that users recognise and abide by the legal requirements associated with these rights.
Take down policy
If you believe that this document breaches copyright please contact pure@uws.ac.uk providing details, and we will remove access to the work immediately and investigate your claim.
Copyright and reuse of content
As of 2009, copyright of all articles in NRC Research Press journals remains with the authors.
Copyright of all articles published prior to 2009 is held by Canadian Science Publishing (operating as
NRC Research Press) or its licensors.
No part of the NRC Research Press journals may be reproduced, stored, or transmitted in any form
or by any means, without the written permission, obtainable through RightsLink, except as stated
below or for those open access journals or articles administered under the terms of a Creative
Commons license.
Under the Canadian Copyright Act, individuals may download or print single copies of articles for
personal research or study. Any person may reproduce short excerpts (<100 words) from articles in
the journals for any purpose that respects the moral rights of authors, provided that the source is
fully acknowledged. As a courtesy, the consent of the author(s) of such material should be obtained
directly from the author(s).
Authorization to reproduce items other than for personal research or study, as stated above, may be
obtained by clicking on the "Reprints & Permissions" link in the Article Tools menu of the article in
question or under license by Access Copyright.
The NRC Research Press journals also extend certain additional rights to authors.
1 Long-term effects of high intensity resistance and endurance exercise on plasma leptin and 1
ghrelin in overweight individuals: the RESOLVE Study 2
Angelo Tremblay1,2, Frédéric Dutheil3,4, Vicky Drapeau1,5, Lore Metz6,7, Bruno Lesourd8, Robert
3
Chapier9, Bruno Pereira10, Julien Verney6,7, Julien S Baker11, Agnes Vinet12, Guillaume Walther12,
4
Philippe Obert12, Daniel Courteix6,7, David Thivel6,7
5 6
1Institute of Nutrition and Functional Foods (INAF), Université Laval, Quebec City, Canada 7
2Department of Kinesiology, Université Laval, Quebec City, Canada 8
3CNRS, LaPSCo, Physiological and Psychosocial Stress, University Hospital of Clermont-Ferrand, 9
CHU Clermont-Ferrand, Preventive and Occupational Medicine, WittyFit, Université Clermont 10
Auvergne, Clermont-Ferrand, France. 11
4Faculty of Health, School of Exercise Science, Australian Catholic University, Melbourne, VIC, 12
Australia. 13
5Department of Physical Education, Université Laval, Quebec City, Canada 14
6Clermont Auvergne University, EA 3533, Laboratory of the Metabolic Adaptations to Exercise 15
under Physiological and Pathological Conditions (AME2P), Clermont-Ferrand, France. 16
7CRNH-Auvergne, Clermont-Ferrand, France. 17
8CHU G. Montpied, F-63000 Clermont-Ferrand, France 18
9Thermalia Center, F-63140 Châtelguyon, France 19
10Clermont-Ferrand University hospital, Biostatistics unit (DRCI), Clermont-Ferrand, France 20
11Institute of Clinical Exercise and Health Sciences, School of Science and Sport, University of the 21
West of Scotland, Hamilton, Lanarkshire, Scotland, United Kingdom 22
12Avignon University LAPEC EA4278, F-84000 Avignon, France 23
24 25
Running head: Hormonal response to exercise 26
Corresponding author 27
Angelo Tremblay, Ph.D. 28
Department of Kinesiology, PEPS 29
2300, rue de la Terrasse, Université Laval 30
Québec, Canada, G1V 0A6 31 Phone: 418-656-7294 32 E-mail: angelo.tremblay@kin.ulaval.ca 33 34
Competing interest statement: The authors have no conflict of interest to disclose. 35
Authors’ implication: all authors significantly took part in the study from its conception to the 36
analyses of the data and writing of this paper. 37
2 Abstract
38
Objective: To evaluate the effects of high intensity resistance and endurance exercise on body 39
composition and plasma leptin and ghrelin concentrations in overweight individuals. 40
Methods: 100 participants were randomly assigned to three exercise interventions: high resistance-41
low aerobic (Re), low resistance-high aerobic (rE), and low resistance-low aerobic (re). Interventions 42
began with 3 weeks of residential supervision (Phase1) after which participants had to manage the 43
physical activity programs individually (Phase2). Body composition and plasma variables were 44
measured at baseline and after Phase 1 as well as after 3, 6, and 12 months. 45
Results: Significant decreases in weight and body fat were observed after Phase 1 (p<0.001), and 46
continued at a lower rate for up to 3 months, and then remained stable for the rest of the protocol. 47
Once a body weight plateau was reached, body fat loss after the Re and rE conditions exceeded by 48
1.5-2 kg the fat loss observed in the re condition (p<0.05). Leptin was significantly decreased after 49
Day 21 and Month 3 (p<0.001) and remained stable for the rest of the study. Ghrelin was significantly 50
increased after Day 21 and Month 3 (p<0.001) and returned to a level comparable to baseline between 51
Month 6 and 12 when body weight and fat had reached a plateau. 52
Conclusions: This study reinforces the idea that an increase in exercise intensity may accentuate 53
body fat loss before the occurrence of a body weight plateau. Resistance to further fat loss was 54
accompanied by a decrease in plasma leptin and an increase in plasma ghrelin. 55
56
Key words: obesity, physical activity, energy, appetite, hormones, fat 57
3 Introduction
59
Physical activity has been traditionally studied in the etiology and management of obesity because of 60
its potential to increase energy expenditure. Specifically, research has aimed to determine if there is 61
a deficit in exercise-induced thermogenesis in obese individuals whereas numerous clinical trials have 62
tested physical activity as a calorie-burning agent in weight loss interventions. However, we have 63
also shown that calorie for calorie, high intensity exercise is more susceptible to induce a negative 64
energy balance than a low to moderate intensity physical activity (27, 29). This effect seems to be 65
explained by post exercise adaptations such as an increase in resting metabolic rate (32) and an 66
incomplete compensation in energy intake (14). From a mechanistic standpoint, an increase in beta-67
adrenergic stimulation was found to be involved in these post exercise effects (25, 32). Furthermore, 68
the discovery of hormonal messengers such as leptin and ghrelin has enriched the study of 69
mechanisms that may underlie the impact of exercise training on energy balance. 70
Following its discovery in 1994 (34), leptin was shown to promote a negative energy balance via 71
anorectic and thermogenic effects (11, 18). Leptin was also found to be reduced in exercise-trained 72
individuals (12) as well as following exercise protocols (13). This is concordant with the study of 73
Pasman et al. (22) who reported a significant association between the number of hours of exercise 74
and plasma leptin following a 16-month protocol combining diet and exercise training (22). Leptin
75
has been found to increase with aging, altogether with increased leptin resistance (Rigamonti et al.,
76
2002). In a recent meta-analysis, Rostas and collaborators found that exercise training favors
77
decreased leptin concentrations in middle aged and older overweight and obese individuals, resistance
78
training inducing a more pronounced leptin reduction than aerobic training alone. This suggests a role
79
for exercise modality on plasma leptin which may be attributable to the different stimulus provided
80
by resistance and aerobic exercise (Rostas et al., 2017).
81
Commented [D1]: Rigamonti AE, Pincelli AI, Corrà B, et al. Plasma ghrelin concentrations in elderly subjects: comparison with anorexic and obese patients. J Endocrinol. 2002;175:R1–R5.
Commented [D2]: PLoS One. 2017 Aug
15;12(8):e0182801. doi: 10.1371/journal.pone.0182801. eCollection 2017.
In middle-aged and old obese patients, training intervention reduces leptin level: A meta-analysis. Rostás I1, Pótó L1,2, Mátrai P1,2, Hegyi P1,3,4, Tenk J1, Garami A1, Illés A4, Solymár M1, Pétervári E1, Szűcs Á5, Párniczky A6, Pécsi D1, Rumbus Z1, Zsiborás C1, Füredi N1, Balaskó M1.
4 The study of variations in plasma ghrelin is also worth consideration to understand the effects of 82
exercise training in obese individuals. Ghrelin is an orexigenic hormonal messenger that increases in 83
blood before eating and immediately decreases after food consumption (6). Accordingly, Cummings 84
et al. (7) reported an increase in plasma ghrelin in obese individuals subjected to diet-induced weight 85
loss. In response to exercise training, ghrelin was found to be increased when the intensity of the 86
exercise stimulus was low to moderate (24). On the other hand, some evidence indicates that high-87
intensity exercise can reduce plasma ghrelin (2, 30). With age, ghrelin concentration has been found
88
to decrease as well as the ghrelin signaling pathways (Rigamonti et al., 2002). Markofski et al. found
89
that a 12-week aerobic + resistance training was able to increase fasting ghrelin concentrations by
90
47% in 70 years old individuals (Markofski et al., 2014). Interestingly recent results suggest that the
91
effect of exercise training on ghrelin concentration might depend on the volume of exercise, with 4
92
months of moderate dose of aerobic exercise favoring reduced ghrelin while it remained unchanged
93
in response to a low dose training program in old women (Bowyer et al., 2018). 94
Certain studies have examined the impact of exercise on plasma ghrelin in a context where the 95
opposite effect of body weight loss was expected to be significant. For instance, Kim et al. (15) 96
observed that body weight and percent body fat decreased in obese children after a 12-week aerobic 97
and resistance exercise training while total ghrelin increased by 30.4% and acyl ghrelin did not 98
change. Martins et al. (19) found that body weight decreased while plasma acyl ghrelin and appetite 99
increased after 12 weeks of exercise training in sedentary obese women. This is concordant with 100
results reported by Santosa et al. (23) and Zahorska Markiewicz et al. (33). 101
Taken together, these observations show that both leptin and ghrelin contribute to the metabolic 102
regulation underlying the effects of exercise training. In addition, available literature reveals that this 103
regulation can be modified by time, modalities of exercise practice and variations in body fat. From 104
Commented [D3]: Exercise training modifies ghrelin and adiponectin concentrations and is related to inflammation in older adults.
Markofski MM, Carrillo AE, Timmerman KL, Jennings K, Coen PM, Pence BD, Flynn MG.
J Gerontol A Biol Sci Med Sci. 2014 Jun;69(6):675-81.
Commented [D4]: J Behav Med. 2018 Nov 17. doi: 10.1007/s10865-018-9990-z. [Epub ahead of print]
The influence of exercise training dose on fasting acylated ghrelin concentration in older women.
5 a clinical standpoint, this observation has significant potential implications for obesity management 105
that deserve further investigations. In the present study, we report relevant data collected in the 106
RESOLVE Study (9) to document the impact of high-intensity resistance and endurance training 107
combined with dietary guidelines on plasma leptin and ghrelin in overweight individuals tested at 108
different time intervals over a 12-month intervention. 109
Methods 110
Subjects
111
A sample of 100 individuals (44 men, 56 women) were recruited to participate in this study via 112
advertisement. As previously described (9), the following inclusion criteria had to be respected to 113
permit eligibility: aged between 50 and 70 years, having a diagnosis of metabolic syndrome (METs) 114
(1), being overweight and sedentary, having maintained a stable body weight and medical treatment 115
over the last 6 months, to be post-menopausal for women, not to have restricted diet over the previous 116
year and to have completed a satisfactory VO2max test. Additionally, the participants had to be
117
exempt from some diseases having the potential to interfere with the metabolic outcome of this study 118
(9). All subjects gave their written consent to participate in the protocol. 119
Design
120
This study is part of the larger RESOLVE project that is a clinical trial designed to investigate the 121
effects of a lifestyle intervention combining exercise and nutritional diet in individuals with metabolic 122
syndrome. The full experimental design, population recruitment procedure, eligibility criteria, 123
measurements as well as compliance and drop-out rates have been previously reported (5, 9, 31). 124
Briefly, all participants underwent a comprehensive medical screening procedure to ensure their 125
ability to complete the entire protocol. Eligible subjects were free from clinical signs of heart failure, 126
coronary artery disease, previous cerebrovascular events, atrial fibrillation and congenital heart 127
6 disease and were not using medication altering body weight or had not been on any restrictive diets 128
in the previous year. The participants were randomly assigned to one of the three exercise 129
interventions differing from each other by the relative intensity of resistance (R) and endurance (E) 130
sessions (with stratification according to age, sex and body mass index), for 3 weeks: i) Condition Re 131
was a high resistance-moderate endurance exercise whose modalities imposed 10 repetitions at 70% 132
of 1 maximal repetition and 30% VO2 peak for endurance exercise; ii) Condition rE was performed
133
at moderate resistance (30%) and high endurance (70%) intensity; iii) Condition re was the reference 134
condition with both resistance and endurance exercise being performed at 30% maximal reference 135
values. It is important to note that evaluators were blinded relative to the condition being assigned to 136
each subject. For the following 12 months, the participants were all requested to maintain the same 137
training program individually while relying on guidelines and exercise prescription that they had 138
received in Phase 1. 139
Anthropometric measurements, body composition (DXA), blood samples, clinical and physical 140
assessments, daily food intake (3-day food diary) and various health-related questionnaires, were 141
performed at baseline (D0), after the 3-week intervention (D21), 3, 6 and 12 months after (M3, M6 142
and M12). The study was approved by the human ethics committee from the University Hospital of 143
Saint-Etienne, France. The intervention was registered with the American National Institutes of 144
Health database: No. NCT00917917. 145
Measurements
146
Anthropometric measurements and body composition
147
The participants weight and height was recorded while wearing light clothes and standing bare-148
footed, using a digital scale and a standard wall-mounted stadiometer respectively. BMI was 149
calculated as weight (kg) divided by height squared (m²). Waist circumference was measured at 150
7 midpoint between sub-costal and supra-iliac landmarks (21). Fat mass (FM) and fat-free mass (FFM) 151
were assessed by dual-energy X-ray absorptiometry (DXA) following standardized procedures 152
(QDR4500A scanner, Hologic, Waltham, MA, USA). 153
Daily energy intake.
154
Participants were asked to complete a 3-day dietary recall that was explained and detailed to them by 155
a member of the investigation team (including 2 week-days and 1 weekend day). The participants 156
were asked to indicate as precisely as possible all the details regarding the food ingested at each meal 157
and in-between meals. During their first visit, a specialized dietitian detailed the diary and the 158
methodology used to fill it in to the participants and the diaries were reviewed afterward with the 159
participants and the dietitian during a 45 minutes interview. The records have been analyzed by a 160
trained dietitian using the NutriLog software (Nutrilog SAS, Paris, France). 161
162
Blood samples
163
Fasting blood samples were drawn between 7.00 and 7.30 a.m. by an experienced nurse, aliquoted 164
and stored at -80°C until analysis. Basic biological assays were performed in the biochemistry 165
laboratory of the University Hospital of Clermont-Ferrand, France. Total ghrelin and leptin were 166
assayed by ELISA using commercial kits (Millipore, Billerica, MA, USA). Sensitivity, intra- and 167
interassay coefficients of variation were respectively 30 pg/ml, 1.1% and 6.9% for total ghrelin and 168
0.16 ng/ml, 5.1% and 7.4% for leptin. 169
Detailed lifestyle intervention
170
As previously described by Dutheil et al. (9), the protocol for each condition was divided in two 171
phases: 172
8 Phase 1: This phase elapsed over 3 weeks during which participants stayed in a residential 173
establishment where their exercise program and food intake were supervised. In each condition, 174
participants had to perform 15-20 hours of exercise per week that included 90 minutes of daily aerobic 175
exercise plus four 90 minute weekly resistance exercise sessions. As indicated above, the conditions 176
differed by the relative intensity of either resistance or endurance exercise. A Polar S810 system was 177
used to record and store heart rate values. Endurance training included aquagym, cycling and walking 178
whereas resistance training was based on 8 exercises with free weights and traditional muscular 179
development equipment. For each exercise, participants had to perform 3 series of 10 repetitions. 180
Maximal test were realized at baseline to determine the individual acapcities of each participants. 181
Regarding the resistance intervention, tests were realized for each of the selected exercises in order 182
to determine the participants 10RM (maximal 10 repetitions). The training intensity increased from 183
65% to 85% of 10 maximal repetitions for Re, whereas rE and re remained at 30% of 10 maximal 184
repetitions.Resistance training was done 4 times a week and consisted of 15 min warm-up followed 185
by height exercises with free weights and traditional muscle building equipment. Exercises were high 186
pulley machine (lower back), seated row (upper back and trapezius), bench press (chest), chest fly 187
(chest), squat press (legs), leg extension machine (quadriceps), dumbbell curl (biceps brachial), 188
triceps pushdown on high pulley (triceps brachial). Each exercise was performed for three sets of 10 189
repetitions with 1 min rest interval A VO2peak test was also realized by each participants at baseline. 190
Intensity of the endurance sessions increased gradually from 40 to 75% of VO2max from week 1 to 191
week 3 for rE, whereas Re and re remained at 30% of VO2max. Throughout the residential program, 192
participants received both standard and personalized meals prescribed by dietitians. Protein intake 193
was set at 1.2 g/kg body weight/d and accounted for 15-20% daily energy intake. Lipid and 194
carbohydrate intake provided 30-35 and 45-55% daily energy intake, respectively. Total daily energy 195
intake was calculated to promote a 500 kcal daily negative energy balance. 196
9 Phase 2: This phase covered the remaining part of the one-year intervention, i.e. between Day 21 197
(D21) and the end of Month 12. During this period, participants were requested to maintain the same 198
training program individually while relying on guidelines and exercise prescription that they had 199
received in Phase 1. They were met by the exercise coach and the dietitian at months 3, 6, and 12 200
(M3, M6, M12). As previously described (9), a compliance score was determined on the basis of the 201
number of food questionnaires returned (score from 0 to 12 i.e. 12 = 100%) and the number of training 202
sessions undertaken per week (score from 0 to 4, i.e. 4 = 100%). The overall compliance score was 203
the mean of these two scores (nutrition and physical activity). 204
Statistical analysis
205
Statistical analyses were carried out using the statistical software Stata (version 13, StataCorp, 206
College Station, US). All statistical tests were conducted for a two-sided type I error at 0.05. 207
Continuous variables were described as mean and standard-deviation, according to statistical 208
distribution (assumption of normality studied using Shapiro-Wilk test). Repeated correlated data were 209
analyzed using random-effects models to study fixed effects group (Re, rE, re), time-point evaluation 210
(baseline, D21, M3, M6, M12) and their interactions taking into account between and within subject 211
variability (as random-effect). A Sidak’s type I error correction was applied to take into account the 212
multiple comparisons. Where appropriate, the normality of residuals was studied using Shapiro-Wilk 213
test. If necessary, a logarithmic transformation was proposed to achieve the normality of dependent 214
outcome. Furthermore, to determine if the treatment effects on plasma leptin and ghrelin were 215
independent from variations in BMI, lean and fat mass, multivariable random-effects models were 216
performed with these variations as covariates. Concerning non-repeated data, the following statistical 217
tests were performed: Student t-test or Mann-Whitney test if conditions of t-test were not met 218
(normality studied using Shapiro-Wilk and assumption of homoscedasticity verified by Fisher-219
10 Snedecor test). All enrolled participants were included in the analysis. However, a sensitivity analyses 220
provided similar results with completers only analysis. 221
Results 222
On the initially 100 recruited participants, 91 completed the first phase of the protocol (n=30Re; 223
n=28rE; n=33re) and 78 completed the entire study, phase 1 and 2 (n=24Re; n=24rE; n=30re). This 224
Figure 1 presents the flow-chart of the entire study. During phase 2, the mean compliance scores were 225
54.6 ± 22.1% for Re, 52.7 ± 26.1% for rE, and 52.1 ± 18.1% for re, and did not differ between MetS 226
groups. 227
11 229
Figure 1. Flow-chart of the entire study. D0: Day 0; D21: Day 21; M3: Month 3; M6: Month 6; M12: Month 12; 230
Re: Resistance+endurance; rE: resistance+Endurance; re: resistance+endurance. 231
232
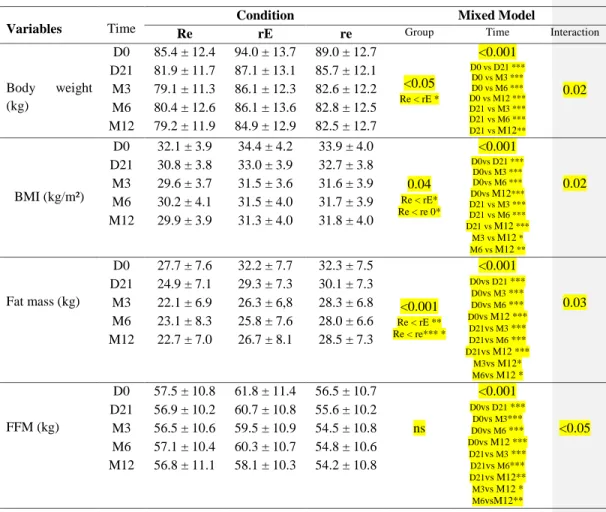
Variations in body weight and composition throughout the protocol are presented in Table 1. As 233
expected, there was a significant decrease in body weight, fat mass and fat-free mass during Phase 1 234
while physical activity and food intake were closely supervised (p<0.001). From a quantitative 235
standpoint, the mean fat mass loss during this period was about 3 kg, 3 kg and 2 kg in response to the 236
12 Re, rE and re conditions, respectively. Thus, its energy equivalent (9,300 kcal/kg) means that the 237
negative energy balance during Phase 1 largely exceeded the 500 kcal daily energy deficit that was 238
targeted at baseline. 239
Table 1 also shows that body fat loss continued in Phase 2 up to M3 (p<0.001). Specifically, the fat 240
loss of 2-3 kg that was achieved over the 70 days elapsing between the end of Phase 1 (D21) and 241
Month 3 was equivalent to a mean daily energy deficit of about 300 kcal/day. Beyond M3, 242
fluctuations of fat mass were small and no net noticeable additional fat loss was observed up to the 243
end of the protocol at M12. 244
As indicated, fat-free mass also decreased during the protocol (Table 1) (p<0.001). However, it is 245
noteworthy to emphasize that fat-free mass preservation was almost entirely achieved during the 246
whole protocol in the Re condition. 247
13 249
Table 1. Body weight and composition at different times during the protocol. 250
Variables Time
Condition Mixed Model
Re rE re Group Time Interaction
Body weight (kg) D0 85.4 ± 12.4 94.0 ± 13.7 89.0 ± 12.7 <0.05 Re < rE * <0.001 D0 vs D21 *** D0 vs M3 *** D0 vs M6 *** D0 vs M12 *** D21 vs M3 *** D21 vs M6 *** D21 vs M12** 0.02 D21 81.9 ± 11.7 87.1 ± 13.1 85.7 ± 12.1 M3 79.1 ± 11.3 86.1 ± 12.3 82.6 ± 12.2 M6 80.4 ± 12.6 86.1 ± 13.6 82.8 ± 12.5 M12 79.2 ± 11.9 84.9 ± 12.9 82.5 ± 12.7 BMI (kg/m²) D0 32.1 ± 3.9 34.4 ± 4.2 33.9 ± 4.0 0.04 Re < rE* Re < re 0* <0.001 D0vs D21 *** D0vs M3 *** D0vs M6 *** D0vs M12*** D21 vs M3 *** D21 vs M6 *** D21 vs M12 *** M3 vs M12 * M6 vs M12 ** D21 30.8 ± 3.8 33.0 ± 3.9 32.7 ± 3.8 M3 29.6 ± 3.7 31.5 ± 3.6 31.6 ± 3.9 0.02 M6 30.2 ± 4.1 31.5 ± 4.0 31.7 ± 3.9 M12 29.9 ± 3.9 31.3 ± 4.0 31.8 ± 4.0 Fat mass (kg) D0 27.7 ± 7.6 32.2 ± 7.7 32.3 ± 7.5 <0.001 Re < rE ** Re < re*** * <0.001 D0vs D21 *** D0vs M3 *** D0vs M6 *** D0vs M12 *** D21vs M3 *** D21vs M6 *** D21vs M12 *** M3vs M12* M6vs M12 * D21 24.9 ± 7.1 29.3 ± 7.3 30.1 ± 7.3 M3 22.1 ± 6.9 26.3 ± 6,8 28.3 ± 6.8 0.03 M6 23.1 ± 8.3 25.8 ± 7.6 28.0 ± 6.6 M12 22.7 ± 7.0 26.7 ± 8.1 28.5 ± 7.3 FFM (kg) D0 57.5 ± 10.8 61.8 ± 11.4 56.5 ± 10.7 <0.001 D0vs D21 *** D0vs M3*** D0vs M6 *** D0vs M12 *** D21vs M3 *** D21vs M6*** D21vs M12** M3vs M12 * M6vsM12** D21 56.9 ± 10.2 60.7 ± 10.8 55.6 ± 10.2 M3 56.5 ± 10.6 59.5 ± 10.9 54.5 ± 10.8 ns <0.05 M6 57.1 ± 10.4 60.3 ± 10.7 54.8 ± 10.6 M12 56.8 ± 11.1 58.1 ± 10.3 54.2 ± 10.8
Values are means ± SD, D0, D21, M3, M6, and M12 refer to Day 0, Day 21, Month 3, Month 6, and Month 12, respectively; Re: 251
Resistance+endurance; rE: resistance+Endurance; re: resistance+endurance. *p<0.05; **p<0.01; ***p<0.001. 252
253
Our analysis revealed a significant time effect (p<0.001) for daily energy intake with EI being 254
significantly higher at D0 compared with the other time points (D21 to M12) without any difference 255
between the other time points (D21 to M12). Although the analysis also shows a group effect with EI 256
14 being significantly higher in the re group compared with both Re and rE (p<0.01), there was no group 257
x tome interaction. Variations between time points were not significantly different between groups. 258
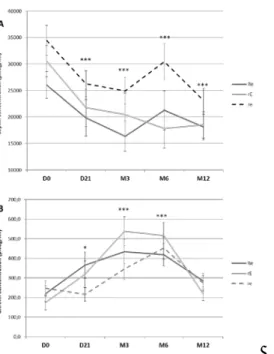
Figure 2 illustrates variations in plasma leptin during the protocol. As expected, there was a 259
considerable decrease in leptinemia during Phase 1 (p<0.001). This decrease continued between Day 260
21 and Month 3 (p<0.001). As for fat mass, there was no apparent clinically significant change in 261
leptinemia between M3 and M12. Variations in plasma ghrelin were also concordant with those of 262
energy balance up to M3 (Figure 2). Indeed, according to the literature cited above, the negative 263
energy balance that was imposed at the beginning of the protocol resulted in a significant increase in 264
plasma ghrelin at D21 and M3 compared to baseline values (p<0.001). The Leptin/ghrelin ration was 265
found significantly decreased at D21, M3, M6 and M12 compared with D0 in the rE and Re groups 266
(with no difference between D21, M3, M6 and M12) (p<0.01) but remained unchanged in the re 267
group. 268
15 270
Figure 2. Plasma leptin (A) and ghrelin (B) concentrations before (D0) and after Phase 1 (D21) and 271
after 3 (M3), 6 (M6) and 12 (M12) months (Phase 2) for the three treatment conditions: Resistance 272
+ endurance (Re), resistance + Endurance (rE), resistance + endurance (re) 273
Values are means ± SEM; *** p<0.001 compared with D0; * p<0.05 compared with D0. 274
275
However, contrary to other variables documented in this paper which reached a plateau at M3, there 276
was a substantial decrease in ghrelinemia between M6 and M12 in each condition (Figure 1) to a 277
level comparable to baseline values. 278
Discussion 279
The main objective of this study was to investigate the impact of different modalities of physical 280
activity practice differing by the intensity of the exercise in combination with diet guidelines stimulus 281
on body composition and some appetite-related hormones in overweight individuals. A particularity 282
of the protocol was its implementation during 3 weeks of close in-house exercise and diet supervision 283
16 that were followed by a second phase up to 12 months during which participants had to manage the 284
program individually. The beginning of the intervention in a controlled residential context promoted 285
a greater than initially expected energy deficit that was slightly more pronounced in response to high 286
intensity resistance or endurance exercise. After 3 weeks, once participants had the responsibility to 287
manage their exercise practice by themselves, daily energy balance and fat loss were reduced up to 3 288
months from which no further clinically significant morphological changes were observed up to the 289
end of the program. This apparent inability to further lose body fat after 3 months was accompanied 290
by substantial opposite changes in leptinemia which decreased, and ghrelinemia which increased in 291
response to fat loss. However, as further discussed in this section, a considerable decrease in plasma 292
ghrelin was observed between 6 and 12 months of follow-up when body weight and fat were relatively 293
stable. 294
Cross-sectional observations showed that vigorous physical activity is associated with reduced body 295
fatness, independently of the energy cost of activities (27). This has been corroborated by intervention 296
studies demonstrating that high intensity exercise accentuates body fat loss while increasing skeletal 297
muscle oxidative potential (3, 29). These observations are also concordant with results obtained in 298
standardized laboratory experiments indicating that calorie for calorie, high intensity exercise 299
influences global energy balance via postexercise adaptations in energy intake, appetite and resting 300
metabolic rate (14, 16, 32). From a clinical standpoint, these findings have contributed to the 301
dissemination of guidelines to exercise specialists focussing on the relevance to prescribe vigorous 302
physical activities as part of fitness programs. However, with respect to the management of excess 303
weight, these studies have not documented the issue as to "how much additional body fat loss" could 304
be achieved with high intensity physical activity in weight-reduced overweight individuals before the 305
occurrence of resistance to further lose body fat. In this regard, the methodology of the present study 306
contributed to answer this question by comparing the response of body fat over time in overweight 307
17 people subjected to different modalities of exercise practice. The results showed that when high 308
intensity exercise was included in the program, be it focussed on resistance or aerobic exercise, mean 309
body fat loss was accentuated by 1.5 to 2.0 kg before the achievement of a body weight plateau. This 310
reinforces the relevance to include vigorous physical activity in fitness programs provided that the 311
exercise stimulus is compatible with the health status of individuals. Our results moreover reinforce 312
the effect of high intensity exercise since our three groups responded similarly to the interventions in 313
terms of energy intake. 314
The findings outlined in the present study also reveal that irrespective to modalities of physical 315
activity practice, a body weight plateau is ultimately reached after some months of participation in a 316
program based on exercise and healthy eating, and as indicated above, this happened after 3 months 317
of intervention in our subjects. Interestingly, this was accompanied by a statistically significant and 318
quantitatively important decrease in plasma leptin, which is concordant with previously reported 319
variations in leptin (4). This is in agreement with many studies having demonstrated that a weight-320
reducing program favors a decrease in plasma leptin, which is related to decreased thermogenesis (8, 321
28) as well as an increase in hunger sensations (17). This is also concordant with the demonstration 322
that leptin administration in weight-reduced obese individuals reverses these leptin-related changes 323
in thermogenesis and appetite (17). 324
The orexigenic hormone ghrelin has been shown to increase previously with weight loss in the 325
participants in other studies (7, 15, 19). This change represents a normal response which, together 326
with the decrease in plasma leptin, promotes body energy preservation in a context of energy 327
restriction. However, contrary to leptin which remained relatively stable when body weight had 328
stabilized after 3 months during the experimental protocol, a pronounced decrease in plasma ghrelin 329
was noted in each condition at the end of the study. Indeed, as depicted in Figure 2, plasma ghrelin 330
18 had then returned to values comparable to baseline levels when body weight and fat remained much 331
lower than their initial level. This unexpected finding may suggest that long-term physical activity 332
practice results in hormonal adaptations that facilitate over time the maintenance of reduced body 333
weight. Obviously, this hypothesis proposing that appetite control in the active person might be 334
facilitated on the long-term because a decrease in ghrelin deserves experimental confirmation. If 335
confirmed, this effect on ghrelin could provide a mechanistic explanation of the recognized benefit 336
of exercise to facilitate body weight/fat maintenance in weight-reduced obese individuals (10, 20, 337
26). Interestingly, our results also show a reduced Leptin/Ghrelin ration in response to the two 338
intensive interventions (Re and rE) but not in response to the re one. Although further research is 339
needed regarding the effect of exercise on this ratio, this is of importance since it might suggest that 340
intensive exercise might prevent patient for future weight regain compare to ow intensity 341
interventions. Indeed, as previously showed, a higher fasting L/G ratio has been found associated 342
with post-weight loss weight regain in overweight and patients with obesity (Crujeiras et al., 2014). 343
The present study has some strengths and limitations that are worthy of consideration. Among the 344
strengths, it is relevant to emphasize the duration of the protocol that was sufficiently long to permit 345
the occurrence of resistance to further lose body fat and to examine its related hormonal changes. The 346
high volume of training on Phase 1 composes an originality of the intervention made possible by the 347
residential nature of the program and the continuous presence of professionals. It remains however 348
hardly transferable in free-living condition as illustrated by the compliance results observed during 349
phase 2. This self-management of exercise guideline in Phase 2 might also represent a strength of this 350
study because of a better representativeness of what would happen under free-living conditions. With 351
respect to hormonal determinations, it is possible that, as described in the introduction of this paper, 352
the measurement of the active form of ghrelin would have contributed to a more thorough 353
documentation of the hormonal impact of our exercise intervention. However, it is unlikely that the 354
Commented [D7]: Pre-treatment circulating leptin/ghrelin ratio as a non-invasive marker to identify patients likely to regain the lost weight after an energy restriction treatment.
Crujeiras AB, Díaz-Lagares A, Abete I, Goyenechea E, Amil M, Martínez JA, Casanueva FF.
19 pronounced decrease in ghrelin that was found at the end of the study would not have been also seen 355
for acyl ghrelin. Another limitation is the use of self-reported dietary recall that might have led to 356
some underreported results which must be considered when interpreting the present results. 357
In summary, this study showed that increasing exercise intensity in an intervention combining 358
physical activity and diet guidelines promotes an accentuation of fat mass loss before body weight 359
reaches a new plateau in a reduced obese state. This occurrence of resistance exercise to lose fat was 360
associated with a decrease in plasma leptin and an increase in plasma ghrelin. Unexpectedly, ghrelin 361
almost returned to baseline values after several months of body weight stabilization. Further research 362
is needed to determine if this hormonal adaptation represents a long-term benefit of exercise 363
facilitating appetite control in active weight-reduced obese individuals. 364
365
Acknowledgements 366
This work was supported by PRES Blaise Pascal University – Clermont II – Laboratory AME2P 367
Metabolic Adaptations to Exercise in Physiological and Pathological conditions, and by the thermal 368
baths of Chatel-Guyon and Omental association. We would like to thank Sarah de Saint Vincent from 369
the Institut de Medecine du Travail (Institute of Occupational Medicine, Faculty of Medicine, 370
Clermont-Ferrand, France) for her help to assess biomarkers using ELISA technology. We also would 371
like to thank the dietitians of the RESOLVE trial: Carole Gravière and Aurélie Moreira. 372
Fundings 373
This work was funded by the Fondation Coeur et Artères 59200 Loos, France; www.fondacoeur.com. 374
The funding source had no role in the design, conduct, or reporting of the study. 375
20 References
377
1. Alberti KG, Zimmet P, Shaw J, and Group IDFETFC. The metabolic syndrome--a new 378
worldwide definition. Lancet 366: 1059-1062, 2005. 379
2. Broom DR, Stensel DJ, Bishop NC, Burns SF, and Miyashita M. Exercise-induced 380
suppression of acylated ghrelin in humans. Journal of applied physiology 102: 2165-2171, 2007. 381
3. Bryner RW, Toffle RC, Ullrich IH, and Yeater RA. The effects of exercise intensity on body 382
composition, weight loss, and dietary composition in women. Journal of the American College 383
of Nutrition 16: 68-73, 1997. 384
4. Considine RV, Sinha MK, Heiman ML, Kriauciunas A, Stephens TW, Nyce MR, 385
Ohannesian JP, Marco CC, McKee LJ, Bauer TL, and et al. Serum immunoreactive-leptin 386
concentrations in normal-weight and obese humans. The New England journal of medicine 334: 387
292-295, 1996. 388
5. Crendal E, Walther G, Vinet A, Dutheil F, Naughton G, Lesourd B, Chapier R, Rupp T, 389
Courteix D, and Obert P. Myocardial deformation and twist mechanics in adults with metabolic 390
syndrome: impact of cumulative metabolic burden. Obesity 21: E679-686, 2013. 391
6. Cummings DE, Purnell JQ, Frayo RS, Schmidova K, Wisse BE, and Weigle DS. A 392
preprandial rise in plasma ghrelin levels suggests a role in meal initiation in humans. Diabetes 393
50: 1714-1719, 2001. 394
7. Cummings DE, Weigle DS, Frayo RS, Breen PA, Ma MK, Dellinger EP, and Purnell JQ. 395
Plasma ghrelin levels after diet-induced weight loss or gastric bypass surgery. The New England 396
journal of medicine 346: 1623-1630, 2002. 397
21 8. Doucet E, St Pierre S, Almeras N, Mauriege P, Richard D, and Tremblay A. Changes in 398
energy expenditure and substrate oxidation resulting from weight loss in obese men and women: 399
is there an important contribution of leptin? The Journal of clinical endocrinology and 400
metabolism 85: 1550-1556, 2000. 401
9. Dutheil F, Lac G, Lesourd B, Chapier R, Walther G, Vinet A, Sapin V, Verney J, 402
Ouchchane L, Duclos M, Obert P, and Courteix D. Different modalities of exercise to reduce 403
visceral fat mass and cardiovascular risk in metabolic syndrome: the RESOLVE randomized 404
trial. International journal of cardiology 168: 3634-3642, 2013. 405
10. Ewbank PP, Darga LL, and Lucas CP. Physical activity as a predictor of weight maintenance 406
in previously obese subjects. Obes Res 3: 257-263, 1995. 407
11. Halaas JL, Gajiwala KS, Maffei M, Cohen SL, Chait BT, Rabinowitz D, Lallone RL, Burley 408
SK, and Friedman JM. Weight-reducing effects of the plasma protein encoded by the obese 409
gene. Science 269: 543-546, 1995. 410
12. Hickey MS, Considine RV, Israel RG, Mahar TL, McCammon MR, Tyndall GL, Houmard 411
JA, and Caro JF. Leptin is related to body fat content in male distance runners. The American 412
journal of physiology 271: E938-940, 1996. 413
13. Hickey MS, Houmard JA, Considine RV, Tyndall GL, Midgette JB, Gavigan KE, Weidner 414
ML, McCammon MR, Israel RG, and Caro JF. Gender-dependent effects of exercise training 415
on serum leptin levels in humans. The American journal of physiology 272: E562-566, 1997. 416
14. Imbeault P, Saint-Pierre S, Almeras N, and Tremblay A. Acute effects of exercise on energy 417
intake and feeding behaviour. Br J Nutr 77: 511-521, 1997. 418
22 15. Kim HJ, Lee S, Kim TW, Kim HH, Jeon TY, Yoon YS, Oh SW, Kwak H, and Lee JG. 419
Effects of exercise-induced weight loss on acylated and unacylated ghrelin in overweight 420
children. Clinical endocrinology 68: 416-422, 2008. 421
16. King NA, Burley VJ, and Blundell JE. Exercise-induced suppression of appetite: effects on 422
food intake and implications for energy balance. Eur J Clin Nutr 48: 715-724, 1994. 423
17. Kissileff HR, Thornton JC, Torres MI, Pavlovich K, Mayer LS, Kalari V, Leibel RL, and 424
Rosenbaum M. Leptin reverses declines in satiation in weight-reduced obese humans. Am J Clin 425
Nutr 95: 309-317, 2012. 426
18. Maffei M, Halaas J, Ravussin E, Pratley RE, Lee GH, Zhang Y, Fei H, Kim S, Lallone R, 427
Ranganathan S, and et al. Leptin levels in human and rodent: measurement of plasma leptin 428
and ob RNA in obese and weight-reduced subjects. Nature medicine 1: 1155-1161, 1995. 429
19. Martins MR, Doin FC, Komatsu WR, Barros-Neto TL, Moises VA, and Abucham J. 430
Growth hormone replacement improves thyroxine biological effects: implications for 431
management of central hypothyroidism. The Journal of clinical endocrinology and metabolism 432
92: 4144-4153, 2007. 433
20. McGuire MT, Wing RR, Klem ML, Seagle HM, and Hill JO. Long-term maintenance of 434
weight loss: do people who lose weight through various weight loss methods use different 435
behaviors to maintain their weight? Int J Obes Relat Metab Disord 22: 572-577, 1998. 436
21. Organization WH. Obesity: preventing and managing the global epidemic. In: WHO Technical 437
Report Series 894, edited by consultation RoaW. Geneva, 2000. 438
23 22. Pasman WJ, Westerterp-Plantenga MS, and Saris WH. The effect of exercise training on 439
leptin levels in obese males. The American journal of physiology 274: E280-286, 1998. 440
23. Santosa S, Demonty I, Lichtenstein AH, Cianflone K, and Jones PJ. An investigation of 441
hormone and lipid associations after weight loss in women. Journal of the American College of 442
Nutrition 26: 250-258, 2007. 443
24. Tiryaki-Sonmez G, Vatansever S, Olcucu B, and Schoenfeld B. Obesity, food intake and 444
exercise: Relationship with ghrelin. Biomedical Human Kinetics 7: 116-124, 2015. 445
25. Tremblay A, Coveney S, Despres JP, Nadeau A, and Prud'homme D. Increased resting 446
metabolic rate and lipid oxidation in exercise-trained individuals: evidence for a role of beta-447
adrenergic stimulation. Canadian journal of physiology and pharmacology 70: 1342-1347, 1992. 448
26. Tremblay A, Despres JP, and Bouchard C. Adipose tissue characteristics of ex-obese long-449
distance runners. Int J Obes 8: 641-648, 1984. 450
27. Tremblay A, Despres JP, Leblanc C, Craig CL, Ferris B, Stephens T, and Bouchard C. 451
Effect of intensity of physical activity on body fatness and fat distribution. Am J Clin Nutr 51: 452
153-157, 1990. 453
28. Tremblay A, Pelletier C, Doucet E, and Imbeault P. Thermogenesis and weight loss in obese 454
individuals: a primary association with organochlorine pollution. Int J Obes Relat Metab Disord 455
28: 936-939, 2004. 456
29. Tremblay A, Simoneau JA, and Bouchard C. Impact of exercise intensity on body fatness and 457
skeletal muscle metabolism. Metabolism: clinical and experimental 43: 814-818, 1994. 458
24 30. Vatansever-Ozen S, Tiryaki-Sonmez G, Bugdayci G, and Ozen G. The effects of exercise on 459
food intake and hunger: relationship with acylated ghrelin and leptin. Journal of sports science 460
& medicine 10: 283-291, 2011. 461
31. Vinet A, Obert P, Dutheil F, Diagne L, Chapier R, Lesourd B, Courteix D, and Walther G. 462
Impact of a lifestyle program on vascular insulin resistance in metabolic syndrome subjects: the 463
RESOLVE study. The Journal of clinical endocrinology and metabolism 100: 442-450, 2015. 464
32. Yoshioka M, Doucet E, St-Pierre S, Almeras N, Richard D, Labrie A, Despres JP, Bouchard 465
C, and Tremblay A. Impact of high-intensity exercise on energy expenditure, lipid oxidation 466
and body fatness. Int J Obes Relat Metab Disord 25: 332-339, 2001. 467
33. Zahorska-Markiewicz B, Mizia-Stec K, Olszanecka-Glinianowicz M, and Janowska J. 468
Effect of weight reduction on serum ghrelin and TNFalpha concentrations in obese women. 469
European journal of internal medicine 15: 172-175, 2004. 470
34. Zhang Y, Proenca R, Maffei M, Barone M, Leopold L, and Friedman JM. Positional cloning 471
of the mouse obese gene and its human homologue. Nature 372: 425-432, 1994. 472