Characterization of the Wetting Behavior of
Place Exchanged Mixed-Monolayer-Protected
Gold Nanoparticles
by
St. Julien Palmer Rosemond III
MASSACHUSETTS INST E
OF TECHNOLOGY
FEB 0 8 2010
LIBRARIES
Submitted to the Department of Materials Science and Engineering in partial
fulfillment of the requirements for the degree of
Bachelor of Science
at the
MASSACHUSETTS INSTITUTE OF TECHNOLOGY
May 2009
@
Massachusetts Institute of Technology 2009. All rights reserved.
Author....
...
Department of Materials Science and Engineering
k/
May
8,
2009
Certified by... ...
Francesco Stellacci
Associate Professor of Materials Science and Engineering
Accepted by ...
... .
...
Lionel C. Kimerling
Professor of Materials Science and Engineering
Chair, Undergraduate Committee
Characterization of the Wetting Behavior of
Place Exchanged Mixed-Monolayer-Protected
Gold Nanoparticles
by
St. Julien Palmer Rosemond III
Submitted to the Department of Materials Science and Engineering
on May 8, 2009, in partial fulfillment of the
requirements for the degree of
Bachelor of Science
Abstract
Mixed-monolayer-protected gold nanoparticles have been shown to have self assembling ligand shells.
Given certain ligand concentrations, the NP shell can spontaneously form complex ordered domains with
domain spacing as small as five angstroms. It has been proven that the solubility of NPs synthesized
using a one step method is almost solely dependent on the corresponding ligand shell morphology. We
have attempted to get a better understanding of the morphological differences between NPs synthesized
in one step and those synthesized through place exchange by comparing their solubility characteristics.
Both types NPs were functionalized using different concentrations two immiscible ligands. The place
exchanged NPs almost certainly form a type of ripple shell morphology due to the presence of
non-monotonic solubility peaks in polar solvents at low hydrophilic ligand concentrations. Based on the
solubility results, we conclude that the ligand shell morphology must be different for place exchanged
and one step nanoparticles. The differences are most likely due to the mechanism by which place
exchange populates the nanoparticles.
Table of Contents
Title Page
Abstract
Table of Contents
List of Figures
List of Tables
Chapter 1. Introduction
Chapter 2. Experimental Section
Chapter 3. Results
Chapter 4. Discussion
Chapter 5. Conclusion & Future Work
Chapter 6. References
Page I
List of Figures
Figure 1. STM image of gold nanoparticles coated with a 2:1 ratio of OT/MPA showing ordered phase
separation in their ligand shell. Source: Stellacci, F et al. The role of nanostructure in the wetting
behavior of mixed-monolayerprotected metal nanoparticles. PNAS vol. 105 no. 29 9886-9891
(2 0 0 8 )...
Figure 2. Plot of the domain spacing versus the M PA fraction used in the one-step synthesis of gold
nanoparticles. Source: Stellacci, Francesco et al. Spontaneous assembly of subnanometer ordered
domains in the ligand shell of monolayer-protected nanoparticles Published online doi:
10.1038/nm at1116 (2004)...
...
...
Figure 3. Plot of the saturation concentrations for OT/M PA N Ps as a function of the ligand shell
composition, for N Ps dissolved in various solvents. Source: Stellacci, F et al. The role of nanostructure
in the wetting behavior of mixed-monolayerprotected metal nanoparticles. PNAS vol. 105 no. 29
9886-9 8 9886-9 1 (2 0 0 8 )...
...
Figure 4 TEM image of OT coated gold nanoparticles after Stucky synthesis...
Figure 5. TGA (Thermogravimetric Analysis) of OT coated gold nanoparticles...
Figure 6. Plot of the concentration of place exchanged OT/M PA coated gold nanoparticles varying
w ith % M PA in ethanol...
...
Figure 7. Plot of the concentration of place exchanged OT/MPA coated gold nanoparticles varying with
% M PA in m ethanol ... ... ...
...
Figure 8. Plot of the concentration of place exchanged OT/M PA coated gold nanoparticles varying with
% M PA in D M S O ...
Figure 9. Plot of the concentration of place exchanged OT/M PA coated gold nanoparticles varying with
% M PA in DM
SO
with data outliers rem oved...
List of Tables
Table
1.
Equilibrium Results for Place-Exchange Reactions between Cluster Ligands and Solution
Thiols Source: Murray, W. et al. Dynamics of Place-Exchange Reactions on Monolayer-Protected Gold
Cluster Molecules. Langmuir 15, 3782-3789 (1999)...
1. Introduction
Over the course of history humans have continually been trying to improve their lives through the advancement of technology. Research is continuing to show promising technological advancements on the nanoscale. Metals can be made vastly stronger by manipulating nanoscale grains (1). Carbon nanotubes can act as metals, semiconductors, and insulators through nanoscale manipulation (2). Gold nanoparticles (NPs) are currently very popular and have tremendous potential applications in fields as distinct as electronics and biology.
Gold NPs are generally less than 10 nm in diameter and can be synthesized using specific types of metallic reduction. There are currently a few ways to synthesize NPs of such a small diameter. The challenge is centered on creating NPs of that size with a uniform diameter on a large scale (1 g). The Brust method has been shown to create NPs with a desirable average diameter. However, the NPs typically have wide diameter distributions between 1 and 4 nm (3, 4). Another form of NP synthesis using principles from the solvated metal atom dispersion technique has yielded NPs in gram quantities
(5,6) but post-heat treatment is required in order to maintain a narrow diameter distribution (7). Alternative one-phase syntheses have been proposed where metallic reduction occurs in an organic solvent (8-11). A breakthrough was made by Galen Stucky. The aptly named Stucky synthesis has been able to produce monodisperce metallic NPs with a narrow size range using the simple one-phase method (7). The synthesis uses amine-borane complexes as reducing agents due to their weaker reducing ability which causes the gold cations to reduce at a slower rate. The decreased reduction rate allows the experimenter to have unprecedented control of the NP growth. Furthermore, strong thiol ligands are used as capping agents to create a thermodynamically metastable state ensuring a tight size distribution.
2
Metal NPs coated with a chemisorbed layer of organic ligands are relatively new materials classified as monolayer-protected metal nanoparticles (MPMN) (12-14). The ligand shell is essentially a self-assembled monolayer (SAM) that can provide the NP with the properties of the SAM (15) such as specific surface energies (16) and opto-electronic behavior (17). MPMN's can easily be synthesized with a mixed SAM shell (SAM made up of two different ligands) using a variety of methods (18-20). MPMN's made up of a mixture of ligands have been found to have subnanometer-order domains in the ligand shell (21). Furthermore, mixed MPMN's composed of both hydrophilic and hydrophobic ligands have
been show to have phase -separated ordered domains with an unprecedented average domain size as small as 5 angstroms in certain cases (21). The domains appear to circle the NP and form rings creating what is called a ripple shell morphology. Figure 1 illustrates the ripple shell morphology of certain MPMNs.
Figure 1: (26) STM image of gold nanoparticles coated with a 2:1 ratio of OT/MPA showing ordered phase
separation in their ligand shell. (Scale bar, 25 nm.) (Insets) Close up of nanoparticles showing the encircling, ribbon-like domains (Left) and a corresponding simplified schematic diagram in which the red pillars represent MPA, and the yellow represent OT (Right). (Scale bar, 5 nm.)
Having so much control over the ligand shell is extremely desirable because the shell determines the solubility and stability of the NP (22-24). The domain shape, height differences and spacing dimensions
of the ligands (the ligand ratio) during a one-step synthesis. Impressively, given a constant core diameter the peak-to-peak spacing between domains in the ligand shell can be increased in discrete increments of
roughly 3 angstroms (21). Variations in the ligand ratio were also shown to affect the global domain morphology. Mixed MPMNs have been created with shell morphologies ranging from perfect ripples to defect-rich ripples and discrete domains based on their ligand composition (21). Figure 2 demonstrates the variability of domain spacing as a function of ligand ratio. Given the subnanometer complexity of the ligand shell, it is not surprising that these particles interact strangely with other molecules. For example rippled or domained mixed MPMNs do not allow protein adsorbtion (21) and can freely pass through cell membrances (25) due to the minute size the hydrophilic and hydrophobic domains. The morphology of the shell also seems to have an interesting effect on solubility.
12 1 4
[
. . 1 : 121 13 5 V2 0 0! 0.2 0.3 3.4 _D C. 0.7 0.8 Pj'IrP1A-07,Figure 2: (21) Plot of the domain spacing versus the MPA fraction used in the one-step synthesis of gold
nanoparticles. All of the nanoparticles had an average diameter of 3.7 nm. The fact that a variation in the spacing is observed points to a molecularly driven mechanism for the size control of the ripples and not to a metal-directed one. The schematic drawings of the particles are meant to help visualize a possible molecular origin of the discreteness and the trend in the spacing of the domains.
--- I I -A ... ... .. "I Vill 44 41'%*"0 It N N
Domain morphology appears to be the determining factor for mixed MPMN solubility in organic solvents (26). While it has been found that the main stabilization mechanism for NP solubility in polar solvents has been due to the formation of an electric double layer (27-30) the thermodynamic
stabilization mechanism for organic solvents is still not fully understood. However, it has been shown that the enthalpy of mixing for mixed ligand nanoparticles is not the average of the enthalpy of mixing the homoligand nanoparticles weighted over the composition ligand shell (26). This paradox refutes the idea that the solvent is responsible for the entropy of mixing (31). It has also been shown that NP's of coated with octanethiol (OT) and mercaptopropionic acid (MPA) ligands in varying molar ratios do not show a monotonic solubility trend in hydrophobic and hydrophilic organic solvents (26). The results are very counter-intuitive. Applying a simple thermodynamic model, one would expect to see a monotonic
increase in solubility for hydrophilic solvents as the percent MPA increases and the opposite in hydrophobic solvents. However, the results show a clear non-monotonic trend for a range of solvents. NPs with the same ripple structure and spacing were synthesized using hexane thiol instead of OT to vary the height of the ripples. The monotonic trend did not change at all confirming the dominating effect of domain structure and spacing (26). The solubility results are shown in figure 3.
The non-monotonic behavior can be explained by the presence of order phase separation occurring within a range of MPA concentrations from 20% to 80% (21, 26, 32). Furthermore, the effect of the ripple domains on the solid-state free energy can be negated due to the lack of interdigitation between ligand shells caused by the presence of charges on the shell surface. The theory was confirmed using differential scanning calorimetry. In addition, the varying solubility characteristics of identical NPs in different solvents shows that solubility is due the lower free energy of the solvated state and not due to the free energy of the solid state which is constant for identical NPs regardless of solvent (26). It has been proposed that ripple domains allow for favorable solvent interactions (wetting) when the specific
5
solvent molecule is of a certain size and chemical functionality that is comparable to that of the NP's ligand shell (26).
All of the previous discussion focuses primarily on NPs created using a one-step method to create a mixed ligand shell. There exists another method called place exchange in which mixed ligand NPs are created in a through a ligand exchange process. Homogenous single ligand NPs must first be created using one of the methods mentioned previously. Different thiolate ligands can be incorporated into the shell by adding them to a solution containing the homogenous single ligand NPs. The incoming thiolate ligands (R'SH) exchange with the bound thiols (RS) in a 1:1 stoichiometric ratio causing the incoming thiolate to become a newly bound thiol (R'S) and the dislodged thiolate to go into solution as a thiol
(RSH). The corresponding equation is shown below (33).
x(R'SH) + (RS)mNP -+ x(RSH) + (RS),-x(R'S)xNP (1)
Currently there is some promise in further controlling the surface morphology through place exchanging ligands onto the surface rather than trying to functionalize both ligands at the same time. Unlike on flat surfaces, gold NPs tend to have a large portion of defect sites that make it easier for
ligands to bind to the NP. While flat surfaces are made up mostly of interior terrace defect sites, most of the defects on gold NPs are consist of edge and vertex sites (33). These sites allow for fast and favorable ligand place exchange in addition to increased mobility. The terrace sites exchange very slowly and have limited mobility. Another important point to consider when performing a place exchange synthesis is the amount of "force" with which one wants to drive the reaction. The "force" is usually controlled by the place exchange ratio. The place exchange ratio, or exchange ratio, is the molar ratio of the incoming thiol to the leaving thiolate. Between 1:20 and 1:2 is considered appropriate if one only wants to populate the easily exchangeable defect sites (edge, vertices). Previous research has shown that at an exchange ratio of 1:2, the number of exchanged ligands is roughly equivalent to the number of vertex
and edge defect sites (8). Conversely the higher ratios (20:1) are used to make an attempt at exchanging ligands onto difficult to exchange defect sites like terraces. Evidence of preferential site selection is shown in Table 1. The accuracy of place exchange predictions assuming nonselective exchange is extremely questionable especially at exchange ratios above 1:2. Therefore, the results support the theory that place exchange occurs primarily at preferential defect sites due to a strong gradation of surface site reactivity. Kinetic studies of place exchanged NPs revealed that the exchange rate depends on the concentration of both the incoming thiolate and the exiting thiol . These results support an exchange mechanism with a rate determining step that involves a R'SH thiolate entering the ligand shell and protonating a bound thiol (33).
Table 1: Equilibrium Results for Place-Exchange Reactions between Cluster Ligands and Solution Thiols
Reactant Mole Ratio; Reactant Mole Ratio: Reactant Mole Ratio; Reactant Mole Ratio; ThioliCluster Ligand Thiol/Cluster Ligand ThiolVCluster Ligand Thiol/Cluster Ligand
expt. * clusterligand 1:20 1:2 2:1 20:1
1 C4S MPCfMeOzCC 11 ISH
ligand exch: #expected' 2 1( 77 102
#observedb G 31 86 100
obs/expected 3,0 20 1.1 1.0
2 C8S MPC/MeOzCC I ISH
ligand exch: #expected 3 27 80 104
#Olberved 3 16 51 75
obsl xpectcd 1.0 0,0 0.64 0.72
3 Cl2S MPC/MIeOCC I ISH
ligand exch: #expected 4 25 72 105
#observed 4 18 34 77
obs/expected 1.0 0,72 (0.47 0.73
4 CIGS MPC/MeOzCC ISHI
ligand exch: #expected 3 20 84 104
4observed 4 20 42 73
obs/expected 1,3 0.76 0.50 0.70
5 CIGS MPC/MeO2CC15SH
ligand exch: #expc ted 2 22 75 104
#observed 3 14 42 42
obs expected 1,5 0.64 0.56 0.40
(33) a Number of thiols expected to place-exchange from solution onto the cluster (within the total of 106 ligands per cluster), assuming nonselective exchange (no preference for exchange among the various cluster sites) between the initial mixture of free thiols and thiolatecluster ligands. b Number of thiols (average, per cluster) experimentally observed (1H NMR) after 96 h of reaction to have place-exchanged from the solution onto the cluster (within the total of 106 per cluster). c The ratio of experimental observation to expectation, assuming
chloroform _ 6 0 14 25 33 50 67 75 88 100 % UPA 4.5E-07 4.01-07 3.51-07 2. 507 1.5 07 I OE-087 5.0E-08 1.05-12 3.5E-07 3.0E-07 2.5E-07 2.0E-07 1.SE-07 1.0E-07 5.0E-08 1.05-12 5.0E-07 4.5E-07 4.0E-07 2.SE-07 .0E-07 1.0-712 1.0r-12 0 14 25 33 50 67 75 86 100 % MPA 0 14 25 33 50 67 75 86 100 % MPA 5.0E-07 4.5E-07 4.0E-07 3.5E-07 S2.5E-07 2.0E-07 l.SE-07 o 1.0E-07 5.0E-08 1.0E-12 5.0E-047 4.5E47 4.-07 3.5E-07 3.0E-07 2.5E-07 2.0E-07 S5E-07 I.OE-07 5.0E-08 1.OE-12 5.0548 7 S.0E-08 5.05408 4OE08 30E-08 SOE208 1.0E-12 D 14 25 33 50 87 75 88 100 % MPA carbon tetrachloride 0 14 25 33 50 67 75 86 100 % MPA DMSO 6.0E48 5.0E-08 5 4.0548 8.OE-08 1.0E-58 1.0E-12 1 2E-07 1 OE47 2.0E-08 1.0E-12 0 14 25 33 50 67 75 86 100 % MPA 0 14 25 33 50 67 75 88 100 % MPA ethanol 0 14 25 33 50 67 75 88 100 % MPA 1-propanol 0 14 25 33 50 87 75 86 100 % MPA 0 14 25 33 50 67 75 88 100 % MPA 3.0E-07 2.5E-07 2.OE-07 1 5-07 1 E- 07 5.0E-08 1.0E-12 ethylene glycol 0 14 25 33 50 67 75 86 100 % MPA iso-propanol 0 14 25 33 50 67 75 86 100 % MPA
Figure 3: (26) Plot of the saturation concentrations (expressed in M x 1-1) for OT/MPA NPs as a function of the ligand shell composition, for NPs dissolved in various solvents: benzene (a), hexane (b), THF (c), DCB (d),
chloroform (e), carbon tetrachloride (f), DMSO (g), ethylene glycol (h), methanol (i), ethanol (j), 1-propanol (k), and
isopropanol (1). Error bars are the largest variation in concentration observed for different spectra on the same sample and/or on samples with the same composition prepared on different occasions (they account for
instrumental, dilution, and sample-preparation uncertainties). The molecular structures of the solvents used have the following color code: carbon (gray), hydrogen (white), oxygen (red), sulfur (yellow), and chlorine (green).
2. Experimental Section
The Stucky method (7) was used to synthesize octane thiol (OT, CH3-(CH 2)7-SH) coated gold nanoparticles. 5 mmol (- 1.23 g) of AuPPh3CI and 10.43 mmol (1.81 ml) of octane thiol were dissolved in
hexane 5.05-07 4.55-07 4.0E-07 3.5E-07 2.OE-07 1.807 5.0E-08 1.05-12 methanol benzene
400 ml benzene. 50 mmol (~ 4.34g) of tert-butylamine-borane complex powder was added to the clear solution in one step. The solution was then stirred and heated at 55 'C for one hour. The solution was cooled to room temperature and 400 ml of ethanol was added to precipitate the gold NPs. A centrifuge was used to separate the NPs from the supernatant liquid and they were rinsed in ethanol thoroughly three times. The NPs were then allowed to dry in a vacuum. The synthesis yielded 420 mg of
monodisperse gold NPs.
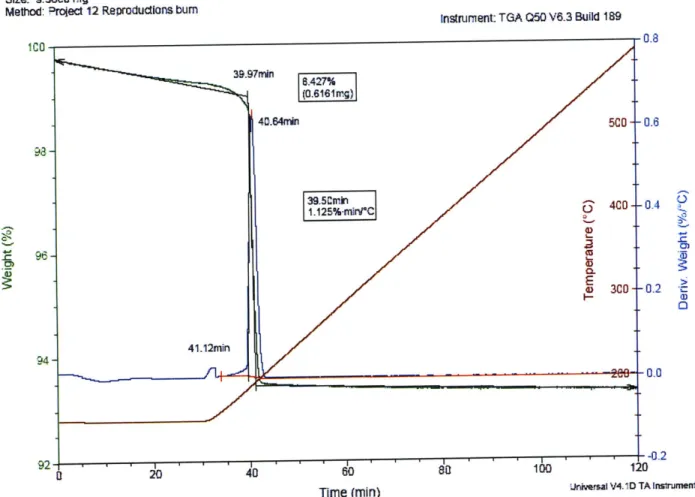
Thermogravimetric analysis (TGA) has provided researchers the ability to determine the exact mass of the organics coating the NPs. The sample is heated inside the device until there is recorded weight loss which is illustrated by the vertical line on the data print out (see Figure 5). The mass lost is assumed to be the mass of the organic portion coating the NPs due to OT's relatively low melting point.
Transmission Election Microscopy (TEM) has allowed academics to image the NPs after synthesis in order to find their average size. An imaging program like Image J is required to sift through the image and find the average diameter. It is very important to customize the settings properly so that the NPs are counted consistently and the diameter is measured accurately and to scale.
Both the TEM data and the TGA data together give researchers the ability to fully characterize NPs. Once you have the diameter from the TEM one can easily find the volume. Using the density of gold and the volume, it is easy to find the average mass of the NPs. We can also find out how many moles of the ligand there were by dividing the lost mass by the molecular weight of the ligand. From there we multiply the moles of ligand by Avogadro's number to determine the number of ligand molecules. Simply dividing the number of ligands by the number of NPs will return the number of ligands per NP.
8.97 mg of the OT gold NPs were subject to TGA to determine the weight of the organic portion. Additionally, the NPs were imaged using transmission electron microscopy (TEM) to determine the
average radius and volume. The results were combined to determine the average number of OT ligands per gold NP.
Place exchange was then used on the remaining NPs to synthesize NPs with varying ratios of OT to mercaptopropionic acid (MPA, HOOC-(CH2)2-SH). 7 sets of - 55 mg of the OT NPs were dissolved in
chloroform at a concentration of 3mg/ml. MPA was then added in molar ratios of exchaning MPA to OT ranging from 1:20, 1:2, 1:1, 2:1, 20:1, 25:1, and 30:1. The solutions were stirred at room temperature for over a week (only 96h is required for equilibrium) (33). The solutions were then subjected to a vacuum environment in order to remove the chloroform. The OT/ MPA NPs were then rinsed in excess ethanol or THF to remove any unreacted ligand. TGA was performed on the NPs to determine the amount of
ligands that were exchanged.
The UV-Vis has provided an invaluable tool for determining NP concentration in solvents. Only - 2
ml of solution are needed to find out the exact concentration. The UV-Vis will plot the absorbance spectrum (nm vs counts) for the solution after it has been calibrated with a black level and an ambient light level. The absorbance unit, counts, is essentially arbitrary and it is made meaningful during the analysis. Gold NPs in solution have a very unique absorption spectrum. They are characterized by a plasmon that peaks between 530 and 560 nms. The plasmon peak is what uniquely identifies the
concentration. In order to compensate for the arbitrary absorbance unit a base line absorbance must be subtracted from the peak value. The absorbance spectrum should be essentially a linear plot between 300 and 800 nm broken up in half by the plasmon peak. A trend line needs to be fit to the linear plot in order to provide a "zero" value for absorbance. The true absorbance is equal to the plasmon peak
absorbance minus the "zero" value which is determined by plugging the wavelength of the plasmon peak into the trend line equation. From here it is necessary to calculate the extinction coefficient. It has been proven that the extinction coefficient can be found using the equation
In(E) = k In(D) + a (2)
Where E is the extinction coefficient, k is a constant equal to 3.32111, D is equal to the average NP diameter, and a is a constant equal to 10.80505 (34). Once the extinction coefficient has been calculated the concentration is simply equal to the absorbance you calculated previously divided by the extinction coefficient.
Roughly 3 mg of each exchange ratio classified set of NPs was then added to -12 ml of methanol, ethanol, and dimethyl sulfoxide. The experiment was done in triplicate allowing for 3 data points per exchange ratio per solvent. The solutions were then sonicated for 20 minutes and stirred for 3 hours. Ultraviolet-visible spectroscopy (UV-Vis) was used to obtain the initial concentrations via optical density measurements at the plasmon peak. Afterwards the samples were left for 1 week to decant. UV-Vis was used once again to determine the final concentrations. In all cases the final concentration was lower than the initial which confirms that the final concentration was the saturation concentration.
11 3. Results ". olow 2009-03-17 Palmer's OT nanoparticles_0O1.tif Palmer's OT nanoparticles 20 nm
Cal: 2.796pix/nm HV=200.OkV
TEM Mode: Imaging Direct Mag: 50000x
Tilt:
Size: 9.5860 mg
Method: Project 12 Reproductions bum
TGA
Instrument TGA Q50 V6.3 Build 189
0.4 (c 0.2 " D Cl 92"1 - - II I I I I I I -0.2 0 20 40 60 80 100 120
Time (min) Universal V4.1D TA Instruments
Figure 5: TGA (Thermogravimetric Analysis) of OT coated gold nanoparticles.
Based on the TEM images, the OT coated gold nanoparticles were found to have an average diameter of 5.22 nm with a standard deviation of .47 nm.
Based on the TGA data, the OT coated gold nanoparticles were found to have an average
metallic core mass of 1.44E-15 mg. Using the TEM data in conjunction with the TGA data, the OT nanoparticles were found to have an average of 410 ligands per nanoparticle. The density of a single ligand footprint on the NP was found to be 1.82 angstroms.
Ethanol
2.50E-08 1.98E-08 4.92E-09 3.30E-09 2.02E-097.77E-10 1.23E-09 2.00E-12
__
di 3
0% 4.76% 33.33% 50.00% 66.67% 95.24% 96.15% 96.77% % MPA
Figure 6: Plot of the concentration of place exchanged OT/MPA coated gold nanoparticles varying with % MPA. The
nanoparticles were dissolved in Ethanol and the error bars represent the standard error (Standard deviation over the square root of the number of samples). The % MPA was not determined experimentally and was based solely off of the exchange ratio under the incorrect assumption that all incoming ligands would be exchanged. The true % MPA should be lower than the listed % MPA and ratio of theoretical % MPA to true % MPA should decline roughly with increasing theoretical % MPA (6, see table 1). The 0% and 100% concentration values were taken from a previous paper (26) because no place exchange was necessary. Triplicate testing was used.
2.00E-08 1.50E-08 1.00E-08 5.00E-09 1.00E-12 100% ; I
Methanol
1.38E-08 1.55E-08 1.60E-08 1.40E-08 1.20E-08 1.00E-08 8.00E-09 6.00E-09 4.00E-09 2.00E-09 1.00E-12-2.22E-09
96.77% 100% 0% 4.76% 33.33% 50.00% 66.67% 95.24% 96.15% % MPAFigure 7: Plot of the concentration of place exchanged OT/MPA coated gold nanoparticles varying with % MPA. The
nanoparticles were dissolved in Methanol and the error bars represent the standard error (Standard deviation over the square root of the number of samples). The % MPA was not determined experimentally and was based solely off of the exchange ratio under the incorrect assumption that all incoming ligands would be exchanged. The true %
MPA should be lower than the listed % MPA and ratio of theoretical % MPA to true % MPA should decline roughly with increasing theoretical % MPA (6, see table 1). The 0% and 100% concentration values were taken from a
previous paper (26) because no place exchange was necessary. Triplicate testing was used. 7.08E-09
5.00E-09
DMSO
7.00E-08 6.00E-08 5.00E-08 4.00E-08 3.00E-08 2.00E-08 1.00E-08 0.00E+00 0% 4.76% 33.33% 50.00% 66.67% 95.24% 96.15% 96.77% 100% % MPAFigure 8: Plot of the concentration of place exchanged OT/MPA coated gold nanoparticles varying with % The nanoparticles were dissolved in DMSO and the error bars represent the standard error (Standard deviation over the square root of the number of samples). The % MPA was not determined experimentally and was based solely
off of the exchange ratio under the incorrect assumption that all incoming ligands would be exchanged. The true % MPA should be lower than the listed % MPA and ratio of theoretical % MPA to true % MPA should decline roughly with increasing theoretical % MPA (6, see table 1). The 0% and 100% concentration values were taken from a previous paper (26) because no place exchange was necessary. Triplicate testing was used.
5.82E-08 4.56E-08 5.02E-08 3.00E-08 1.95E-08 1.10E-08 1.10E-08 1.05E-08 1.25E-09 1.25E-09
7.00E-08 6.00E-08 5.00E-08 4.00E-08 3.00E-08 2.00E-08 1.00E-08 0.00E+00 2E-08
DMSO (No Outliers)
5.8
1.10E-08
1.29E-09 8.03E-10 6.48E-10 1.25E-09
a
m
95.24% 96.15% 96.77% 100%
0% 4.76% 33.33%
% MPA
Figure 9: Plot of the concentration of place exchanged OT/MPA coated gold nanoparticles varying with % MPA. The
nanoparticles were dissolved in DMSO and the error bars represent the standard error (Standard deviation over the square root of the number of samples). The % MPA was not determined experimentally and was based solely
off of the exchange ratio under the incorrect assumption that all incoming ligands would be exchanged. The true % MPA should be lower than the listed % MPA and ratio of theoretical % MPA to true % MPA should decline roughly with increasing theoretical % MPA (6, see table 1). The 0% and 100% concentration values were taken from a previous paper (26) because no place exchange was necessary. Triplicate testing was used (Duplicate where the outlying data was removed).
4. Discussion
It has been shown previously (7) that the solubility OT/MPA gold nanoparticles depends significantly on the ratio of OT:MPA ligands coating the nanoparticle. It is understood that when
synthesized using a one step method (both OT and MPA ligands are added into solution simultaneously) the ratio of OT to MPA is largely responsible for the unique surface morphology. Solubility experiments support the idea with evidence of non-monotonic solubility profiles for nanoparticles functionalized
50.00% 66.67%
~---with both polar and non-polar ligands. At the moment, it is not clear whether or not OT/MPA
nanoparticles synthesized using the place exchange method described previously end up with similar surface morphologies for given OT: MPA ligand ratios. If the final morphologies were equivalent we would expect to see nearly identical solubility profiles regardless of the method used to functionalize the nanoparticles.
All of the solubility plots for the place exchanged NPs have the same characteristic
non-monotonic trend as the plots for the one step NPs. The consistency in the solubility trends between the two types of NPs implies that the previously proposed phase transition that was postulated to occur between 20% and 80% MPA for one step NPs most likely applies to place exchanged NPs as well. It is important to remember that it was not possible at the time of the experiment to precisely determine the true % MPA for the place exchange NPs. The percentage was based solely off of the exchange ratio and under the incorrect assumption that all incoming ligands would be exchanged. The true % MPA should be lower than the listed % MPA and ratio of theoretical % MPA to true % MPA should decline roughly with increasing theoretical % MPA (33, see table 1). Keeping that in mind, the similarity in the peak value of concentration and the % MPA at which it occurs is remarkable. The concentration values only differ by a factor or -2.5. Therefore, the place exchanged NPs almost certainly form a similar type of ripple shell morphology due to the presence of a solubility peak in a polar solvent (ethanol) at 33.33%
MPA (14).
The similarities in solubility between place exchanged NPs and one step NPs in methanol mirror those in Ethanol. The peak concentration value between place exchanged and one step NPs once again only differs by a factor of -2.5. The peak MPA % corresponds fairly nicely as well. The slight variations can be easily explained through the polarity differences between the two solvents (discussed further below). The appearance of a trend between similar solvents for place exchanged NPs that is different
from the trend for one step NPs is evidence that the place exchanged ligand shell morphology at the same percent MPA may be significantly different from the ligand shell morphology created using the one step method. Additionally, the consistency of the results supports the idea that the place exchanged NPs were of a consistent shell morphology.
The similarities between the solubility profiles of place exchanged NPs and one step NPs are very apparent and telling. With the exception of the 66.67% MPA data point, the DMSO plots for place exchanged and one step NPs look nearly identical. The peak concentration values only differ by a factor of 1.2 and the non-monotonic trend at high and low % MPA matches very well. Due to the similarities in the trends, the high % MPA portions of the DMSO plot may provide us with an insight into the true %
MPA for these place exchanged NPs. While the solubility profiles between place exchanged and one step NPs are similar, the differences are apparent and worth exploring.
There are striking differences when comparing the solubility in ethanol of OT/MPA nanoparticles synthesized using place exchange versus those synthesized using the one step method. The most
apparent distinction is the large solubility difference between the two at very low MPA concentrations around 4.76% MPA. The place exchanged nanoparticles easily go into solution at very low MPA
concentrations while the one step nanoparticles are almost entirely insoluble at those concentrations. It is also important to note that the one step nanoparticles seem to behave in a step like fashion at low MPA concentrations when compared to the place exchanged nanoparticles. In ethanol the one step nanoparticles '"jump" into solution at a critical value of 25% MPA while the place exchanged
nanoparticles appear to make the transition much more gradually and at lower MPA concentrations. The 4.76% MPA place exchange should cause MPA ligands to almost exclusively exchange with OT at
defect sites due to their favorable energetics (33). If the MPA ligands are exclusively chemisorbed onto the NPs at defect sites it is conceivable that they might increase the spacing between OT ligands near
the defect site. The OT domains might have irregular spacing due to MPA ligands that were exchanged onto the semi-randomly distributed (21) defect sites (there is not a static population of defect sites). The extra spacing would lead to reduced repulsion between the ethanol solvent and the non-polar OT as well as providing space for the attraction between MPA ethanol. It is even conceivable that there may
be a more monotonic relationship between solubility and % MPA for place exchanged nanoparticles at low MPA concentrations. In future experiments it would be wise to more thoroughly examine the solubility of place exchange NPs at % MPA lower than 33.33% to explore the possibility of a more
monotonic trend. The place exchanged NPs also have a step wise decrease in solubility at MPA concentrations greater than 33.33% while the one step NPs decrease much more gradually. As the %
MPA increases, the MPA ligands exchange much less selectively (33) which may lead to a loss of
morphological uniformity causing mismatches between the ligand shell and the solvent molecules which would lead to lower solubility.
For place exchanged OT/MPA NPs in methanol, we see a linear trend for low MPA
concentrations that resembles the trend seen in ethanol. The linear trend in Methanol lasts over a larger range of MPA concentrations and appears to begin at a more gradual pace (more data points for % MPA below 50 % is necessary to confirm the gradual pace). Assuming the same mechanisms of place
exchange described above, the similarities and differences between the ethanol and methanol plots make sense because methanol is more polar than ethanol. The NPs would not solubilize as readily in methanol at low MPA concentrations because the repulsive forces between the OT ligands and the solvent are stronger in methanol. Conversely, the attractive forces between the MPA ligands and the methanol would be much stronger. Supporting evidence can be found when comparing the solubility of 100% MPA coated NPs in ethanol and methanol. Although the place exchanged 50% MPA NPs in ethanol have almost completely come out of solution, those same NPs remain in solution at a high concentration in methanol. Although the NPs should have the exact same surface morphology, the methanol is able to
20
keep them in solution because of the larger attractive force between the MPA and methanol. The critical shell morphology (ratio at which solubility drops significantly) in methanol can be of a higher MPA concentration because the additional MPA helps solubilize the NPs regardless of morphology (to an extent) due to the stronger attractive forces between MPA and methanol.
The solubility of place exchanged OT/MPA NPs in DMSO for the most part follows the same trend as one step OT/MPA NPs in DMSO. The striking difference is the almost complete insolubility of 66.67% place exchanged OT/MPA. Based on the analysis from the solubility of place exchanged NPs in methanol, there may be a critical morphology change that occurs near 95.24% MPA in place exchanged NPs. DMSO is uniquely structured to detect a specific type of change due to its polar aprotic nature (it
can dissolve both polar and nonpolar substances). It would follow that DMSO would be a great solvent for a patterned OT/MPA NP because it can interact attractively with both the nonpolar OT ligands and the polar MPA ligands. The ligands would be ordered providing a periodic structure for DMSO to interact with. If an appropriate length scale of DMSO was proportional to the periodicity of the shell morphology it is easy to imagine how it would be the perfect solvent for OT/MPS NPs with a specific periodic
structure. Furthermore, if the perfect periodic structure for solubility exists one could also imagine a structure that would effectively negate the duality of DMSO as a solvent. If the data is not erroneous, it would appear as if 66.67% MPA place exchanged NPs have the perfect conditions to precipitate in DMSO. The mechanism used to explain the linear trend of solubility for low MPA concentrations in methanol and ethanol would also help explain the DMSO trend. If the place exchange process gradually increases the random bombardment of MPA ligands, as you increase the exchange ratio it would be possible to imagine the shell morphology reaching a tipping point where the magnitude of the
bombardment was unique enough to create a shell morphology that precipitated in DMSO. It has been proven that exchange ratios of 33.33% populate nearly all of the easy to populate sites (vertices and edges) but nothing else (33). Thus, it is conceivable that at 66.67% MPA the "magnitude" of
21
bombardment is enough to randomly populate enough terrace sites in addition to all of the edge and vertex sites which could lead to a structure that is insoluble in DMSO.
It is very important to note that the DMSO profile did have 3 outlying data points. The outliers are the reason for the large error bars at % MPA below 50 and the similarities in the one step and place exchanged solubility trends. If the outliers were not actually relevant data it would lead me to believe that the gradual place exchange mechanism discussed previously was responsible for the very low concentration values. DMSO encourages NPs to go into solution when it encounters both a hydrophobic and a hydrophilic R group. The concentration of 100% OT in DMSO is only 1.0E-8. Therefore, if the place exchange does not create ordered domains at low concentrations to encourage simultaneous solvent interactions with both ligands, we would not expect to see high concentration values at all.
5. Conclusion
It has been proven that the solubility of NPs is almost solely dependent on the ligand shell morphology. The place exchanged NPs almost certainly form a type of ripple shell morphology due to the presence of non-monotonic solubility peaks in a polar solvent s at low MPA concentrations (26). One step and place exchanged NPs show very similar but noticeably different non-monotonic solubility profiles over a range of solvents. Thus, one can conclude that the ligand shell morphology for a given percent MPA must be different for place exchanged and one step nanoparticles. The differences are most likely due to the mechanism by which place exchange populates the nanoparticles. Place
exchanged ligands tend to target very specific binding sites at low MPA concentrations which could be responsible for the observed differences in solubility trends. Furthermore, increasing the exchange ratio acts as a driving force that allows more sites to become available for population (33). Consequently, it is possible that higher exchange ratios may increase the randomness in ligand population distribution causing a less ordered morphology to form which reduces solubility in certain polar solvents.
22
6. References
1 Schiotz, J., Di Tolla, F.D. & Jacobsen, K.W. Softening of nanocrystalline metals at very small grain sizes. Nature 391, 561-563 (1998).
2 Dai, H.J. Carbon nanotubes: Synthesis, integration, and properties. Acc. Chem. Res. 35,
1035-1044 (2002).
3 Brust, M.; Walker, M.; Bethell, D.; Schiffrin, D. J.; Whyman, R. J. Chem. Soc., Chem. Commun. 1994, 801-802.
4 (a) Wuelfing, W. P.; Gross, S. M.; Miles, D. T.; Murray, R. W. J. Am. Chem. Soc. 1998, 120, 12696-12697. (b) Templeton, A. C.; Wuelfing, M. P.; Murray, R. W. Acc. Chem. Res. 2000, 33, 27-36.
5 Stoeva, S. I.; Prasad, B. L. V.; Uma, S.; Stoimenov, P. K.; Zaikovski, V.; Sorensen, C. M.; Klabunde, K. J. J. Phys. Chem. B 2003, 107, 7441-7448.
6 Stoeva, S.; Klabunde, K. J.; Sorensen, C. M.; Dragieva, I. J. Am. Chem. Soc. 2002, 124, 2305-2311.
7 Stucky, Galen D. et al. one-step one-phase synthesis of monodisperse noble-metallic nanoparticles and their colloidal crystals. JACS Communications, published on web (2004)
8 Yee, C. K.; Jordan, R.; Ulman, A.; White, H.; King, A.; Rafailovich, M.; Sokolov, J. Langmuir
1999, 15, 3486-3491.
9 Jana, N. R.; Peng, X. G. J. Am. Chem. Soc. 2003, 125, 14280-14281.
10 Rowe, M. P.; Plass, K. E.; Kim, K.; Kurdak, C.; Zellers, E. T.; Matzger, A. J. Chem. Mater.
2004, 16, 3513-3517.
12 Templeton, A.C., Wuelfing, M.P. & Murray, R.W. Monolayer protected cluster molecules. Acc. Chem. Res. 33, 27-36 (2000).
13 Daniel, M.C. & Astruc, D. Gold nanoparticles: Assembly, supramolecular chemistry, quantum-size-related properties, and applications toward biology, catalysis, and nanotechnology. Chem. Rev. 104, 293-346 (2004).
14 Thomas, K.G. & Kamat, P.V. Chromophore-functionalized gold nanoparticles. Acc. Chem. Res. 36, 888-898 (2003).
15 Templeton, A.C., Wuelfing, M.P. & Murray, R.W. Monolayer protected cluster molecules. Acc. Chem. Res. 33, 27-36 (2000).
16 Bain, C.D. & Whitesides, G.M. Modeling organic-surfaces with self-assembled monolayers. Angew. Chem. Intl Edn 28, 506-512 (1989).
17 Yitzchaik, S. & Marks, T.J. Chromophoric self-assembled superlattices. Acc. Chem. Res. 29, 197-202 (1996).
18 Templeton, A.C., Wuelfing, M.P. & Murray, R.W. Monolayer protected cluster molecules. Acc. Chem. Res. 33, 27-36 (2000).
19 Stellacci, F. et al. Ultrabright supramolecular beacons based on self-assembly of two-photon chromophores on metal nanoparticles. J. Am. Chem. Soc. 125, 328-328 (2003). 20 Murray, W. et al. Dynamics of Place-Exchange Reactions on Monolayer-Protected Gold
Cluster Molecules. Langmuir 15, 3782-3789 (1999).
21 Stellacci, Francesco et al. Spontaneous assembly of subnanometer ordered domains in the ligand shell of monolayer-protected nanoparticles. Published online
22 Daniel MC, Astruc D (2004) Gold nanoparticles: Assembly, supramolecular chemistry, quantum-size-related properties, and applications toward biology, catalysis, and nanotechnology. Chem Rev 104:293-346.
23 Thomas KG, Kamat PV (2003) Chromophore-functionalized gold nanoparticles. Acc Chem
Res 36:888-898.
24 Shipway AN, Katz E, Willner I (2000) Nanoparticle arrays on surfaces for electronic, optical, and sensor applications. ChemPhysChem 1:18-52.
25 Verma A, et al. (2008) Surface structure-regulated cell membrane penetration by monolayer protected nanoparticles. Nature Materials 7, 588 - 595
26 Stellacci, F et al. The role of nanostructure in the wetting behavior of mixed-monolayer-protected metal nanoparticles. PNAS vol. 105 no. 29 9886-9891 (2008).
27 Uzun O, et al. (2008) Water-soluble amphiphilic gold nanoparticles with structured ligand shells. Chem Comm, 196-198,.
28 Mulvaney P (2001) in Nanoscale Materials in Chemistry, Metal Nanoparticles: Double Layers, Optical Properties, and Electrochemistry, ed Klabunde KJ (Wiley, New York), pp 121-167.
29 Bakr OM, Wunsch BH, Stellacci F (2006) High-yield synthesis of multi-branched
urchin-like gold nanoparticles. Chem Mater 18:3297-3301.
30 Bauer CA, Stellacci F, Perry JW (2008) Relationship between structure and solubility of
thiol-protected silver nanoparticles and assemblies. Top Catal 47:32-41.
31 Graziano G (2000) Cavity thermodynamics and hydrophobicity. J Phys Soc Jpn