HAL Id: hal-01764871
https://hal.archives-ouvertes.fr/hal-01764871
Submitted on 14 Jun 2019
HAL is a multi-disciplinary open access archive for the deposit and dissemination of sci-entific research documents, whether they are pub-lished or not. The documents may come from teaching and research institutions in France or abroad, or from public or private research centers.
L’archive ouverte pluridisciplinaire HAL, est destinée au dépôt et à la diffusion de documents scientifiques de niveau recherche, publiés ou non, émanant des établissements d’enseignement et de recherche français ou étrangers, des laboratoires publics ou privés.
Modeling of segmented pure polyurethane
electrostriction behaviors based on their nanostructural
properties
M.H. Jomaa, Karine Masenelli-Varlot, G. Diguet, L. Seveyrat, L. Lebrun, K.
Wongtimnoi, C. Véchambre, J.-M. Chenal, J.Y. Cavaille
To cite this version:
M.H. Jomaa, Karine Masenelli-Varlot, G. Diguet, L. Seveyrat, L. Lebrun, et al.. Modeling of seg-mented pure polyurethane electrostriction behaviors based on their nanostructural properties. Poly-mer, Elsevier, 2015, 62, pp.139-147. �10.1016/j.polymer.2015.02.016�. �hal-01764871�
1 | P a g e
Modeling of segmented pure polyurethane electrostriction
behaviors
based on their nanostructural properties
M. H. Jomaa1,2*, K. Masenelli-Varlot1,G. Diguet3, L. Seveyrat2, L. Lebrun2,K. Wongtimnoi1, C. Vechambre1, J. M. Chenal1, J.Y. Cavaillé1..
1 Université de Lyon, INSA-Lyon, CNRS, MATEIS, F-69621 Villeurbanne Cedex, France 2 Université de Lyon, INSA-Lyon, LGEF, F-69621 Villeurbanne Cedex, France
3 University of Johannesburg, Johannesburg PO Box 524 Auckland Park 2006 South Africa
*Author to whom all correspondence should be addressed
Abstract
Polyurethane (PU) exhibit very high electromechanical activity, and has a great interest for a
wide range of transducer and actuator applications. It has been recently pointed out that this
strong electrostriction may result from the phase separation. In the present work, a model
taking account the PU nanostructure is presented. In order to validate this model, three PUs of
similar compositions but different soft segment fractions have been characterized by DSC,
TEM, AFM and SAXS and their electrostriction properties have been measured. When taking
into account the diameter of the hard domains (HD) and the HD-HD distance, it is found that
the model proposed well reproduces the experimental electrostriction properties of these
phase-separated PUs.
Keywords:Polyurethane, electrostriction, modeling, microstructure.
I.
Introduction
Electroactive Polymers (EAP) are a relatively new class of "smart material" that deform in the
presence of an applied electric field [1], meaning they can convert electrical energy into
2 | P a g e sensors, biomimetics, robotics, energy harvesting and storage devices, among others [2, 3].
Polyurethanes have demonstrated their ability to convert electrical energy into mechanical
energy and vice versa. Furthermore, these materials are lightweight, very flexible, blood and
tissue compatible, highly resistant to abrasion; they present low manufacturing costs, and can
be readily molded into any desirable shape [4]. Segmented polyurethane elastomers are block
copolymers with alternating soft and hard blocks. In the present study the hard segments (HS)
are composed of 4.4’-methylene-bis-(phenyl-isocyanate) (MDI) and 1,4-butanediol (BDO)
and Poly(tetramethylene-oxide) is used as soft segments (SSs). The soft segments originate
from the polyol and impart elastomeric characteristics to the polymeric material; the hard segments contain the highly polar urethane linkages and act as high modulus “fillers”. Due to
structural differences/incompatibility, microphases or domains can be formed from the
respective hard and soft segments. Hard domains (HDs) - domains rich in HSs - play the role
of physical crosslinks and act as high modulus fillers, whereas soft domains (SDs) - domains
rich in SSs - provides extensibility [5,6]. The morphology of segmented PUs depends on the
structure and relative amounts of these soft and hard domains and their ordering [7] (as well
as from the form and the size distribution of HDs).
It is well documented that the properties and the performances of polyurethanes are strongly
dependent on the degree of microphase separation and on the ensuing morphologies [6, 8]. It
has been recently pointed out that the strong electrostriction properties of pure segmented PU
can be explained by the phase separation into HDs and SDs with high and weak dielectric
constants, respectively. Indeed, phase separation leads to heterogeneities of both elastic and
dielectric constants and to electric field gradients, which makes the SDs shrink and induces a
compression of the whole material [9]. Nevertheless, this model is based on several
3 | P a g e fractions of HDs and SDs. To our knowledge, the values of these parameters are still missing
in the literature.
The purpose of this work is to investigate how the recent model can explain the
electrostriction properties of segmented pure PUs. Since microstructural parameters are entry
parameters of this model, an extensive microstructural characterization will be carried out.
Three PUs with different weight fractions of HSs and SSs will be studied to check the
robustness of the model.
II.
Material and methods
Three different types of aromatic polyether-based thermoplastic PU are commercially
available and were provided by the same company, Lubrizol, with different weight fractions
of HSs and SSs. In the following, PU60, PU75 and PU88 respectively refer to Estane® ETE
60DT3 NAT022, Estane® X4977 NAT 039 and Estane® 58888 NAT021.From the supplier
safety data sheet, it is mentioned that these PUs were synthesized by the same industrial
process from the same initial chemical components. In addition to the different weight
fractions of HSs and SSs, they also exhibit different molecular weights of SSs: 1000 (g/mol)
for PU88 and PU60, and 2000 (g/mol) for PU75.
The polymer films were prepared by following a solution casting method. Before use, the PU
granules were heated at 350 K for 3 hours. Then they were dissolved in
N,N-dimethylformamide (DMF, Sigma-Aldrich D158550, 99%) with a ratio of 25 wt.% of PU into
DMF. The solution was heated at 350 K for 4 hours under mechanical agitation, until a
homogeneous and viscous solution was obtained. Afterwards, this solution was casted on
glass plates with an Elcometer 3700 doctor blade film applicator, put in an oven at 335 K for
one day. A second heating treatment at T= 400 K during 3 hours was then performed to
4 | P a g e The microstructural morphology of segmented pure PU was studied by Differential Scanning
Calorimetry (Setaram, DSC 131 Evo)) under nitrogen flow (P = 1.5 bar). Samples of 20 mg
were cooled to 140 K under liquid nitrogen and then heated to 480 K before being cooled to
room temperature. The heating and cooling rates were set at 10 K / min.
Transmission Electron Microscopy (TEM) was used to investigate the phase separation into
HDs and SDs but for that purpose, the samples had to be stained prior to the observation. The
choice of the staining agent used in a given polymer system is guided largely by empirical
success [10]. OsO4 and RuO4 are probably among the best known staining agents and are
routinely used to stain polymers. OsO4 is believed to act as a covalent crosslinker between
unsaturated carbon double bonds [11].RuO4 is mainly used to differentially label aromatic
moieties from aliphatic ones [12, 13]. However due to similar chemical structures between
HSs and SSs in the PUs studied here, a significant differential staining could not be obtained
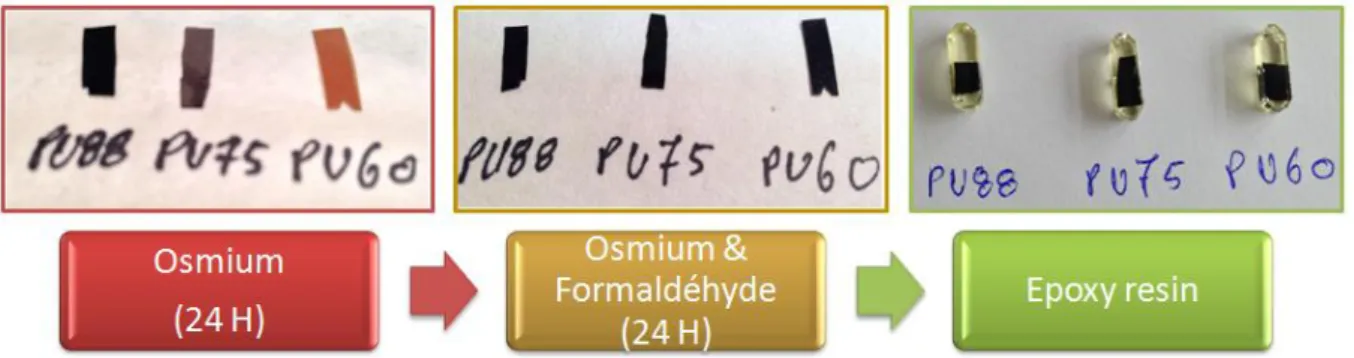
with OsO4 or RuO4 alone. Indeed for each PU type, a piece of film was stained in a 4%
aqueous solution of OSO4 for 24 hours. After rinsing with ethanol, the films of PU60 and
PU75 turned to colors which clearly indicates incomplete staining see Fig. 1. RuO4 led to
similar colors on the PUs studied here (not shown). Thus, a protocol similar to that of Janina
Foks [14] was used, since they demonstrated that it was possible to localize the HDs of pure
PU by using a double staining technique based on OsO4 and formaldehyde. By adding OsO4,
Os stained double bonds on both segments as a first step. As a second step by adding
formaldehyde and OsO4, formaldehyde opened the N-H bonds and made it accessible for
osmium (the N-H bond exists only in the HS).
For each PU type, a piece of film was stained in a 4% aqueous solution of OsO4 for 24 hours.
After rinsing with ethanol, the films were stained in a 50:50 aqueous solution of OSO4 and
HCHO4 (initial concentrations of 4% and 37% in water, respectively) for 24 hours [14]. After
5 | P a g e indication of a successful staining step (see Fig. 1). Thus, the films were embedded in an
Epofix® resin and ultrathin sections were obtained by cryoultramicrotomy with a Reichert
Ultracut S. The sample temperature was set to 200 K and the 35° diamond knife speed to 1
mm/s.
TEM observations were carried out at acceleration voltage of 200 KV with a JEOL 2010F
microscope, operating at 200kV. Bright field images were recorded with a Gatan Orius 200
camera. Measurements were performed manually using ImageJ on at least 90 objects.
Fig. 1 Double staining protocol of segmented pure polyurethane.
Morphological observations of the HDs and SDs were performed by Atomic Force
Microscopy (AFM) Nanoscope 5 (VEECO). Thin polymer films of each PU were deposed on
a glass plate and dried for one night prior to imaging. Tapping mode phase images of sample
surfaces were made using NanoProbe tips PPP-NCL (Nanosensor) for PU88 with a frequency
of 153.2 kHz. PU75 and PU60 were analyzed with a NanoProbe tip SSS-NCH (Nanosensor)
at a frequency of 272 kHz.
Small Angle X-ray Scattering (SAXS) was used to investigate the HD distribution. For that
purpose, stacks composed of several layers of films were analyzed in transmission mode in
two different directions, see Fig. 2. Patterns were acquired using a RU-300 generator
equipped with a copper anode ( Cu-Kα = 1.54 Å). The 1-2 mm thick stack was placed at a
6 | P a g e
Fig. 2 Set-up used for SAXS characterisations. The samples are stacks composed of several layers of the films. Two different analysis directions are indicated.
The field-induced thickness strain Sexp was measured on circulars sample (25mm of
diameter) with a homemade setup based on a double-beam laser interferometer measurement
(Agilent 10889B) [15, 16]. Samples were placed between two cylindrical brass masses acting as conductive electrodes. A mirror was placed on the upper electrode to reflect the laser
beam. A bipolar electric field was supplied by a high voltage amplifier (Trek10/10B) driven
with a function generator (Agilent 33250A). Measurements were made at room temperature
[17].
III.
Results and discussion
1. Modeling
Guillot et al. explained from macroscopic level, that there was an empirical relationship
between the electrostrictive coefficient, the dielectric constant and the compliance coefficient
[18]. Recently, Diguet et al. pointed out that the phase separation into HDs with high
dielectric constant and SDs with weak dielectric constant can result into the strong
electrostriction properties of pure segmented PU. This, in turn, leads to heterogeneities of
7 | P a g e shrink and the whole material compress [9]. In this work, Diguet’s model is extended to take
into account morphological parameters such as the HD diameter, the HD-SD distance and the
HS weight fraction.
The strain is calculated from the Z-component of electric body force, created by HD taken as
a sphere with radius a into the surrounding SD. For a linear polarized dielectric medium in
presence of an electric field E, the Z-component of electric body force is:
z
z
SD
z z v u dz dE u E E dz d u E P dz d f 2 0 0 _ (1)Where εSD and χ are the dielectric constant and the electric susceptibility of the material
respectively, ε0 is vacuum permittivity and P is the material electric polarization.
Within a volume V delimited by a surface AS, the total force F, the body force fv and the stress
σ are related as:
S A S V vdV ndA f F (2)So, the force created at the distance z≥a from the centre of the sphere is obtained by summing
contributions from the edge of a HD sphere:
S S A S SD A S z a z SD u dzdA E z E a dA dz dE 2 2 0 2 0 (3)Identifying with (2), the stress is extracted from (3) and the deformation S of the soft domain at the distance z≥a from the centre of the HD sphere is then obtained by dividing the stress by
the SD Young modulus YSD:
SD SD Y a E z E z S 2 2 0 (4)8 | P a g e It can be seen that the strain is proportional to the difference of the square of the fields at the
edge of the sphere and at the considered point. Consequently, the electric field inside the
material has to be calculated. The applied electric field E0 is considered to be directed along the uz direction. Using boundaries conditions and considering only the Z-component (1D), the
electric field created out (z≥a) of the dielectric sphere, can be expressed as:
z u z a A E z E 3 0 1 2 ) ( (5)
With A the so-called dielectric contrast defined by:
HD SD HD SD A 2 (6)
The constant A varies, depending on the HD sphere and its SD surrounding dielectric
constants, between -1 and 0.5 for SD/HD 0 and HD /SD 0 respectively.
Considering two spheres weakly interacting spaced by a distance 2D, i.e. one placed at z=-D
and the second one placed at z=+D, the electric field is expressed as the superposition of the
fields created by each of the sphere:
z u D z a AE D z a AE E z E 3 0 3 0 0 2 2 ) ( (7)
At the middle of the gap (z=0), the electric field is:
z u D a A E z E 3 0 1 4 ) 0 ( (8)
9 | P a g e
0
)
(z E
E (9)
At the sphere interfaces (|z|=D±a), the electric field is:
z u a D A E a D z E 3 0 1 2 1 1 2 1 ) | (| (10)
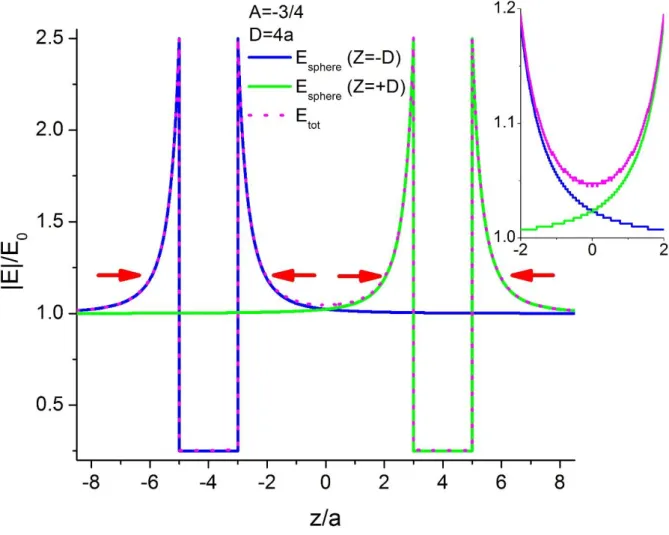
As a quick estimation, with A=-3/4 and D>>a, equations (8) and (10) give E(0)=E0 and
E(|z|=D±a)= 2.5E0 which can be seen in Fig. 3; or to be more precise, with A=-3/4 and D=4a,
E(0)=1.04E0 which can be seen in the inset of the figure below.
Fig. 3 : Value of the electric field calculated from equations (6) to (9), with a the sphere radius, the half distance between both spheres D equal to 4a and the dielectric contrast A equal to -3/4. The inset shows a
10 | P a g e As seen in Fig.3, there are 4 regions of SD deformation which can be reduced to 2 regions because of the symmetry; the region named below as ‘inner’ corresponded to the two
deformations between the spheres whereas the region named below as ‘outer’ corresponded to
the two deformations in the region apart the spheres.
The outer deformation can then be expressed from (4) with (9) and (10) as:
) | (| | | 2 0 E2 z E2 z D a Y S SD SD outer
(11) z outer u a D A K S 2 3 1 2 1 1 2 1 1 (12) Where
soft SD Y K 2 0 ,And the inner deformation is expressed from (4) with (8) and (10) as:
) | (| 0 2 0 E2 z E2 z D a Y S SD SD inner
(13) z inner u a D A D a A K S 2 3 2 3 1 2 1 1 2 1 4 1 (14)For a long chain of spheres, the outer contribution acts only at the ends of the chain while the
11 | P a g e contributive component is expected to be the inner contribution and outer contribution will be
neglected below. The final strain is weighted as follow; first, the deformation between the HD
is obtained by SD SD inner L L
S meaning the SD change of length normalized by the SD initial
length whereas the global deformation is given by
L L Stot . Since LSDL and SD SD L
L (ϕ the SD fraction) then we can write inner SD
SD SD SD tot S L L S . The 1D SD fraction is
D a D a D SD 1 2 2 , and finally we can express the global deformation by :
D a S Stot inner 1 (13) For a 3D system: 3 D a HD , thus SD =1- HD.
12 | P a g e
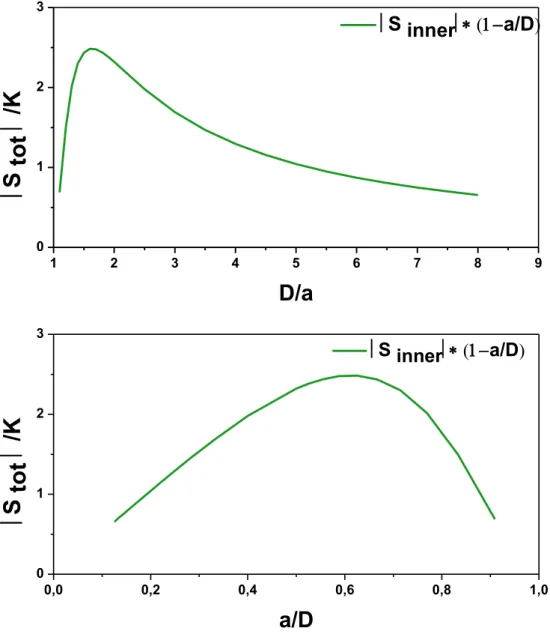
Fig. 4 : calculated variations of the total strain -1D system- for different values of a (sphere diameter) and D (half-distance between two spheres). The dielectric contrast A was fixed to -3/4.
The variations of the total strain in function of the morphological parameters a and D are shown in
Fig. 4. It is noteworthy that the total strain is highly dependent on D/a. Thus, the experimental
measurement of such parameters – as well as the shape of the HD – is crucial to validate the
model.
2. Experimental determination of the morphological parameters a. Phase separation 0,0 0,2 0,4 0,6 0,8 1,0 0 1 2 3 S innera/D
S
tot
/K
a/D
1 2 3 4 5 6 7 8 9 0 1 2 3 S innera/D
S
tot
/K
D/a
13 | P a g e The DSC thermograms presented in Fig. 5 and Fig. 6 were recorded in order to study the
influence of the HS weight fraction as well as that of the phase separation on the crystalline
morphology of the polyurethane host. The glass transition temperature for the soft segments (𝑇𝑔𝑆𝐷), melting temperatures ( 𝑇𝑚𝐼𝐼𝐻𝐷 and 𝑇𝑚𝐼𝐼𝐼𝐻𝐷 ), heat of fusion (∆𝐻𝒎), crystallization
temperature (𝑇𝒄) and heat of crystallization (∆𝐻𝒄) are summarized in Table 1.
Two temperature cycles were run in order to decouple the effects of the chemical structure
and those due to the elaboration conditions. The first run (C1) reflects PU microstructures
partly due to their thermal history whereas before the second run (C2), the thermal history
was erased through cooling from the viscous melt. It can be noticed that the thermal events
observed during the first run are always more visible than during the second one, especially around the HD melting temperature, 𝑇𝑚𝐼𝐼𝐼𝐻𝐷 (not shown). This suggests that the time during
which the PU chains can move is larger within the elaboration process involving a solvent
than inside the DSC oven, and thus the phases are better organized. Furthermore we agree
with a reviewer that this kind of thermal transition can be annealed out of the film with heat
treatment. A thermal pretreatment is often used for polymers before DSC analysis. This
pretreatment must be done at a temperature greater than 443-453k and it is a problem because
it can imply a possible degradation of PUs [19]. For this reason the results given are based on
14 | P a g e
Fig. 5 DSC thermograms of the 3 pristine PUs upon heating (1st run)
200 250 300 350 400 450 -8 -6 -4 -2 -9 -8 -7 -6 -5 -10 -8 -6 -4 200 250 300 350 400 450 T mIIHDTmIIIHD TgSD H e a t F lo w (mW) T (K) PU60 T mIIIHD T mIIHD TgSD H e a t F lo w (mW) PU88 T mIIIHD T mIIHD Melting of SS H e a t F lo w (mW) PU75 TgSD Cristallisation of SS
15 | P a g e
Table 1. Parameters extracted from the DSC thermograms for the 3 PUs. 𝑇𝑔𝑆𝐷, 𝑇𝑚𝐼𝐼𝐻𝐷 , 𝑇𝑚𝐼𝐼𝐼𝐻𝐷 are the glass transition temperatures related to the soft domains, and melting temperatures of hard domains, respectively. 𝑇𝑐 is the crystallization temperature. ∆𝐻𝑚 and ∆𝐻𝑐 and the enthalpies of fusion and
crystallization, respectively.
𝑻𝒈𝑺𝑫 (k) 𝑻𝒎𝑰𝑰𝑯𝑫 (K) 𝑻𝒎𝑰𝑰𝑰𝑯𝑫 (K) ∆𝑯𝒎(J/g) 𝑻𝒄(K) ∆𝑯𝒄 (J/g)
PU75 205 425 447 11 285 -17
PU88 234 418 443 12 361 -8
PU60 259 427 451 16 423 -15
The glass transition temperature 𝑇𝑔𝑆𝐷 and the two melting temperatures suggest that each one
of the 3 studied PUs has two "mixed" phases, one rich in SSs (the SDs), the other one rich in
HSs (the HDs). This is in agreement with the results found by Saiani et al. [20]. The
elaboration conditions (thermal history, evaporation of DMF, etc...) are important factors that
influence the overall morphology of PUs.
The first thermal phenomena - near 204 K, 228 K and 254 K for PU75, PU88 and PU60 respectively- can be related to the glass transition of soft domains (𝑇𝑔𝑆𝐷). This value can give
an estimation of the amount of hard segments (HS) dissolved in the SDs and as a consequence
an indication of the “purity” of the soft phase [21, 22]. Indeed, an increase of the HS weight fraction led to a significant decrease of the 𝑇𝑔𝑆𝐷 [23]. This suggests an increase of the SS
fraction in the HS when increasing the SS fraction.
For PU75 a characteristic peak around 240 K seems to correspond to the crystallization of SSs
then followed by melting around 280 K (see Fig. 5), which is confirmed by dynamic
mechanical measurement on the same sample (not shown). This indicates that during
elaboration, the cooling was rapid enough to prevent crystallisation of the SSs.
Moreover, a bimodal endothermal transition can be observed for the 3 PUs on the DSC
16 | P a g e could correspond to the fusion of crystalline hard segments with two different chain lengths
[21, 24]. Alternatively, it can be related to rearrangements within the HDs and SDs, followed
by the fusion of crystalline HDs [25, 19]. In the two cases an increase of these temperatures
values or an increase of the bimodal endotherm enthalpy indicates an higher cristallinity. PU60 presents the highest ∆𝐻𝒎 value in agreement with the highest fraction of HD.
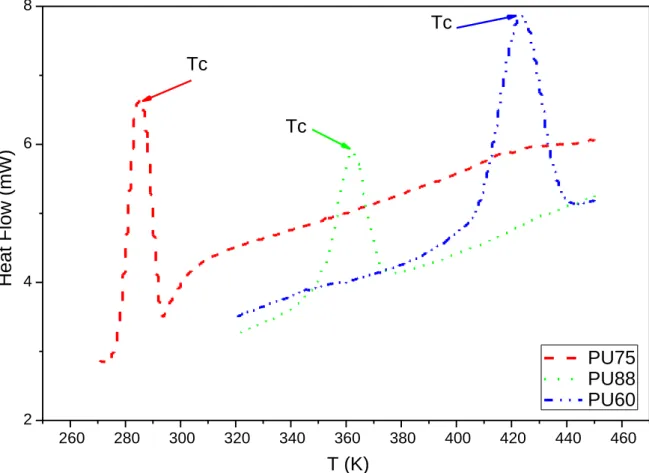
Fig. 6 DSC thermograms of the 3 pristine PUs upon cooling.
During cooling from the molten state to lower temperature (see Fig. 6), the 3 PUs exhibit a
single exothermal crystallization event. This peak can be attributed to the crystallization of the
HDs. Interestingly, the presence of one crystallization peak only does not seem to be
compatible with 2 different HS lengths. This suggests that the bimodal peak observed upon
heating was rather due to rearrangements of the HSs and SSs inside the HDs and SDs
followed by melting of the HDs. The crystallization temperatures are highly dependent on the 260 280 300 320 340 360 380 400 420 440 460 2 4 6 8 H e a t F lo w ( m W ) T (K) PU75 PU88 PU60 Tc Tc Tc
17 | P a g e HS fraction (see Table 1). Indeed, they are equal to 285 K, 361 K and 423K for PU75, PU88
and PU60, respectively. It is thought that an increase of the HS fraction leads to an
enrichment of the HS fraction within the HDs, which facilitates their crystallization.
b. Diameter distribution of HDs
AFM exhibits a very high resolution for imaging morphologies at the surfaces of segmented
copolymers [26, 27]. In the tapping mode, the crystalline or hard domains in segmented
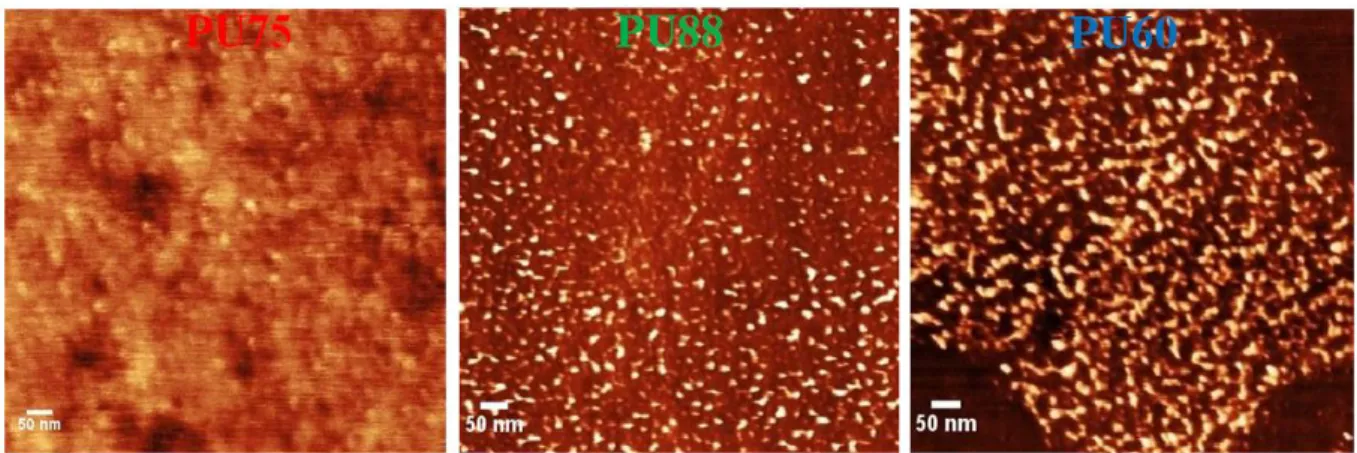
copolymers can be imaged even at low hard-segment contents [28, 29]. Fig. 7 presents typical
phase images obtained on PU75, PU88 and PU60 by AFM.
Fig. 7 AFM micrographs for PU75, PU88 and PU60 (phase images). The bright regions correspond to stiffer domains, i.e. the HDs.
These three segmented pure PUs exhibit two-phase morphologies, with bright stiff domains
embedded in dark soft matrices [30, 31, 32]. This confirms the phase separation deduced from
the DSC thermograms, the bright domains and the dark matrices being the HDs and the SDs,
respectively. The HDs are found to be irregular in shape but mostly globular. A globular
morphology is not always observed on polyurethane systems. Indeed, Elwell et al. evidenced
percolated co-continuous microstructures [33]. Here, it is thought that the AFM images do not
reveal co-continuous system. Indeed, the AFM images correspond to a planar section of the
18 | P a g e the contrary, Schrader et al. [11] and Prici et al. [34] found a globular microstructure with a
PU similar to the ones studied here, although with a different weight fraction of HS. This
irregular shape and quite diffuse domain boundaries is thought to originate from polymer
phase mixing in the form of hydrogen bonding between hard and soft regions of the polymer,
which is commonly seen in polyether polyurethanes [30, 31].
The HD diameter distributions, measured from the AFM images, are presented in Fig. 9. The HD diameters mostly lie in the 6-14 nm range. It is noteworthy that the 3 PUs exhibit very
similar HD diameter distributions. It can thus be concluded that the HS fraction has a
negligible effect on the HD diameter but rather influences the HS content within each phase
(HD and SD). The distribution of HD diameters can result on the one hand from an
aggregation of different numbers of HSs and on the other hand from the existence of HSs of
deferent sequence lengths [11].
A similar study was conducted by TEM on stained samples, to confirm the phase separation
and the HD diameter distribution. Fig. 8 displays a representative micrograph obtained on
PU75.
19 | P a g e Again, two phases can be distinguished, with dark domains embedded in a bright matrix. As
the double-staining method is expected to stain preferentially the hard segments, the dark
domains can be attributed to the HDs and the bright matrix to the SDs. At this point, it is
important to recall that TEM provides a 2D projected view of a 3D volume. Thus, the HDs
may appear in contact with each other in the TEM image whereas they are disconnected and
at different heights in the volume. Nevertheless, the microstructure observed by TEM is
consistent with a globular morphology, in agreement with the results from AFM and from the
literature [34].
The HD diameter distributions measured on TEM micrographs for each PU are presented in
Fig. 9. For PU75 and PU88, the distributions are very similar to those derived from AFM,
whereas the distribution is shifted towards smaller values for PU60. This shift is thought to be
non-significant, since the distances measured on TEM bright field images are known to
depend on the defocus [35]. Thus, it can be concluded that AFM and TEM lead to similar HD
diameter distributions, and that the average HD diameter does not depend on the HS weight
20 | P a g e
Fig. 9 Diameter distributions of hard domains of 3 PU using TEM and AFM microscopies.
c. Distance between HDs 0 2 4 6 8 10 12 14 16 18 20 0 20 40 600 20 40 0 10 20 30 40 50
PU60
F
re
q
u
e
n
cy
(%
)
Diameter (nm)
TEM
AFM
PU88
F
re
q
u
e
n
cy
(%
)
TEM
AFM
F
re
q
u
e
n
cy
(%
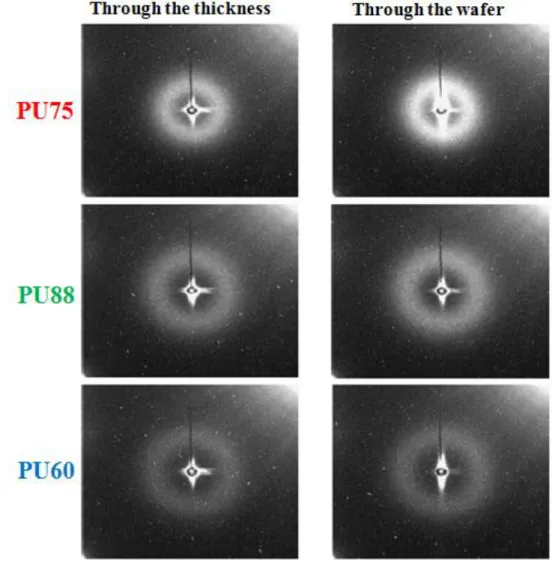
21 | P a g e SAXS measurements were performed on the 3 PUs in order to measure the mean distance
between HDs. The 2D SAXS patterns are shown in Fig. 10. A diffuse ring can be seen for
each PU in each configuration. As the samples are obviously isotropic, the intensities were
plotted in function of the scattering vectors q by averaging the signals over the rings.
Fig. 10 SAXS 2D patterns obtained for the 3 PUs with two different orientations with respect to the X-ray beam.
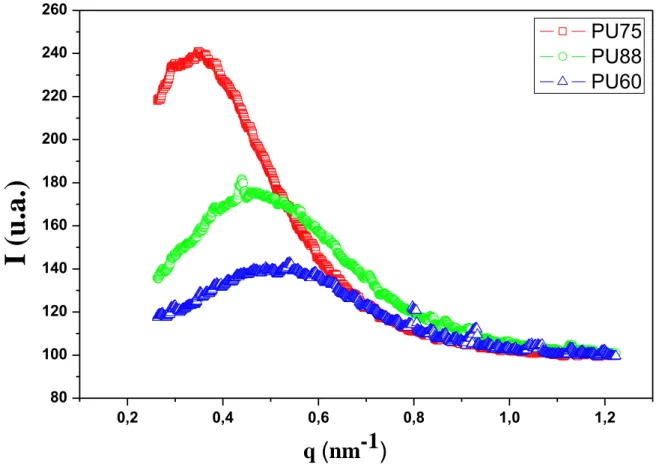
The intensity variations in function of the scattering vector q are displayed in Fig. 11. The
correlation bumps, corresponding to the rings observed on the 2D patterns, are clearly visible.
From the previous analysis including DSC, AFM and TEM, the correlation bumps are
22 | P a g e can be used to determine a mean HD-HD distance, using Bragg relationship
max 2 i d q
[36]. The values are reported in Table 2. Clearly, the average distances between HDs lie in the 10-20 nm. It decreases when increasing the HS fraction, as was qualitatively observed on theAFM images.
Fig. 11 Scattered intensity I in function of the norm of the scattering vector q, for the 3 PUs.
Table 2. Average distance between two HD domains for the 3 PUs [23].
PU75 PU88 PU60
q max (nm-1) 0.36 0.44 0.53 Average distance (nm) 17.5 14.3 11.8 3. Electrostriction 0,2 0,4 0,6 0,8 1,0 1,2 80 100 120 140 160 180 200 220 240 260
I
(u.
a.
)
q
(
nm-1
)
PU75
PU88
PU60
23 | P a g e Based on the achieved parameters (diameter of HD -from TEM and AFM observation- and
inter distance between HD and SD-from SAXS measurements) on the 3 pure segmented PUs,
we calculated the inner and total deformations, either in 1D – considering only Z component,
see equation (13)- or in 3D considering (X,Y, Z) components. The values are presented in
Table 3. For each PU, the experimental value, Sexp, measured using a laser interferometer
setup, is given for comparison.
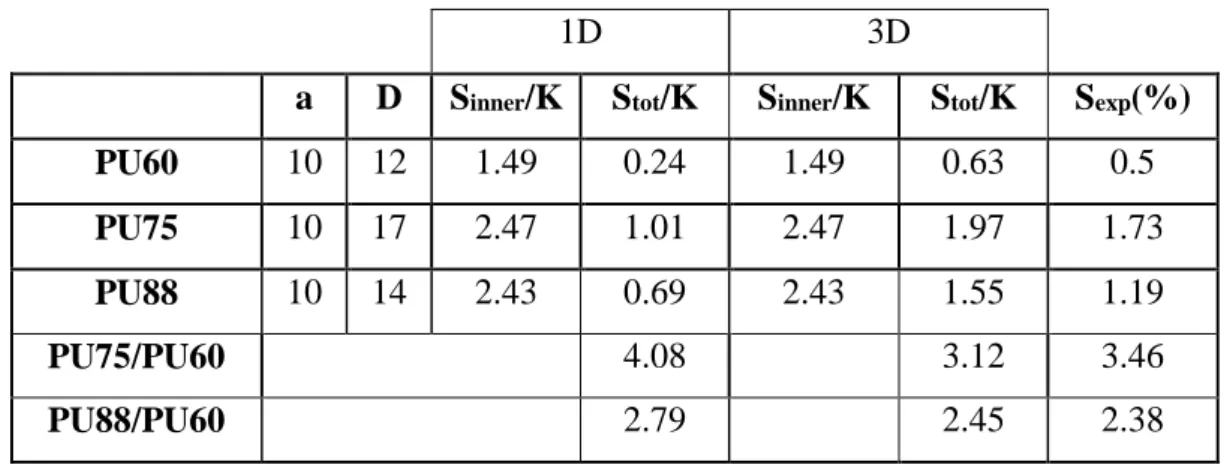
Table 3. Strain deformation of segmented PU; experimental & calculated values
1D 3D
a D Sinner/K Stot/K Sinner/K Stot/K Sexp(%)
PU60 10 12 1.49 0.24 1.49 0.63 0.5
PU75 10 17 2.47 1.01 2.47 1.97 1.73
PU88 10 14 2.43 0.69 2.43 1.55 1.19
PU75/PU60 4.08 3.12 3.46
PU88/PU60 2.79 2.45 2.38
There is a good correlation between experiments and model, especially with the 3D model.
This validates the model based on the polymer nanostructure. This also suggests that the
electrostriction properties of polyurethanes polymers can be tuned by controlling the polymer
morphology, in terms of phase separation, HD diameter and HD-HD distance.
IV.
Conclusions
The purpose of this work was to provide a model of the segmented PU electrostriction
properties, based on their microstructures and taking into account morphological parameters
such as the HD diameter, the HD-HD distance and the HS weight fractions. Such model has
been presented in a first part of the paper.
To validate the model, a complete analysis was performed by coupling DSC, TEM, AFM and
24 | P a g e HSs. It has been found that the 3 PUs exhibit segmented morphologies with spherical HDs
embedded in soft matrices. The average HD diameter estimated from TEM and AFM
observations has been found to be independent on the HS fraction since it was found to be
equal to 10 nm in the three PUs. On the contrary, the HS fraction influences the distance
between two adjacent HDs and may also play a role on the HS content inside the HDs and
SDs. The distance was found to vary from 17 nm for the PU with the lowest fraction of HS to
12 nm for the PU with the highest fraction.
With the introduction of these microstructural parameters values into the models such as
average HD diameter and HD-HD distance, the 3D model can well reproduce –with a good
correlation- the experimental values of the electrostriction deformation, which validates the
model. This opens the route to the design of materials with improved electrostrictive
properties, by optimizing the diameter of HD and inter-distance HD-HD in order to improve
and to have the best electrostrictive properties of segmented PU with globular morphologies.
Acknowledgments
The author acknowledges the French Agence Nationale de la Recherche (ANR) for financial
support, under grant NAPOLECO (ANR- 2010-INTB-910-01), and the Centre Lyonnais de
Microscopie (CLYM) for the access to the JEOL 2010F and Nanoscope 5 (VEECO)
microscopes and the Centre Technologique des Microstructures for the access to the
cryo-ultramicrotome. KMV would also like to thank B. Vastenhout and F. Gilleron for fruitful
25 | P a g e
References
[1] Bar-Cohen Y. Electroactive Polymer (EAP) Actuators as Artificial Muscles (Reality,
Potential and Challenges). SPIE Press. Bellingham. 2004.
[2] Cathleen T ,Raghu DAS, Electroactive Polymers and Devices 2013-2018: Forecasts,
Technologies, Players, Dielectric elastomers, electronic & ionic EAPs and their applications
[3] Cottinet. P-J, Guyomar. D, Guiffard. B, Lebrun. L, Putson. C. Electrostrictive polymers as
high-performance electroactive polymers for energy harvesting. INTEC. 2010. DOI:
10.5772/9946
[4] Zokay S-P, Fergusont. J. Polyurethane elastomers. Prog. Polym. Sci.1991; 16: 695-836.
[5] Hepburn C. Polyurethane elastomers. 2nd ed. London: Elsevier; 1991.
[6] Petrović Z-S, Javni I. The effect of soft-segment length and concentration on phase
separation in segmented polyurethanes. J. Polym.Sci. B Polym. Phys. 1989; 27: 545–560.
DOI: 10.1002/polb.1989.090270305.
[7] Xu. Y, Petrovic. Z, Das. S, Garth. L-W. Morphology and properties of thermoplastic
polyurethanes with dangling chains in ricinoleate-based soft segments. Polymer. 2008; 49:
4248–4258. DOI: 10.1016/j.polymer.2008.07.027
[8] Yang. C_Z., Grasel. T-G., Bell. J-L, Register. R-A, Cooper. S-L. Carboxylatecontaining
chain-extended polyurethanes. J. Polym. Sci. Part B Polym. Phys. 1991; 28: 581–588.
[9] Diguet. G, Bogner. A, Chenal. J-M, Cavaillé. J-Y. Physical modeling of the
electromechanical behavior of polar heterogeneous polymers, Journal of Applied
Physics.2012; 112: 0000. DOI: 10.1063/1.4766280.
[10] Chou. T-M, Prayoonthong. P, Aitouchen. A, Libera. M. Nanoscale artifacs in
26 | P a g e [11] Schrader. S, Li. X, Guo. F, Liu. Y, Luo. J, Xu. D. Electron microscopy investigation of
polyster-polyurethane elastromers stained with rutheinium teroxide. Die Makromolekulare
Chemie, Rapid Communications.1998.; 9 : 597-601. DOI: 10.1002/marc.1988.030090901
[12] Haubruge. H-G, Jonas. A-M. Staining of poly(ethylene terephthalate) by ruthenium
tetroxide. Polymer. 2003; 44: 3229-3234. DOI:10.1016/S0032-3861(03)00255-6
[13] Jeny I-S, Couchman. P-R. Ruthenium tetraoxide staining of polymers for
electronmicroscopy. Macromolecules, 1983; 16: 589-598. DOI:10.1021/ma00238a021.
[14] Foks. J, Naumannz. I, Michler. G-H. beitrag zur aufklärung der morphologie von
segmentierten polyurethanen/ contribution to the reconnaissance of the morphology of
segmented polyurethanes. Die Angewandte MakromolekuIare Chemie. 1991; 189: 63- 76
[15] Guiffard B, Seveyrat L, Sebald G, Guyomar D. Enhanced electric field induced strain in
non percolative carbon nanopower / polyurethane composites. J. of Phys. D: Appl. Phys.
2006; 3039- 3053.
[16] Guyomar D, Cottinet. P-J, Lebrun. L, Putson. C, Yuse. K, Kanda. M, Nishi. Y. The
compressive electrical field electrostrictive coefficient M33 of electroactive polymer
composites and its saturation versus electrical field, polymer thickness, frequency, and fillers.
Polymers for Advanced Technologies. 2012; 23, 946–950. DOI: 10.1002/pat.1993
[17] Seveyrat. L, Guyomar. D , Lebrun. L. Preparation of graphene nanoflakes/polymer composites and their performances for actuation and energy harvesting applications. Journal of Applied Physics. 2012; 111. DOI. 10.1063/1.4718577.
[18] Guillot F M , Balizer E. Electrostrictive effect in polyurethanes. Journal of Applied
Polymer Science. 2003; 89: 399-404. DOI: 10.1002/app.12096.
[19] Lapprand A, Mechin F, Pascault J-P. Synthesis and properties of self-crosslinkable
27 | P a g e [20] Saiani. A, Daunch. W-A, Verbeke. H, Leenslag. J-W, Higgins. J-S. Origin of Multiple
Melting Endotherms in a High Hard Block Content Polyurethane. 1. Thermodynamic
Investigation. Macromolecules. 2001; 34: 9059-9068
[21] Martin. D-J, Meijs. G-F, Gunatillake. P-A, McCarthy. S-J, Renwick. G-M. The effect of
average soft segment length on morphology and properties of a series of polyurethane
elastomers. II. SAXS-DSC annealing study. Journal of Applied Polymer Science. 1997; 64:
803. DOI: 10.1002/(SICI)1097-4628(19970425)64:4<803::AID-APP20>3.0.CO;2-T
[22] Chen. K-S, Leon. T-Y, Chen. Y-S, Lin. T-L, Liu. W-J. Soft- and hard-segment phase
segregation of polyester-based polyurethane. Journal of Polymer Research. 2001; 8: 99. DOI:
0.1007/s10965-006-0139-3.
[23] Wongtimnoi. K, "Polyuréthanes électrostrictifs et Nanocomposites: Caractérisation et
Analyse des mécanismes de couplages électromécaniques", PhD thesis, 2011, INSA-Lyon,
France.
[24] Król. P, Pilch. B-P. Phase structure and thermal stability of crosslinked polyurethane
elastomers based on well-defined prepolymers. Journal of Applied Polymer Science. 2007;
104: 1464. DOI: 10.1002/app.25011
[25] Koberstein J-T, Russell T-P. Simultaneous SAXS-DSC Study of Multiple Endothermic
Behavior in Polyether-based Polyurethane Block Copolymers. Macromolecules. 1986; 19:
714-720. DOI: 10.1021/ma00157a039.
[26] McLean. S, Sauer. B-B. Nano-deformation of crystalline domains during tensile
stretching studied by atomic force microscopy.J Polym Sci Part B: PolymPhys. 1999; 37:
859–866. DOI: 10.1002/(SICI)1099-0488(19990415)37:8<859::AID-POLB11>3.0.CO;2-U.
[27] McLean. S, Sauer. B-B. Tapping-mode AFM studies using phase detection for resolution
of nanophases insegmented polyurethanes and other block copolymers. Macromolecules.
28 | P a g e [28] Brayan. B-S,Scott Maclean. R, Reinoud. J-G, Meike. C, Nilesten. J-E. Crystalline
Morphologies in Segmented Copolymers with Hard Segments of Uniform Length. Journal of
Polymer Science: Part B: Polymer Physics. 2004; 42: 1783–1792. DOI: 10.1002/polb.20060.
[29] Sauer. B-B, McLean. R-S, Brill. D-J. Londono. D-J. Morphology and orientation during
the deformation of segmented elastomers studied with small-angle X-ray scattering and
atomic force microscopy. J Polym Sci Part B: Polym Phys. 2002; 40: 1727–1740.
DOI: 10.1002/polb.10234
[30] Matithew. J-O, Bruce. D-L, Garth. L-W. Structure–Property Relationships of
Poly(urethane urea)s with Ultra-low Monol Content Poly(propylene glycol) Soft Segments. I.
Influence of Soft Segment Molecular Weight and Hard Segment Content. Journal of Applied
Polymer Science. 2002; 84: 229–243. DOI: 0.1002/app.10168.
[31] Waletzko. R-S, LaShanda T. Korley. J, Brian D-P, Edwin L-T, Hammond. P-T. Role of
Increased Crystallinity in Deformation-Induced Structure of Segmented Thermoplastic
Polyurethane Elastomers with PEO and PEO-PPO-PEO Soft Segments and HDI Hard
Segments. Macromolecules. 2009; 42: 2041-2053. DOI: 10.1021/ma8022052.
[32] Gogolewski, S. Selected Topics in Biomedical Polyurethanes- a Review. Colloid Polym.
Sci. 1989; 267: 757–785.
[33] Michael J. Elwell, Anthony J. Ryan, Henri J. M. Gru nbauer and Henry C. Van Lieshout.
In-Situ Studies of Structure Development during the Reactive Processing of Model Flexible
Polyurethane Foam Systems Using FT-IR Spectroscopy, Synchrotron SAXS, and Rheology.
Macromolecules. 1996; 29: 2960-2968.DOI:10.1021/ma9511208.
[34] Princi. E, Vicini. S, Stagnaro. P, Conzatti. L. The nanostructured morphology of linear
polyurethanes observed by transmission electron microscopy. Micron. 2011; 42: 3-7.
29 | P a g e [35] Yao. B, Edwards. D-J, Kurtz. R-J, Odette. G-R, Yamamoto. T. Multislice simulation of
transmission electron microscopy imaging of helium bubbles in Fe. J. Electron Microsc. 2012;
61: 393-400. Doi: 10.1093/jmicro/dfs065
[36] Saiani. A, Rochas. C, Eeckhaut. G, Daunch. W-A, Leenslag. J-W, Higgins. J-S. Origin of
Multiple Melting Endotherms in a High Hard Block Content Polyurethane. 2. Structure