Publisher’s version / Version de l'éditeur:
Applied Acoustics, 63, August 8, pp. 849-866, 2002-08-01
READ THESE TERMS AND CONDITIONS CAREFULLY BEFORE USING THIS WEBSITE.
https://nrc-publications.canada.ca/eng/copyright
Vous avez des questions? Nous pouvons vous aider. Pour communiquer directement avec un auteur, consultez la
première page de la revue dans laquelle son article a été publié afin de trouver ses coordonnées. Si vous n’arrivez pas à les repérer, communiquez avec nous à [email protected].
Questions? Contact the NRC Publications Archive team at
[email protected]. If you wish to email the authors directly, please see the first page of the publication for their contact information.
NRC Publications Archive
Archives des publications du CNRC
This publication could be one of several versions: author’s original, accepted manuscript or the publisher’s version. / La version de cette publication peut être l’une des suivantes : la version prépublication de l’auteur, la version acceptée du manuscrit ou la version de l’éditeur.
For the publisher’s version, please access the DOI link below./ Pour consulter la version de l’éditeur, utilisez le lien DOI ci-dessous.
https://doi.org/10.1016/S0003-682X(02)00002-6
Access and use of this website and the material on it are subject to the Terms and Conditions set forth at
A Mathematical model for a single screen barrier in open-plan offices
Wang, C.; Bradley, J. S.
https://publications-cnrc.canada.ca/fra/droits
L’accès à ce site Web et l’utilisation de son contenu sont assujettis aux conditions présentées dans le site LISEZ CES CONDITIONS ATTENTIVEMENT AVANT D’UTILISER CE SITE WEB.
NRC Publications Record / Notice d'Archives des publications de CNRC: https://nrc-publications.canada.ca/eng/view/object/?id=5f6927d7-d3ec-4d13-80f4-250c47956400 https://publications-cnrc.canada.ca/fra/voir/objet/?id=5f6927d7-d3ec-4d13-80f4-250c47956400
A Mathematical model for a single screen barrier in open-plan offices
Wang, C.; Bradley, J.S.
NRCC-44486
A version of this document is published in / Une version de ce document se trouve dan
Applied Acoustics, v. 63, no. 8, August 2002, pp. 849-866
A Mathematical Model for a Single Screen Barrier in
Open-plan Offices
C. Wang* and J. S. Bradley
Institute for Research in Construction, National Research Council, Montreal Road, Ottawa, Canada
Abstract
In open-plan offices, single screen barriers are widely used to separate individual workplaces as a means of improving acoustical privacy. In this paper, a general model for calculating the insertion loss of a single screen barrier in the presence of a floor and a ceiling is developed using the image source technique. In addition to the acoustical properties of the floor and ceiling, this model also takes the sound absorption of the screen, the sound transmission through the screen and the interference between the sound waves into account. This model is able to separate the contribution of reflected sound and diffracted sound from the total sound pressure level at the receiving point, which can help indicate how best to improve the acoustical design of an open office. The mean differences between the predicted 1/3 octave band insertion loss values behind the screen and the corresponding measured results are within 2 dB.
*
1. Introduction
The open-plan office, or landscaped office, has become a widely accepted means of accommodating large numbers of office workers. However, achieving satisfactory acoustical privacy is a major problem associated with open-plan office designs. This problem has been aggravated due to a trend to increasing occupant density in open plan offices. In open-plan offices, free-standing screens (partial height partitions or panels), are the basic elements. They not only provide visual privacy, but also serve as sound barriers to provide improved acoustical privacy. Therefore, in order to efficiently obtain a good acoustical environment in open-plan offices, the acoustic performance of a single screen in offices has to first be fully understood. In the past thirty years, many papers have been published discussing the effects of the screen height and width[1, 2], the sound absorption of the screen surfaces[3, 4], and the presence of a ground surface on sound diffraction over the screen[5, 6]. Although most of these papers were based on barriers used for road traffic noise control, the basic ideas adopted in these analyses and the conclusions obtained, should apply to screens used in open-plan offices.
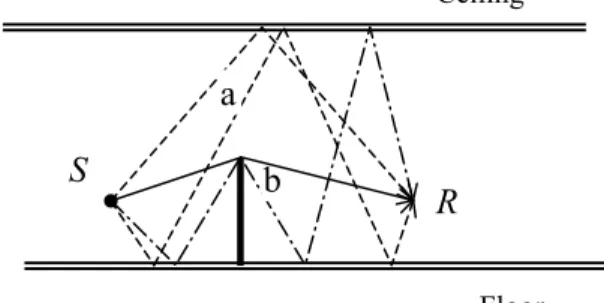
However, it should be noted that barriers for the purpose of controlling traffic noise have an open, free space above the screen, while in an open-plan office, the ceiling which is a sound reflective surface always exists. Consequently, the sound energy may reach the receiver on the other side of the screen via two possible mechanisms: diffraction at the screen edge, and reflection at the ceiling, as shown in Figure 1. For an open-plan office, the most important component affecting the acoustical privacy is typically the ceiling reflection[7]. As a result, it is suggested that the ceiling should be highly sound absorbing. However in most practical cases, the sound absorption coefficient of a ceiling cannot be 100% over the whole frequency range simply due to the inferior performance of typical absorbing materials at low frequencies, and also because of lighting systems in the ceiling.
In order to evaluate the influence of sound reflections from the ceiling on the acoustic performance of the screen, a mathematical model which includes the sound absorption coefficient (or the sound reflection coefficient) of the ceiling must be developed. For this purpose, Moreland et al[8] and Kurze[9] have presented two different models but both assumed that the sound field in the room is diffuse. Obviously, these two models are only valid when the ceiling and the floor are highly reflective. Kotarbinska[10] treated the
problem in a different way by using the image source method to represent reflections. Although this model is more general, only the averaged sound reflection coefficients of the floor and the ceiling were used in the model, which means that the effects of the floor reflection and the ceiling reflection were not separated. Also, the effects of the screen absorption and the interference effects, which are normally important at low frequencies were not considered.
b a Floor Ceiling R S
Figure 1. Sound propagation in a flat room (i.e. where the length and width of the room are large compared to the height).
This paper, therefore, describes the theoretical analysis of the insertion loss of a single screen in a flat room where the length and width of the room are large compared to the height. This simplifies the problem to a two dimensional problem that closely approximates conditions in actual open plan offices. Starting from Maekawa’s single screen diffraction results[1], a general expression, which not only takes the floor and ceiling reflections into account, but also includes screen absorption and the interference between the sound waves, is developed for calculating the insertion loss of a single screen in a flat room. Then analytical results are compared with measured data for varied configurations of the screen and ceiling.
2. Theoretical Analysis
2.1. A single screen in free spaceThe acoustic behaviour of a single screen in free space has been studied extensively. The most popular engineering method was developed by Maekawa[1] who obtained an empirical design chart by using a series of test data for estimating the sound diffracted over a semi-infinite single screen. Based on this chart, Kurze et al[11] developed an expression for the insertion loss of a screen (the difference of the sound pressure levels,
2 0
p and ps 2, at the receiving point with and without the screen present) for any
position in the shadow region behind the screen.
0 for ), dB ( 5 2 tanh 2 log 20 ) log( 10 2 2 0 + > = = f f f s N N N p p IL π π (1) where 2
[
( ) 0 l d B A c fNf = + − +
]
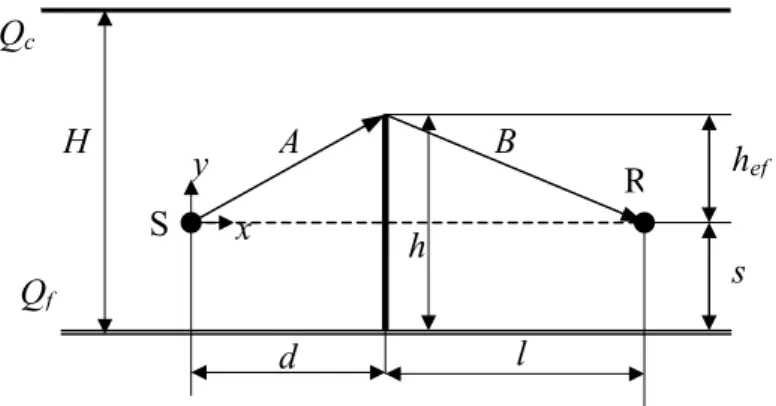
is the Fresnel number for the shortest diffraction path over the top of the screen. Here f is frequency, c0is the sound speed in the air, and A, B,d, l are the distances of the various sound paths shown in Figure 2(a). In order to improve the accuracy of the equation and have the whole range of Maekawa’s chart covered by numerical expressions, several formulae have been developed over the past thirty years[12]. However, since most of these formulae are not a single expression, to facilitate further analysis, Tatge’s result[13] is used in this study,
1 . 0 for dB), ( ) 20 3 log( 10 + ≥− = Nf Nf IL (2)
Obviously, this equation is much simpler, and easier to use. Moreover, this equation allows a negative Nf down to -0.1, corresponding to a receiving point in the illuminated
region of the screen[1], as shown in Figure 2(b). According to Maekawa’s chart[1], the error of this equation at Nf=-0.1 is about 2 dB. For Nf >0, it has been shown that the
maximum error of using equation (2) is about 1 dB, which normally happens at low frequencies and for the screens with very low effective height[12].
l d R S B A
ϕ
rϕ
s B A x y d l R S hef (a) (b)Figure 2. A single screen in free space: (a), receiver in the shadow region, Nf>0;
(b), receiver in the illuminated region, Nf<0.
It should be noted that in obtaining equations (1) and (2), the screen was assumed to be rigid, and sound reflection from the screen surface to be possible. Note that sound diffraction over the screen mostly depends on the sound pressure along the screen edge. It is expected that the acoustic performance of a screen with a sound absorptive surface is different from that with a sound reflective one. G.F. Butler[3] studied the difference theoretically and presented a formula for calculating the excess attenuation when the screen surface is highly absorptive (sound absorption coefficient = 1). More generally, for a screen surface with a complex sound pressure reflection coefficient Qs, the incremental
effect on insertion loss can be further written as,
(
)
(
)
(
)
+ (
−)
+ − + + = ∆ r s r s s r s r s Q IL ϕ ϕ ϕ ϕ ϕ ϕ ϕ ϕ 2 1 cos 2 1 cos 2 1 cos 2 1 cos log 20 (3) where = − ef s h d 1 tan ϕ , and = − ef r h l 1 tanϕ are shown in Figure 2(a). It can be seen that for a highly reflective screen (Qs=1),
∆
IL=0 as expected. When Qs=0, equation (3) is theone obtained by Butler[3]. Equation (3) indicates that generally as the source or receiver gets closer to the screen, the excess attenuation due to the screen absorption would increase. Theoretically, the maximum attenuation due to this effect is 6 dB for a highly absorptive screen.
In obtaining equations (1) and (3), the transmission loss of the barrier is generally assumed to be very high so that the sound transmitted through the barrier is negligible. In open-plan offices, since most screens are thin and lightweight structures, the sound transmission through single screen barriers may not always be neglected. The transmission loss of a single screen barrier can be written according to the mass law[14],
Mf
where M(kg/m2) is the mass per unit area, and f is the frequency. Obviously, the heavier the screen material, or the higher the frequency, the greater the transmission loss for sound going through the screen. Actually, in comparing the transmitted sound through the screen with the diffracted sound over the screen, Warnock[14] found that if the surface density of a single screen satisfies the following relationship,
) (
3 A B d l
M ≥ + − + (5) the transmitted sound is negligible. Here A, B, d, and l are defined in Figure 2. The minimum acceptable value of M corresponds to the transmission loss at 1000 Hz being 6 dB higher than the theoretical diffraction loss.
2.2. A single screen in a flat room
When a single screen is put in a flat room, the existence of the ceiling and floor reflection may change the acoustic behavior of the screen. Generally, more sound energy would impinge on the screen and finally reach the receiver due to sound reflections from the ceiling and the floor. An efficient approach to modeling such reflections is to employ the image source method, according to which a sound reflection path can be effectively represented by an image source with a source strength set to satisfy the acoustic boundary conditions at the reflecting surface. Note that in a flat room, the floor and the ceiling form two parallel reflective surfaces. To model the multiple reflections between the floor and the ceiling, a series of image sources above the ceiling and the below the floor can be generated. The accuracy of this method depends on the number of images considered, because all images may influence the final results. The advantage of this approach is that for each image, the problem can be simplified to that of a single screen in a free space with different combinations of propagation paths between the source and the receiver. In the discussions below, it is assumed that all of the acoustic units, such as the source, the receiver, and the screen, have their own images with respect to the ceiling and the floor. The image of the source with respect to the screen is not considered here because the effect of the screen absorption has been included in equation (3) for the case of free space.
Qf Qc B A x y H d l s h R S hef
Figure 3. Geometry of a single screen in a flat room.
In Figure 3, the geometry of a single screen in a flat room is shown. The sound pressure reflection coefficients of the floor and the ceiling are assumed to be Qf and Qc
respectively. When the screen is absent, only images of the real source S due to the floor and the ceiling need to be considered. The total sound pressure at the receiving point R is therefore the sum of the contributions from all of these images, which can be written as (omitting the time component ejωt),
L , 3 , 2 , 1 , 0 , ) ( 4 2 2 ) ( ) 2 ( floor ) 2 ( ceil 2 1 0 0 0 2 2 ± ± ± = + + =
∑
∞ = −∞ = + + − n l d Y e Q Q c W p n n n l d Y jk n f n c n π ρ (6)where ceil(x) and floor(x) are two functions defined as:
x x floor x x ceil ≤ = ≥ = integer greatest the ) ( integer smallest the ) ( (7) Also, W is the sound power of the source,
ρ
o is the air density, and k is the acousticwavenumber in air. Also, d is the distance from the real source S to the receiver R.
is the y-coordinate of the n-th image source − + = n s H n n nH Yn odd for , 2 ) 1 ( even for , [10] . Negative
n represent image sources located below the floor, while positive n represent image
sources located above the ceiling. When n=0,
) ( 4 ) ( 2 1 0 0 0 l d e c W p l d jk + ⋅ = − +
π
ρ
. This is the direct sound from the real source to the receiving point.From equation (6), it can be seen that the sound pressure level at a receiving point very much depends on the reflection coefficients of the floor and the ceiling. If the reflection coefficients are zero, there would be only direct sound between the source and the receiver, which is the case for free space. When the reflection coefficients are unity, the only thing affecting the contribution of an image source at the receiving point is the
distance between them. Note that generally the contributions from image sources decrease as the order of the image source |n| increases. There would always exist an order number after which the contribution of the image source to the total sound pressure at the receiving point is negligible. For convenience, let this order number be N.
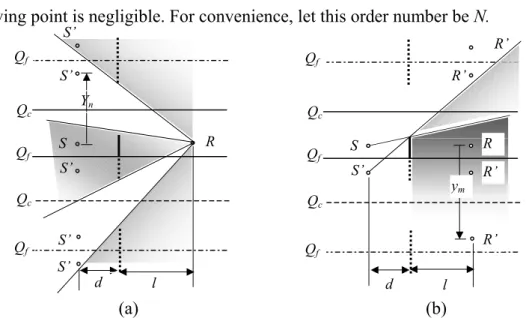
l d Yn R Qf Qf Qc Qf Qc S S’ S’ S’ S’ S’ (a) (b) ym R’ R’ R’ l d R Qf Qf Qc Qf Qc S S’ R’
Figure 4. The image space of a source and receiver in a flat room: (a) identifying the reflected paths between the source and the receiver; (b) identifying the image receivers in the shadow region.
When the screen is present, some of the sound waves will be prevented from reaching the receiving point. In the image space, these waves are those generated by the image sources, which are invisible to the receiving point behind the screen or the image screen, as shown in Figure 4(a). Therefore, it can be proved from Figure 4(a) that only those image sources whose y-coordinates Yn satisfy the relationship shown below would have
sound that reaches the receiving point directly.
[
i H h s]
i n l l d Y s h iH l l d n ( 2) , 0, 2, 4, 6, , 2 ) ( + − < < + + − − = ± ± ± ± + L (8) Here integer i only increases to 2n because it can be shown that for any i which is greater than 2n, it is impossible for this relationship to be satisfied. For those image sources whose y-coordinates do not satisfy equation (8), sound diffraction over the screen would occur. To benefit further description, integers K, and I are used respectively to represent those images whose y-coordinate does (YK) and does not (YI) satisfy equation (8). Thusthe reflected sound at the receiving point would be,
{ } { } { }
K I n l d Y e Q Q c W p K K l d Y jk K f K c r K = + + + =∑
− + + , ) ( 4 2 2 ) ( ) 2 ( floor ) 2 ( ceil 2 1 0 0 2 2 π ρ (9)Here it is assumed that for any reflection path, the magnitude and the phase angle of the reflected sound are not affected by the edge diffraction of the screen and the finite size of the opening from the top of the screen to the ceiling. This implies that the model developed may not apply at low frequencies or for small screen-to-ceiling gaps.
For the image sources for which the direct propagation paths to the receiver are blocked by the screen, sound diffraction at the screen edge thus becomes their secondary source to the receiver[15]. Since this secondary source radiates in all directions, the diffracted sound could be further reflected by the ceiling and the floor before it reaches the receiver. As a result, a series of image receiving points are therefore expected. Similar to the discussion above for image sources, the y-coordinates of those image receiving points ym can be
written as, N m m s H m m mH ym , 0, 1, 2, 3, , odd for , 2 ) 1 ( even for , L ± ± ± = − + = (10)
Again, a negative integer m represents images below the floor, and a positive integer m
represents images above the ceiling. Note that it is assumed that the sound diffraction only happens in the shadow region, which means that the image receiving point must be invisible to the source behind the screen, as shown in Figure 4(b). Therefore for a particular image source I, only those image receiving points which satisfy the relationship shown in equation (11) should be considered.
, ) ( ef I I m h Y Y d l d y < + − + (11) This equation actually ensures that all the image receiving points considered are located in the shadow region of the image source I. For those image receiving points which do not satisfy this relationship, there must be a direct path (plus reflection) to the source, which has already been considered in equation (9). Let integer J represents those image receiving points which satisfy the above relationship.
Although it might be reasonable to ignore the variation of the magnitude and the phase shift for the sound being reflected over the screen in equation (9), the corresponding change for the sound being diffracted over the screen has to be considered. This is because on the receiving side, the screen edge behaves like a secondary radiation source of which the source strength depends on the sound field of the source side[15]. Generally, to have an exact solution, a rigorous analysis which involves diffraction integrals is needed[2]. However, it was recently argued by Lam[5] that the phase shift of the sound
wave after the diffraction at the barrier edge can be approximately represented by
π
/4 radians, while the attenuation in magnitude still can be determined by Maekawa’s chart. This result has been further verified by Muradali et al[6] with 2-dimensional and 3-dimensional noise barrier simulations. Therefore, the total diffracted sound at the receiving point is,(
)
(
)
(
)
(
)
− + + − + + ⋅ + ⋅ ⋅ = − + − + +∑∑
rJ sI rJ sI rJ sI rJ sI s fIJ j I J IJ B A jk J I f J I c d Q N e L e Q Q c W p J I ϕ ϕ ϕ ϕ ϕ ϕ ϕ ϕ π ρ π 2 1 cos 2 1 cos 2 1 cos 2 1 cos 20 3 4 4 ) ( ) 2 ( floor ) 2 ( floor ) 2 ( ceil ) 2 ( ceil 2 1 0 0 (12) where ( )2 ( )2 I J IJ d l y YL = + + − is the distance from the I-th image source to the J-th
image receiving point, 2 ( )
0 IJ J I fIJ A B L c f
N = + − is the corresponding Fresnel number.
2
2 ( )
I ef
I d h Y
A = + − is the distance from the I-th image source to the top of the screen,
and )2
J
2 (
ef
J l h y
B = + − is the distance from the top of the screen to the J-th image receiving point. In this equation, term
fIJ j N e 20 3 4 + − π
corresponds to the screen diffraction,
and the last term relates to the screen absorption, in which
I ef sI Y h d − =tan−1 ϕ , J ef y h l − =tan−1 rJ
ϕ . It can be seen from equation (12) that the total diffracted sound also depends on the sound reflection coefficient of the floor and the ceiling. When the reflection coefficients are zero, only direct sound diffraction exists between the source and the receiving point, which is the case discussed in Section 2.1. When the reflection coefficients are unity, depending on the position of the receiving point, the indirect sound diffraction could play an important role in the total diffracted sound.
It should be noted that for each image source I, since the direct propagation path from the source to the receiver is blocked by the screen, there should also exist a path for the
∑
⋅ + + = − + I p I B A jk I f I c t l d Y e Q Q c W p J I τ π ρ 2 2 ) ( ) 2 ( floor ) 2 ( ceil 2 1 0 0 ) ( 4 (13)where
τ
p is the sound pressure transmission coefficient. Normally, it is difficult to get thephase information of the transmission coefficient. However, if a high transmission loss screen is used, the contribution of this term can be neglected. Therefore, the insertion loss of a single screen in a flat room with the interference effects included (i.e. pr, pd and pt
are coherent) is,
+ + = t d r p p p p IL 20log 0 (14)
Note that for an engineering approach, 1/3 octave band analysis is widely adopted. If ∆
ω
represents the 1/3 octave bandwidth, the corresponding 1/3 octave band insertion loss can be obtained by using the following equation. + + ∆ ∆ =
∫
∫
∆ ∆ ω ω ω ω ω ω d p p p d p IL t d r 1 1 log 20 0 (15)3. Validation of the Model
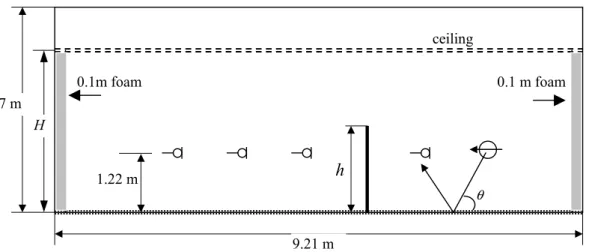
3.1. Test environmentTo verify the model developed above, a series of experiments were carried out at the Institute for Research in Construction, National Research Council Canada. Figure 5 shows the configuration of the test room. In the experiment, single screens with two heights, 1.22m, and 1.52 m were tested. The length of the screen is 4.66 m, which is the width of the room. The source and microphones are located along the center line of the room, and at a height of 1.22 m. The output power and the directivity of the sound source were measured in a reverberation chamber and an anechoic chamber respectively. All of the walls of the room are covered with 0.1 m thick absorbing foam. The empty room (without the screen) test results show that above 250 Hz, the influence of wall reflections can be neglected. Thus the experimental conditions were a good approximation to those of the two-dimensional analytical model.
Figure 5. The configuration of the test room.
θ 9.21 m 3.57 m h 1.22 m 0.1m foam 0.1 m foam ceiling H
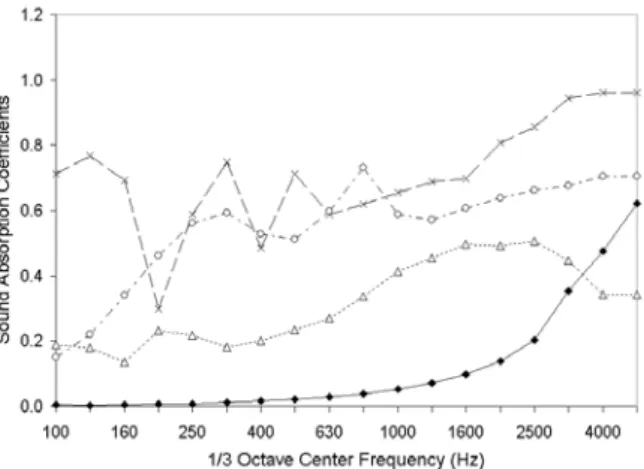
The floor of the test room was covered by a thin commercial carpet with SAA = 0.19. (SAA, the Sound absorption Average is the average of the 1/3 octave band absorption coefficients from 200 to 2500 Hz, ASTM C423-99). The normal specific acoustic impedance of the carpet (
ζ
f) was measured in an impedance tube. Therefore, the soundpressure reflection coefficients at a particular incident angle can be determined by using equation (16) and assuming the carpet to be locally reacting[16].
1 sin 1 sin + − = θ ζ θ ζ f f f Q (16)
Typical of most open-plan offices, the T-bar ceiling system of the test room was composed of ceiling tiles and a backing space, as shown in Figure 5. In these comparisons, two ceiling systems, 25 mm thick H-B-type high absorption ceiling tiles (SAA=0.97) with a backspace of 0.787 m, and 13 mm thick L-A-type low absorption ceiling tiles (SAA=0.67) with a backspace of 1.09 m, were examined. Since sound propagation may exist in the backspace, it is not appropriate to assume that the ceiling system is locally reacting. Normally for a non-locally reacting ceiling system, it is difficult to give a theoretical description for its sound absorption behaviour. However, if the ceiling tile can be assumed to be not moving, the specific acoustic impedance of the system for oblique incidence can be written as[17, 18],
L L c fb j L L c fb j c c c c γ θ ζ γ θ π γ θ ζ γ θ π ζ ζ cosh sin sinh sin 2 cot sinh sin cosh sin 2 cot 0 0 0 + − + − = (17)
where b is the depth of the space above the ceiling,
γ
is the sound propagation constant in the material, L is the thickness of the ceiling tile, andζ
c0is the normal specific acousticimpedance of the ceiling tile material. Then the corresponding sound pressure reflection coefficient Qc can be obtained using equation (16). Here
ζ
c0can be obtained bymeasuring two ceiling tile samples with different thicknesses separately in the impedance tube[18]. In Figure 6, the measured normal incidence absorption coefficients of the carpet and the two ceiling systems are shown.
Figure 6. Measured normal incidence absorption coefficients: ♦— carpet; ∆--- L-A type ceiling tiles with a backspace of 1.09 m; ×··· H-B type ceiling tiles with a backspace of 0.787 m; ❡-·-·-·- foam on the screen.
Figure 7. The transmission loss of the OSB panel and the foam.
3.2. Experimental and predicted results
The single screen used in the experiments was the 13 mm OSB (Oriented Strand Board, surface density 8 kg/m2) panel covered with 50 mm thick sound absorbing foam. The sound pressure reflection coefficient of the foam Qs was determined using equation (16)
and by measuring the normal specific acoustic impedance in an impedance tube. The calculated normal incidence absorption coefficients of the foam are also shown in Figure 6. The transmission loss of the panel and the foam were separately measured according to ASTM E90 (1999) and shown in Figure 7. It can be seen that for a single layer OSB panel without absorbing foam, the transmission loss is about 10 dB higher than the diffraction loss over a single screen with an effective height of 0.31 m, which is the worst case studied here. Therefore, in the calculations, the sound transmission through the screen is neglected.
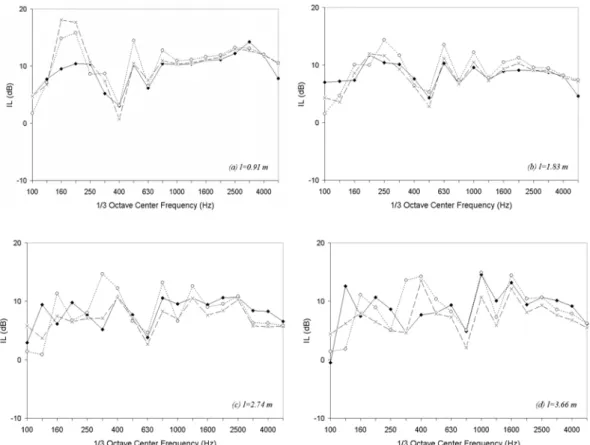
Figure 8 to Figure 11 compare the measured insertion losses at different positions behind the screen with those predicted by equation (15). Figures 8 and 9 show the cases of two different source positions, 0.91 m and 1.83 m away from a 1.52 m high screen, for L-A type ceiling tiles with a back space of 1.09 m. Figures 10 and 11 show the cases of two different screen heights, 1.22 m, 1.52 m, for H-B type ceiling tiles with a 0.787 m backspace. The agreement between the estimation and the measurement is generally quite good. As discussed in Section 3.1, the larger differences at low frequencies are thought to be due to the sound reflections from the walls of the test room. At mid to high frequencies, the errors may be caused by the estimates of the sound absorption coefficients of the ceiling systems. For example, the assumption, that the ceiling tile is not moving, made in calculating the sound reflection coefficients of the ceiling system, may not be completely valid for both types of ceiling tiles. For example, the error for H-B type ceiling tiles may be higher than that for L-A type ceiling tiles because H-B type ceiling tiles are lighter and softer than L-A type ceiling tiles and more likely to vibrate. Also, the different installation conditions of ceiling tiles in the test room may introduce some difference in the sound absorption coefficients relative to those obtained from the impedance tube measurements. However, as shown in the figures, the interference effects, indicated by the mid-frequency peaks and dips in these figures, are successfully
Figure 8. The insertion loss at different positions behind the screen: L-A type ceiling tiles with a back space of 1.09 m, d=0.91 m, h=1.52 m, H=2.44 m, s=1.22 m,
♦— experiment; ×--- prediction; ○LL prediction(two-path calculations).
Figure 9. The insertion loss at different positions behind the screen: L-A type ceiling tiles with a back space of 1.09 m, d=1.83 m, h=1.52 m, H=2.44 m, s=1.22 m,♦— experiment; ×--- prediction; ○LL prediction(two-path calculations).
Figure 10. The insertion loss at different positions behind the screen: H-B type ceiling tiles with a back space of 0.787 m, d=1.83 m, h=1.22 m, H=2.74 m, s=1.22 m,♦— experiment; ×--- prediction; ○LL prediction(two-path calculations).
Figure 11. The insertion loss at different positions behind the screen: H-B type ceiling tiles with a back space of 0.787 m, d=1.83 m, h=1.52 m, H=2.74 m, s=1.22 m,
estimated. The mean absolute errors in estimating the insertion losses above 250 Hz shown in Figures 8 to 11 are 1.3 dB, 1.6 dB, 1.8 dB, and 1.9 dB respectively.
Note that in previous practical calculations, single screen behavior in a flat room was mostly predicted based on the direct diffraction and the first ceiling reflection paths[7,14]. In order to show the benefits of considering higher order paths, the insertion losses of the screen based on the two-path model are also shown in Figures 8 to 11. The corresponding mean absolute errors above 250 Hz were a little larger for the simple two-path calculations in Figures 8 to 11 and are 1.8 dB, 2.0 dB, 2.1 dB, and 2.2 dB respectively. However, at some points in the mid and lower frequency range, below about 800 Hz the complete model led to larger improvements of up to 5-7 dB relative to the simpler model. This is primarily due to the inferior performance of ceiling absorption at lower frequencies, which makes sound reflection more efficient. Generally speaking, the higher order paths are more important for: low ceiling absorption, low ceiling heights, and source/receiver positions further away from the screen.
(a) (b)
Figure 12. The contribution of each image source at different positions behind the screen: H-B type ceiling tiles with a back space of 0.787 m, f=500 Hz; d=1.83 m, H=2.74 m, s=1.22 m, l=0.91 m; (a) h=1.22 m; (b) h=1.52 m,
, sound diffracted over the screen; , sound reflected over the screen,
3.3. Contributions of diffracted and reflected sound
In Section 2, it was argued that the sound generated by the source reaches the receiver in two different ways, by being diffracted over the screen and by being reflected from the ceiling over the screen. Also, it was shown that except for the distance between the source and the receiver, the sound reflected over the screen only depends on the floor and ceiling absorption, while the sound diffracted over the screen primarily depends on the effective screen height. Therefore theoretically, it is possible to separate the contribution
of the diffracted sound and the reflected sound in the total sound pressure level at the receiving point so that the design and renovation of a single screen in a flat room can be carried out more effectively.
In Figure 12(a), the contributions of 21 image sources to the sound pressure level at a position 0.91 m behind a 1.22 m high screen under H-B type ceiling tiles are shown for 500 Hz. The abscissa of the figure, the order of the image source, represents different image sources, for which zero represents the real source, and positive numbers correspond to image sources above the ceiling and negative numbers to those below the floor. It can be seen that as the image order |n| increases, the contributions decrease. This is simply because the ceiling and the floor are sound absorptive. After being reflected several times, either the diffracted sound or the reflected sound would loose considerable sound energy. Therefore, the two sound propagation paths, n=0, and n=1 which are the direct propagation path between the source and the receiver and the first reflection path from the ceiling respectively, are usually most important. From Figure12(a), it can be seen that the diffracted sound dominates the total sound pressure level at this position. Under this circumstance, if more attenuation behind the screen is required, one must first increase the screen height. Figure 12(b) shows the results for a 1.52 m high screen under the same ceiling condition. It can be seen that the diffracted sound has been successfully reduced. Obviously, if further attenuation is expected, both the screen height and the sound absorption of the ceiling tile have to be increased because the diffracted sound and the reflected sound contribute almost equally to the total sound pressure levels.
4. Conclusions
This paper describes the development and validation of an analytical model for an office screen (i.e. partial height partitions or panels) in the presence of a floor and a ceiling. A general model based on the image source method is presented. This model not only includes the effects of floor and ceiling reflections, but also takes the screen absorption, the sound transmission through the screen, and the interference between the sound waves into account. Moreover, this model is able to separate the contribution of reflected sound and diffracted sound from the total sound pressure level at the receiving point, which can indicate how best to improve the acoustical design of a single screen in a flat room. The mean differences between the predicted 1/3 octave band insertion loss values of the screen and the corresponding experimental results are generally within 2 dB.
Although the new model provides only small average improvements relative to a simpler two-path model, it is easily argued that such small average improvements are important in open office design. Larger errors were found at mid and lower frequencies and in general it is the largest errors that will create the more significant problems. Also, in typical open office situations, adequate speech privacy is usually only possible by careful optimisation of all details and hence all small improvements in the prediction model are important.
The model developed here has been used as the basis of a more extensive analysis of multi-screen structures in open-plan offices, which will be described in future publications.
Acknowledgements
This work is part of the COPE project supported by Public Works and Government Services Canada, Ontario Realty Corporation, USG Corporation, Natural Resources Canada, Steelcase, British Columbia Buildings Corporation, and The Building Technology Transfer Forum. The donation of ceiling tile material by USG Corporation and Ottawa Fibre was much appreciated. The authors would like to thank Mr.B.Biffard and Mr.S.Bumpus for their contributions to the experimental work of the project at NRC. Suggestions given by the members of the Cope Acoustics Team are appreciated. C. Wang also acknowledges receipt of a National Research Council Postdoctoral Fellowship for the pursuit of the study.
References
1. Maekawa, Z., 1968, “Noise reduction by screens”, Applied Acoustics, 1, pp157-173. 2. Pierce, A.D., 1974, “Diffraction of sound around corners and over wide barriers”,
Journal of the Acoustical Society of America, 55(5), pp941-955.
3. Butler, G.F., 1974, “A note on improving the attenuation given by a noise barrier”,
Journal of Sound and Vibration, 32(3), pp367-369.
4. Hayek, S.I., 1990, “Mathematical modeling of absorbent highway noise barriers”, Applied Acoustics, 31(1), pp77-100.
5. Lam, Y.W., 1994, “Using Maekawa’s chart to calculate finite length barrier insertion loss”, Applied Acoustics, 42, pp29-44.
6. Muradali, A. and Fyfe, K.R., 1998, “A study of 2D and 3D barrier insertion loss using improved diffraction-based method”, Applied Acoustics, 53, 49-75.
7. Warnock, A.C.C., 1978, “Studies of acoustical parameters in open-plan offices”,
Journal of the Acoustical Society of America, 63(3), pp832-840.
8. Moreland, J.B. and Musa, R.S., 1972, “The performance of acoustic barrier”,
Proceedings of Inter-noise72, Washington D.C., USA, pp95-104.
9. Kurze, U.J., 1985, “Scattering of sound in industrial spaces”, Journal of Sound and Vibration, 98(3), pp349-364.
10. Kotarbinska, E., 1988, “How to calculate the efficiency of an acoustic barrier in a flat room”, Applied Acoustics, 23, pp99-108.
11. Kurze, U.J. and Anderson, G.S., 1971, “Sound attenuation by barriers”, Applied Acoustics, 4, pp35-53.
12. Yamamoto, K. and Takagi, K., 1992, “Expressions of Maekawa’s chart for computation”, Applied Acoustics, 37, pp75-82.
13. Tatge, R.B., 1973, “Barrier-wall attenuation with a finite-sized source”, Journal of the Acoustical Society of America, 53, pp1317-1319.
14. Warnock, A.C.C., 1974, “Acoustical effects of screens in landscaped offices”,
Canadian Building Digest, 164, National Research Council of Canada.
15. Skudrzyk, E., 1971, The foundations of acoustics: basic mathematics and basic acoustics, Springer-Verlag, New York.
16. Kuttruff, H., 1973, Room acoustics, Applied Science Publishers LTD.
17. Ingard, K.U., 1994, Notes on sound absorption technology, Version 94-02, Noise Control Fundation, USA.18. Dunn, I.P. and Davern, W.A., 1986, “Calculation of acoustic impedance of multi-layer absorbers”, Applied Acoustics, 19, pp321-334.
18. Dunn, I.P. and Davern, W.A., 1986, “Calculation of acoustic impedance of multi-layer absorbers”, Applied Acoustics, 19, pp321-334.