Publisher’s version / Version de l'éditeur:
Surface and Interface Analysis, 30, 1, pp. 207-211, 2000-09-05
READ THESE TERMS AND CONDITIONS CAREFULLY BEFORE USING THIS WEBSITE. https://nrc-publications.canada.ca/eng/copyright
Vous avez des questions? Nous pouvons vous aider. Pour communiquer directement avec un auteur, consultez la
première page de la revue dans laquelle son article a été publié afin de trouver ses coordonnées. Si vous n’arrivez pas à les repérer, communiquez avec nous à [email protected].
Questions? Contact the NRC Publications Archive team at
[email protected]. If you wish to email the authors directly, please see the first page of the publication for their contact information.
NRC Publications Archive
Archives des publications du CNRC
This publication could be one of several versions: author’s original, accepted manuscript or the publisher’s version. / La version de cette publication peut être l’une des suivantes : la version prépublication de l’auteur, la version acceptée du manuscrit ou la version de l’éditeur.
For the publisher’s version, please access the DOI link below./ Pour consulter la version de l’éditeur, utilisez le lien DOI ci-dessous.
https://doi.org/10.1002/1096-9918(200008)
Access and use of this website and the material on it are subject to the Terms and Conditions set forth at
Surface chemistry of end cuts from Athabasca bitumen
Bensebaa, Farid; Kotlyar, Luba; Pleizier, Gerald; Sparks, Bryan; Deslandes,
Yves; Chung, Keng
https://publications-cnrc.canada.ca/fra/droits
L’accès à ce site Web et l’utilisation de son contenu sont assujettis aux conditions présentées dans le site LISEZ CES CONDITIONS ATTENTIVEMENT AVANT D’UTILISER CE SITE WEB.
NRC Publications Record / Notice d'Archives des publications de CNRC:
https://nrc-publications.canada.ca/eng/view/object/?id=465d9a4c-2ed8-41ed-b3b0-12585e80eb1d https://publications-cnrc.canada.ca/fra/voir/objet/?id=465d9a4c-2ed8-41ed-b3b0-12585e80eb1d
Surface chemistry of end cuts from Athabasca
bitumen
Farid Bensebaa,1 * Luba Kotlyar,1 Gerald Pleizier,1 Bryan Sparks,1 Yves Deslandes1 and Keng Chung21Institute for Chemical Process and Environmental Technology, National Research Council, 1500 Montreal Rd, Ottawa,
Ontario, Canada, K1A OR6
2Syncrude Canada Ltd., Edmonton Research Centre Edmonton, Alberta, Canada, T6N 1H4
Bitumen components, responsible for various processing problems, were analysed with x-ray photoelectron spectroscopy (XPS), time-of-flight secondary ion mass spectrometry (ToF-SIMS) and photoacoustic Fourier transform infrared spectrometry (PAS – FTIR). These methods were selected because they can probe surfaces to different depths: ToF-SIMS explores the surface to a depth of ~1 nm; XPS analyses a surface layer 7 nm deep; and PAS – FTIR probes layers several micrometres thick. Copyright 2000 John Wiley & Sons, Ltd.
KEYWORDS: bitumen; end cut; surface; XPS; ToF-SIMS; FTIR
INTRODUCTION
Bitumen from Athabasca oil sands exhibits unique beha-viour during conversion to useful hydrocarbon products. This problem has been associated with a heavy residuum comprising as much as 50 wt.% of the bitumen. The key to optimizing the yield of commercially useful products is a better understanding of the complex chemistry involved. The approach1,2 adopted is based on the application of
supercritical fluid extraction (SCFE) with pentane to sep-arate bitumen into a number of narrow fractions with increasingly higher molecular weight. An insoluble end-cut (EC) fraction, boiling at C524°C, is believed to be the most intractable portion of bitumen during process-ing. This fraction quickly contaminates surfaces, resulting in a rapid loss of catalyst activity during hydrotreatment of bitumen. The high coke-forming propensity exhibited by bitumen during thermal treatment has also been linked with this heavy fraction.1
Solids closely associated with bitumen (BS) accumu-late with the EC3,4 because of the organic matter strongly
bound to particle surfaces. During bitumen coking, most of the BS material is laid down with the coke, con-tributing to fouling in the reactor systems. Also, ultrafine ⊲<0.3 µm⊳ BS particles may become entrained in the volatile overhead liquids, causing corrosion and fouling in downstream process units.
The surface properties of these materials play an impor-tant role in various separation processes. In particular, one of the objectives of this work was to achieve a better understanding of the role of BS material in determin-ing the surface properties of the EC fraction. In order to achieve this, a detailed characterization of organic and inorganic surface material is required. A number of com-plementary analytical techniques are now available to
* Correspondence to: F. Bensebaa, Institute for Chemical Process and Environmental Technology, National Research Council, 1500 Mon-treal Rd, Ottawa, Ontario, Canada, K1A OR6.
Contract/grant sponsor: National Research Council of Canada.
probe solid surfaces to different depths. X-ray photoelec-tron spectroscopy has been used widely to analyse the surface chemistry of materials.5However, XPS alone
can-not provide all of the information needed because it is unable to differentiate clearly between aliphatic and aro-matic carbons. Also, XPS probes a layer ¾7 nm thick and if the very top surface is drastically different from the rest of the sample some information may be lost. On the other hand, the presence of only a few additional functional groups on the top layer can make a significant difference to the XPS spectral data. Both time-of-flight secondary ion mass spectrometry (ToF-SIMS) and photoacoustic Fourier transform infrared spectrometry (PAS–FTIR) can be used to complement the XPS findings: ToF-SIMS is a technique that probes a layer ¾1 nm deep on material surfaces6 – 9
and is several orders of magnitude more sensitive than XPS; PAS–FTIR can probe layers up to a few microme-tres thick and is particularly suitable for the characteri-zation of powder samples with strong infrared absorption characteristics. The PAS–FTIR technique directly probes chemical bonds and provides information on composition, structure and even conformation. The technique is espe-cially appealing because it requires no vacuum or special sample preparation.10
EXPERIMENTAL
The EC sample was the residue remaining after SCFE of virgin bitumen pitch using a procedure described elsewhere.1
It was provided by Syncrude Research Ltd. To separate the EC into BS and hydrocarbon portions (pentane-insoluble bitumen, PIB), ¾5 wt.% toluene solu-tions of the EC were prepared and subjected to high-speed centrifugation at 366 000 g for 1 h to give a solid-free sample. Prior to characterization, the recovered BS was washed free of bitumen by repeated treatments with a mixture of toluene and water until the toluene phase was free of colour. The EC solutions in toluene were loaded into 600 ml glass tubes and desolvated at 80°C for 2.5 h
208 F. BENSEBAA ET AL.
under a vacuum of 80 kPa and with a vortex speed of 28 cycles per minute.
The XPS data were obtained with a Kratos Axis HS x-ray photoelectron spectrometer (Kratos, UK). The size of the analysed area was ¾1 mm2
. Monochromatized Al K˛ radiation was used for excitation and a 180°
hemispherical analyser with a three-channel detector was employed. The x-ray gun was operated at 15 kV and 20 mA. High-resolution XPS spectra were collected using 40 eV pass energy. An electron flood gun neutralized sample charging during the experiment. The ToF-SIMS spectra were obtained with a Kratos Prism instrument (Kratos, UK). The sample was bombarded with 25 keV GaC
ions; the current was <1 ð 10 9A. The total primary
ion dose was always <1012
ions cm 2
, which is within the static limit for SIMS experiments. Charge neutralization was accomplished by means of a beam of electrons. Sur-vey and high-resolution ToF-SIMS spectra were obtained using resolution times of 10 ns and 1.25 ns, respectively. The PAS–FTIR spectra were recorded with a Bruker spec-trometer, model IFS 66. All spectra were recorded under the same conditions using an MTEC 100 photoacous-tic cell.
RESULTS AND DISCUSSION
X-ray photoelectron spectroscopy analysis
As shown in Table 1, carbon is the most abundant element of the EC and PIB samples. A large amount of oxygen is found in the BS sample. All three samples contain similar amounts of sulphur. Large amounts of Si and Al with relatively smaller amounts of Fe, K, Ca and Mg are detected in the BS sample. Trace amounts of Al and Si are detected from the EC sample.
Table 1. Relative concentrations obtained with high-resolution XPS Atomic % Elements PIB BS EC C 92.0 50.4 90.6 O 5.2 32.4 6.7 Si No peak 6.9 0.3 Al No peak 5.2 0.2 Fe No peak 0.4 No peak S 2.5 2.0 2.3 K No peak 0.9 No peak Ca No peak 0.4 No peak Na 0.2 1.1 No peak Mg No peak 0.3 No peak
Table 2. Binding energy (BE) and relative concentrations of the different carbon and sulphur components
BE Atomic %
Species (eV) PIB BS EC
C H and C C 283.5 283.9 88.5 44.8 83.6
C OH and C O C 285.2 286.4 2.4 3.3 3.5
C O and C(OH) O 287.1 288.7 1.2 2.0 3.5
Thiophene 162.6 163.0 2.5 1.3 2.3
SOx 167.2 167.8 No peak 0.7 No peak
The XPS peak for the carbon photoelectron shows an envelope that can be curve fitted into a series of peaks corresponding to different functional groups. The results of such deconvolution are presented in Table 2. Binding energy (BE) data shown in Table 2 were not referenced. However, the charging shift has been taken into account by setting the C 1s peak to 285 eV to determine the oxidation states of the elements. The peaks at the lowest binding energy (283.5–293.9 eV) are assigned to carbon atoms linked only to other carbons (C –C) or hydrogen atoms (C–H). The peak shifted by ¾1.5 eV corresponds to carbon atoms linked to carbon or hydrogen atoms and one oxygen atom via a single bond (C –OH or C–O–C). Carbon peaks corresponding to carbonyl (C O) and acid or ester (O–C O) functions are shifted from the C –C peak by about 3 and 4 eV, respectively.
Contributions to the oxygen may be from either organic or inorganic components. The ‘organic’ oxygen, i.e. oxy-gen linked to carbon, is estimated from the relative con-tribution of the ‘CO’ component to the total carbon peak. Table 2 shows that the total atomic concentrations of car-bon linked to oxygen are 5.3 and 7.0 for BS and EC, respectively. Although these results may be overestimated, because they include inorganic ‘CO’, e.g. from CaCO3, it
should be noted that no calcium is detected on either the PIB or EC sample and there is only 0.4% in the BS sam-ple. Thus, the main contribution to the oxygen content is from inorganic components in the case of the BS sample. Thus, contrary to the EC and PIB samples, the BS sample is dominated by inorganic-type oxygen.
The CO/CC ratio appears to be useful for qualitative comparison between unknown and standard samples; val-ues of the ratio for PIB, BS and EC samples are estimated to be 0.04, 0.12 and 0.08, respectively. These results indi-cate that in terms of concentration of carbon linked to oxygen the composition of the organic matter associated with the EC sample falls between the PIB and the BS compositions.
As shown in Table 2, two S 2p peaks are detected from the BS sample. These two peaks, separated by >4 eV, are attributed to two chemically different sulphur states. The sulphur peak at 167 eV is attributed to sulphoxide groups.11 – 13
However, recent theoretical calculations have assigned the S 2p peak of fuel coke, with a similar BE, to sulphur atoms directly linked to more than one carbon.12
The second peak at 163 eV is assigned to thiophenic sulphur.12
The PIB and EC samples contain only one type of sulphur. Based on the BE values of Fe 2p, Si 2p and Al 2s photoelectrons, we conclude that Fe, Si and Al atoms are linked to at least one oxygen atom.
In summary, data from XPS probes of the surface layer, 7 nm deep, indicate that: the organic matter on the EC sample is quite similar but not the same as that of the PIB sample; Si and Al are found in the EC sample but not in the PIB sample; there are more CO functional groups in the EC than in the PIB sample; and whereas carbon is by far the dominant contributor to the PIB and EC elemental composition, carbon, oxygen and the mineral elements constitute the bulk of the surface composition of the BS sample.
Time-of-flight SIMS analysis
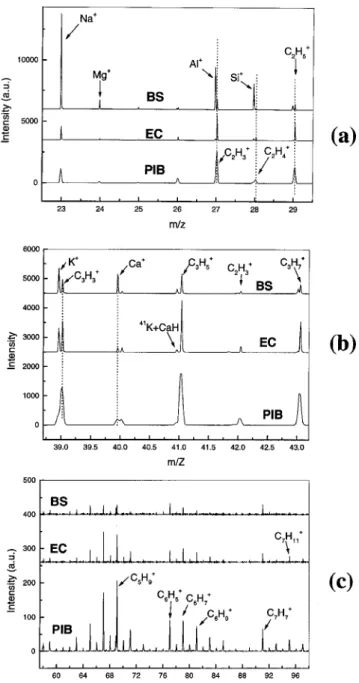
The ToF-SIMS spectra for the PIB, EC and BS samples
are shown in Fig. 1. Spectra were run under high-resolution conditions for all samples except the PIB sam-ple. In order to differentiate between the samples, the spectra were divided into different mass ranges. Unless specified otherwise, the peak assignments are based on values published in reference handbooks.8,9
Figure 1(a) shows the presence of two mass peaks around 27 amu. The lower and higher mass peaks corre-spond to AlC
and C2H3 C
, respectively. Two distinct peaks are also observed around mass values of 28 and 29 amu. The mass peaks at 28 amu correspond to SiC
and C2H4 C
, whereas those around 29 amu are assigned to SiHC
and C2H5
C
. The dominance of the SiC
and AlC
mass peaks in the BS sample is consistent with the XPS data. The rel-ative intensity of AlC
and SiC
peaks is higher in the EC than in the PIB sample.
Contrary to XPS, ToF-SIMS shows the presence of K and Ca in both BS and EC samples [Fig. 1(b)]. Compared to the EC, the BS sample contains about two and five times more K and Ca, respectively. However, these two
Figure 1. The ToF-SIMS spectra for BS, EC and PIB samples.
mass peaks are not detected in the PIB sample. Strong FeC
and weak MnC
mass peaks are also detected in the BS sample around 55 and 56 amu, respectively (not shown). Weak FeC
and MnC
mass peaks are also detected in the EC but not from the PIB sample.
The major peaks at the nominal positions of 63, 65, 67, 69, 71, 77, 79, 81, 83, 91, 93 and 95 amu corre-spond to the fragments C5H3
C , C5H5 C , C5H7 C , C5H9 C C5H11 C C6H5 C , C6H7 C , C6H9 C , C6H11 C , C7H7 C , C7H9 C and C7H11 C
, respectively [Fig. 1(c)]. Although most of these peaks are found in the spectra for all three samples, they have different absolute intensities in each case. Most of these ion fragments contain one benzene group. The GaC
peak appearing at the nominal mass of 69 amu is attributed to primary ions from the gallium source. Around 73 amu, two mass peaks are detected for the BS sample. The lower mass peak is assigned to C3H9Si
C
. The higher mass peak observed also for the EC and PIB samples is assigned to C4H9O
C
.
Relatively intense peaks are also detected at the nominal positions of 115, 128, 129, 141 and 165 amu (not shown). These peaks are attributed to C9H7
C , C10H8 C , C10H9 C , C11H9 C and C13H9 C
ion fragments, respectively. Each of these ions contains at least two benzene rings. In this region, EC and PIB features are quite identical. The BS sample is slightly different from the two other samples in this mass region. A strong peak is observed around 149 amu for the BS sample. This peak is assigned to a phthalate fragment ⊲C8H5O3
C
⊳.
In summary, data from the ToF-SIMS probe of the surface layer, 1 nm deep, indicate that: the ToF-SIMS signature of the organic matter on the EC sample is quite similar to that of the PIB sample, however differences are also found, Al, K, Ca and Fe are found in the EC but not in the PIB sample; and the presence of both organic and inorganic fractions at the very top surface layers of confers a special struture to the BS and EC samples.
Photoacoustic Fourier transform infrared spectrometry analysis
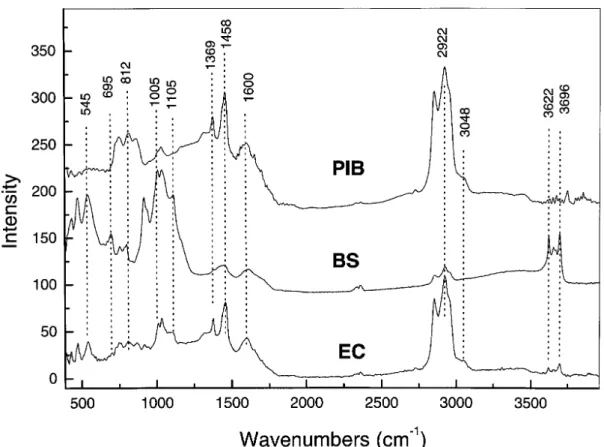
Figure 2 shows PAS–FTIR spectra for the PIB, BS and EC samples. Qualitative estimates for the various peak intensities are given in Table 3. Unless stated otherwise, all the peak assignments are based on previously published data.14 – 17
At very low wavenumbers, both BS and EC samples give rise to three intense peaks positioned at about 431, 471 and 545 cm 1; no such peaks are observed in the
PIB samples. These bands are much stronger in the case of the BS sample. In this spectral range, the vibrational band often involves an inorganic element such as Al or Si. Infrared peaks, attributed to Si–O–Al and Si–O vibra-tional modes, have been observed on the infrared spectrum of kaolinite at 432, 471 and 539 cm 1, respectively.16
Con-sequently, these features indicate the presence of kaolinite ⊲Al2Si2O5(OH)4⊳in both the EC and BS samples.
Strong peaks are observed in the 700–900 cm 1
range from the PIB, EC and BS samples. The out-of-plane –CH aromatic bending mode produces peaks at 744, 812 and 870 cm 1. The O–S–O vibrational mode may also
con-tribute to the peaks in this range. Indeed, this mode is probably the source of the peak at 695 cm 1
observed on the BS sample. This assignment is consistent with
210 F. BENSEBAA ET AL.
Figure 2. The PAS FTIR spectra for BS, EC and PIB samples.
Table 3. Prominent infrared peaks obtained with PAS– FTIR
Positiona Intensityb
(cm1) Proposed assignments PIB BS EC
3696, 3650, 3622 Al OH stretch (non-hydrogen bonded) np vs w 3300 OH stretch (hydrogen bonded) vw np m w 3048 C H stretch (aromatic; olifenic) w m np w 2922 CH stretch (aliphatic) vs m vs 2850 CH stretch (aliphatic) vs m vs 1600 C C stretch m s m m s 1458 CH2scissoring s vs m s 1369 CH3bending m w m 1314 Out-of-plane C H aromatic bend w np w 1105 Si O aliphatic np vs w 1005, 1028
SO, CO and CH modes m vs m s
913 Al OH/Si OH bending np vs np 870, 812, 744 Out-of-plane C H aromatic bend s w w 695 O S O stretch np w np 545, 471, 431 Si O Al; Si O np s w m
aAverage peak position.
bRelative band intensity: vs, very strong; s, strong; m, medium;
w, weak; vw, very weak; np no peak; sh, shoulder.
the presence of oxidised sulphur as detected by XPS. The presence of at least three out-of-plane –CH aro-matic bending peaks for the PIB sample indicates the
coexistence of monosubstituted, disubstituted and trisub-stituted benzene groups. These peaks are also observed on the EC sample, but they are much weaker. The peak at 870 cm 1
is not observed on the BS sample. A strong peak at 913 cm 1 is observed for the BS but not for the
PIB sample, corresponding to the OH bending mode from Al–OH and/or Si–OH groups.
The S O, C –O and Si–O stretching and –CH bending vibrational modes usually give rise to dominant peaks in the 1000–1100 cm 1
range. It is difficult to determine the exact origin of the peak in this spectral range. Very strong peaks are observed at 1005 and 1028 cm 1 for the BS
sample and similar but weaker peaks are detected for the PIB and EC samples. These peaks are probably due to SO stretching modes. However, a possible contribution from –CH and –CO vibrational modes cannot be ruled out. In this spectral range, –CH and –CO modes are the most likely contributor to the peaks detected for the PIB and EC samples. The strong peak shoulder at 1105 cm 1observed
for the BS sample corresponds to Si–O stretching. This peak is relatively weak in the case of the EC sample and it is not observed on the PIB spectrum.
The spectral range at 1300–1500 cm 1
is dominated by various –C –H and –C –O vibrational modes. The PIB and EC samples give rise to a medium peak at 1314 cm 1
attributed to the inplane –C –H aromatic bend. This peak is not present in the BS sample. The peaks at 1369 and 1458 cm 1 for the three samples are attributed to the
–CH3 bending and –CH2 scissoring modes, respectively.
These peaks are weak in the case of the BS sample. The relatively broad and intense peak at 1600 cm 1 for the
three samples is attributed to the C C stretching mode. The PIB and EC samples produced a relatively strong aliphatic –CH2 stretching band at 2850 cm 1 and
2922 cm 1
. The BS sample shows a similar band but with relatively low intensity. A medium-intensity peak shoulder is observed around 3048 cm 1
on the PIB and EC samples, but not on the BS sample. This peak is attributed to –CH stretching from aromatic groups. This indicates the presence of aromatic groups in the PIB and EC samples.
Finally, characteristic –OH stretching peaks are obser-ved around 3300 cm 1
on both the EC and BS samples. Based on the position of the band maximum and on the broadness of the peak it can be assigned to the hydrogen-bonded –OH stretching mode. No such peak was observed for the PIB sample. Three peaks assigned to free OH stretching are also observed at 3622, 3650 and 3696 cm 1
on both the EC and BS samples. These bands are much stronger in the case of the BS sample.
In summary, data from the PAS–FTIR probe of the surface layer, several micrometres deep, indicate that: the PIB sample is more aromatic than the EC sample; contrary to the PIB sample, a kaolinite-like structure was found in both the BS and EC samples; and Free OH stretching peaks are observed in both the BS and EC samples but not in the PIB sample.
CONCLUSIONS
It has been demonstrated that the XPS, ToF-SIMS and PAS–FTIR analytical methods complement each other to provide detailed information on EC samples from bitu-men. There is no indication about any difference between surface and bulk compositions. Although carbon repre-sents >90% of the EC surface composition, the very top layer of this sample also contains inorganic elements. Indeed, the EC sample contains mineral elements at con-centrations less than in the BS sample but much more than in the PIB sample. The BS surfaces are dominated by Al, Si, Mn and Fe, conferring bi-wettable characteristics to this sample. In addition, the results show that the presence of BS affects any analytical measurements performed on the PIB sample for the purpose of characterization. Con-sequently, such solids must be removed quantitatively in order to permit meaningful comparisons between compo-sition data for samples from various origins, or prepared by different methods.
Acknowledgement
This work was supported by the National Research Council of Canada.
REFERENCES
1. Chung KH, Xu C, Hu Y, Wang R.Oil Gas J.1997; Jan.
2. Chung KH, Xu C, Gray M, Zhao Y, Kotlyar LS, Sparks BD.
Rev. Process Chem. Eng.1998; 1: 41.
3. Kotlyar LS, Sparks BD, Woods J, Raymond S, Le Page Y,
Shelfantook W.Petrol. Sci. Technol.1998; 16: 1.
4. Kotlyar LS, Sparks BD, Woods JR, Chung KH.Energy Fuel
1999; 13: 346.
5. Ratner BD, Castner DG. InSurface Analysis, Vickerman JC
(ed). Wiley: Chichester, 1997.
6. Beninghoven A.Angew. Chem. Int. Ed. Engl.1994; 33: 1023.
7. Briggs D.Surf. Interface Anal.1986; 9: 391.
8. Briggs D, Brown A, Vickerman JC. Handbook of Static
Secondary Ion Mass Spectrometry. Wiley: New York, 1989.
9. Newman JC, Carlson BA, Michael RS, Hohlt TAH. Static
SIMS Handbook of Polymer Analysis. Perkin-Elmer: Eden Pranic, MN, 1991.
10. McClelland JF, Jones RW, Luo S, Seaverson LM. InPractical
Sampling Techniques for Infrared Analysis, Coleman PB (ed). CRC Press: Boca Raton, FL, 1993.
11. Bensebaa F, Zhou Y, Deslandes Y, Kruus E, Ellis TH.Surf.
Sci. Lett.1998; 405: L472.
12. Jimenez Mateos JM, Fierro JLG.Surf. Interface Anal.1996;
24: 223.
13. Moulder JF, Stickle PE, Sobol PE, Bomben KD.Handbook
of X-Ray Photoelectron Spectroscopy. Perkin-Elmer: Eden Pranic, MN, 1992.
14. Gerasimowicz WV, Byler DM.Soil Sci.1985; 139: 270.
15. Lin-Vien D, Colthup NB, Fateley WG, Grasselli JG.Handbook
of Infrared and Raman Characteristics Frequencies of Organics Molecules. Academic Press: New York, 1991.
16. Van der Marel HW, Beutelspacher H.Atlas of Infrared
Spec-troscopy of Clay Minerals and their Admixtures. Elsevier: Amsterdam, 1976; 76.