HAL Id: hal-00881804
https://hal.inria.fr/hal-00881804
Submitted on 9 Nov 2013
HAL is a multi-disciplinary open access
archive for the deposit and dissemination of
sci-entific research documents, whether they are
pub-lished or not. The documents may come from
teaching and research institutions in France or
abroad, or from public or private research centers.
L’archive ouverte pluridisciplinaire HAL, est
destinée au dépôt et à la diffusion de documents
scientifiques de niveau recherche, publiés ou non,
émanant des établissements d’enseignement et de
recherche français ou étrangers, des laboratoires
publics ou privés.
RECAST: Telling Apart Social and Random
Relationships in Dynamic Networks
Pedro O.S. Vaz de Melo, Aline Carneiro Viana, Marco Fiore, Katia
Jaffrès-Runser, Frédéric Le Mouël, Antonio A. F. Loureiro
To cite this version:
Pedro O.S. Vaz de Melo, Aline Carneiro Viana, Marco Fiore, Katia Jaffrès-Runser, Frédéric Le Mouël,
et al.. RECAST: Telling Apart Social and Random Relationships in Dynamic Networks. 16th ACM
International Conference on Modeling, Analysis and Simulation of Wireless and Mobile Systems
(MSWiM ’13), Nov 2013, Barcelona, Spain. pp.327-334, �10.1145/2507924.2507950�. �hal-00881804�
RECAST: Telling Apart Social and
Random Relationships in Dynamic Networks
Pedro Olmo Vaz de Melo
Universidade Federal de Minas Gerais, Brazil
[email protected]
Aline C. Viana
INRIA, France[email protected]
Marco Fiore
IEIIT - CNR, Italy[email protected]
Katia Jaffrès-Runser
University of Toulouse, IRIT, France[email protected]
Frederic Le Mouël
INSA Lyon, France
[email protected]
Antonio A. F. Loureiro
Universidade Federal de Minas Gerais, Brazil
[email protected]
ABSTRACT
In this paper, we argue that the ability to accurately spot random and social relationships in dynamic networks is essential to net-work applications that rely on human routines, such as, e.g., op-portunistic routing. We thus propose a strategy to analyze users’ interactions in mobile networks where users act according to their interests and activity dynamics. Our strategy, named Random
rE-lationship ClASsifier sTrategy (RECAST), allows classifying users’ wireless interactions, separating random interactions from differ-ent kinds of social ties. To that end, RECAST observes how the real system differs from an equivalent one where entities’ decisions are completely random. We evaluate the effectiveness of the RE-CAST classification on real-world user contact datasets collected in diverse networking contexts. Our analysis unveils significant dif-ferences among the dynamics of users’ wireless interactions in the datasets, which we leverage to unveil the impact of social ties on opportunistic routing.
Categories and Subject Descriptors
H.2.8 [Database Management]: Database Applications—Data
Mining; I.6.4 [Simulation and Modeling]: Model Validation and Analysis
Keywords
dynamic social networks; edge classification
1.
INTRODUCTION
Recent studies have analyzed data generated from mobile in-dividuals in urban regions, such as cab drivers in San Francisco (USA) [1] or students in large campuses [2, 3]. Particular attention has been paid to the dynamics of user movement, whose real-world complexity cannot be fully captured through synthetic models. In-deed, understanding user mobility is of fundamental importance Permission to make digital or hard copies of all or part of this work for personal or classroom use is granted without fee provided that copies are not made or distributed for profit or commercial advantage and that copies bear this notice and the full cita-tion on the first page. Copyrights for components of this work owned by others than ACM must be honored. Abstracting with credit is permitted. To copy otherwise, or re-publish, to post on servers or to redistribute to lists, requires prior specific permission and/or a fee. Request permissions from [email protected].
MSWiM’13,November 3–8, 2013, Barcelona, Spain. Copyright 2013 ACM 978-1-4503-2353-6/13/11 ...$15.00. http://dx.doi.org/10.1145/2507924.2507950.
when designing new communication protocols that exploit oppor-tunistic encounters among users. In this case, the problem mainly lies in correctly forecasting future contacts. To that end, the regu-larity of daily activities comes in handy, as it enforces periodic (and thus predictable) space-time patterns in human mobility [4]. Build-ing on such a feature, protocols have been designed to estimate the potential of mobile users to act as data forwarders, mainly leverag-ing complex network analysis metrics such as centrality measures. Although human behavior is characterized by an elevated rate of regularity, random events are always possible in the routines of in-dividuals. Those are hardly predictable situations that deviate from the regular pattern and are unlikely to repeat in the future; they originate from the fact that users are reasonable beings, whose con-nections represent decisions they take based on their personal mo-tivations [5], which may also change over time. We refer to contact networks deriving from systems where users are reasonable beings as Dynamic Complex Wireless Networks (DCWN). For instance, a contact network composed of wireless hand-held devices is a clear example of DCWN, since the user mobility creates neither purely regular nor purely random connections among the entities compos-ing the network.
The random events in DCWNs veil the ordinary patterns by in-troducing a significant amount of noise, thus making the process of knowledge discovery in such datasets a complex task. There-fore, the ability to accurately identify random and social events in DCWNs is essential to social analysis and to applications that rely on a precise description of human routines, such as recommenda-tion systems, forwarding strategies and opportunistic disseminarecommenda-tion protocols.
In this paper, we propose a Random rElationship ClASsifier
sTrategy (RECAST)to classify relationships among users so as to spot contacts due to random events in DCWNs. To that end, RE-CAST examines how the real system would evolve if users’ deci-sions were random. More precisely, we use the temporal graph originated from the real network dataset and a random counter-part of the same to tell acounter-part edges representing random events from those created by actual social relationships, such as friend-ship or professional interactions. RECAST has a single and intu-itive parameter, which makes it preferable to conventional methods for filtering and cleaning social network data that require arbitrary thresholds, many parameters, and often a deep knowledge of the system.
• We introduce RECAST, a simple yet very effective way of classifying wireless contacts by leveraging metrics that re-flect two major features of social networks: frequent user encounters and shared acquaintances.
• We unveil the large differences among contact datasets, and claim that conclusions drawn from evaluating a single dataset should not be generalized; rather, the validation of network-ing protocols or services has to consider different types of datasets.
• We show that the knowledge of the wireless relationship a pair of users share can be leveraged for the design of oppor-tunistic routing schemes.
The paper is organized as follows. Section 2 discusses the re-lated work. Section 3 details the design behind RECAST. Section 4 shows how we model real-world network traces into complex tem-poral networks. Section 5 details the RECAST implementation. Section 6 shows how RECAST can improve opportunistic routing solutions. Finally, conclusions are drawn in Section 7.
2.
RELATED WORK
Social network analysis builds on the high predictability of hu-man behaviors [6], which are mostly driven by regular, routine activities. As a consequence, connections among social network nodes can be modeled by mechanisms such as preferential attach-ment [7] and triangle formation [5], that leverages the existence of communities or highly connected hubs [8] in the network. This makes social networks different from random ones, such as the Erd˝os and Rényi network [9], where node connections are purely stochastic, being determined by a constant probability.
Given this predictability, social ties have been widely exploited in opportunistic mobile networks so as to favor network services. The considered problems range from multi-hop message forward-ing [10] and multicastforward-ing [11], to network security [12]. To the best of our knowledge, the works of Miklas et al. [13] and Zyba et al. [14] are those most closely related to ours. These studies differ in that they classify either users or their interactions (i.e., vertices and edges in the social graph), respectively. Zyba et al. distinguish social and vagabond users according to their social mobility behav-ior. They analyze regularity of appearance and duration of visits in a given area of traces to sort out users. Hence, the resulting classi-fication only works on a per-individual per-area basis. Miklas et al. classify links between friends and strangers. They assume that fre-quent pairwise node encounters represent friendship interactions, and empirically decide that pairs of users meeting 10 days or more out of 101 days are friends, whereas others are strangers.
Overall, our work extends the investigations in [13, 14] in the following ways. First, we propose a finer grained classifier, able not only to clearly characterize random interactions, but also to identify different kinds of social interactions: Friends, Acquaintances and
Bridges. As such, we go a step further than [13] as we are able to identify edges corresponding to, e.g., familiar strangers, as defined by Milgram [15]: indeed, the users sharing a bridge interaction repeatedly encounter but may never experience an explicit social relationship. In addition, unlike the proposal by Zyba et al. [14], our strategy has no geographical dependency, i.e., it is of general validity.
3.
RATIONALE
We consider social networks composed of individuals who are wirelessly connected over time. Such wireless encounters in these
networks are driven by behaviors that tend: (i) to be regular and to repeat periodically; (ii) to build persistent communities of individu-als or to generate commons acquaintances between them. The clas-sification strategy we present in this paper leverages these two be-haviors to efficiently distinguish social from random encounters in DCWNs. In the following, we detail our methodology and present the real world datasets considered in our analysis.
Social vs. random interactions: In DCWNs, interactions among the system entities are usually a consequence of semi-rational deci-sions. We say “usually” and “semi-rational” decisions because any system is subject to random events and irrational choices. Never-theless, because most of the interactions still arise from conscious decisions made by their entities, the evolution of DCWNs is sig-nificantly different from the evolution of random networks, e.g., Erd˝os and Rényi networks [9]. Indeed, while in DCWNs the edges are created from semi-rational decisions, which tend to be regular and to repeat over time, in a random network the edges are
cre-ated independently of the attributes of the network entities, i.e., the probability of connecting any two entities is always the same.
More formally, an individual may execute a social decision, or a random decision. Intuitively, if its probability of performing a social decision is greater than its probability of a random one, the network evolves to a well-structured social network. If the opposite it true, the network evolves as a random network, such as the Erdös and Rényi one.
Differentiating social from random network: The second ma-jor feature of DCWNs that we exploit in our study is the presence of communities, i.e., groups of individuals who are strongly con-nected to each other because they share the same interests or ac-tivity dynamics [5]. In contrast, communities can not be found in random networks where, as previously stated, edges are created stochastically and independently of the attributes of each node.
The network clustering coefficient has been widely used to dis-criminate random from social networks. Given an undirected graph G(V, E) (where V represents the set of network graph nodes, e.g.,
individuals, andE is the set of links describing relationships among
entities, e.g., contacts among individuals), the clustering
coeffi-cient cci measures the probability that two neighbors of a node
i are also connected among them. Formally, it is calculated as
cci= 2|Ei|/|Ni|(|Ni| − 1), where Niis the set of neighbors ofi,
Eiis the set of edges between nodes inNiand| · | is the cardinality
of the included set. The clustering coefficientcc of the whole
net-work is the average of all node clustering coefficientscci, ∀i ∈ V .
By introducing the equivalent random networkGR
as the ran-dom network constructed with the same number of nodes, edges
and empirical degree distribution of its real world counterpartG,
Watts and Strogatz [16] show that the clustering coefficient of a
social networkG is one order of magnitude higher than the
clus-tering coefficient ofGR. Thus, when a given networkG exhibits
a clustering coefficient that is significantly (i.e., orders of
magni-tude) higher than that of its random equivalent GR, then we can
state that (part of) the decisions made by the entities that compose
the network graphG are non-random.
Real-world DCWN datasets: Our evaluations are performed on three real-world datasets (also referred to as traces in the following) that describe movements of entities in campus and city scenarios.
The Dartmouth dataset [3] is a mobility trace of more than1, 000
individuals in the university campus, recorded over eight weeks us-ing WiFi network access information. The USC dataset [2] is also a mobility trace in a campus scenario, comprising movement
infor-mation of more than4, 000 individuals over eight weeks, again
col-lected through WiFi access. Finally, the San Francisco dataset [1]
USA, over one month, gathered through GPS logging at each cab in the urban area. For both the Dartmouth and USC traces, two indi-viduals are assumed to generate a contact if they are using the same WiFi access point to connect to the wireless network on campus. In the San Francisco trace, two taxis are in contact if their distance is
lower than250 meters. Extensive experimental analysis in [17]
shows that a distance of250m grants a 50% packet delivery ratio
in urban environments, under common power levels (15-20 dBm) and with robust modulations (3-Mbps BPSK and 6-Mbps QPSK). In all cases, the contact events between two individuals are traced using start date of contact and its duration. Table 1 summarizes the features of the different datasets.
4.
MODELING
This section introduces the basic operations performed on the dataset before RECAST is executed. Section 4.1 shows how we model the dynamic DCWN as a temporal aggregation graph. Sec-tion 4.2 details the algorithm we employ to obtain the equivalent random graph of a given temporal aggregation graph, and discusses how these two graphs compare in terms of clustering coefficient.
4.1
Temporal Aggregation Graph
As previously discussed, the datasets we employ list contacts among individuals or vehicles, and associate to each encounter a start time and a duration. In order to generate the temporal graph,
we discretize time into steps of durationδ1
, and represent all the
encounters occurring at time stepk as a graph Gk(Vk, Ek). The set
of verticesVkis composed of all network nodes (i.e., individuals
or vehicles) involved in a contact during thek-th time step, while
the edges in the setEkrepresent the pairwise contacts during the
same time step. Therefore, an edge between two nodesi and j,
withi, j ∈ Vk, exists inEkifi and j have met during time step k.
We can then define a time varying representation of the DCWN
using a temporal accumulation graphGt = (Vt, Et). Formally,
Gt = {G1∪ G2 ∪ ... ∪ Gt}. As such, Vt (respectivelyEt) is
the set of all vertices (edges) that appeared in the dataset between
time 0 and time stept included. Note that Gt evolves over time
and aggregates all the contacts in the dataset, thus comprising both social encounters and random encounters between network entities.
4.2
Comparison with Random Graphs
The first step to analyze the mobility patterns of the temporal
accumulation graphGt is to build its random versionGRt. The
latter must feature similar topological characteristics as the original
Gt graph, i.e., the same number of nodes, edges, and empirical
degree distribution. That way, the only difference betweenGtand
GR
t lies in the way nodes are connected to each other. While inGt
the nodes connect in a “semi-rational” way, inGR
t the connections
happen in a purely random fashion. As we will show later, this difference can be leveraged to accurately determine the extent of randomness in the mobility of individuals in DCWNs.
We use two algorithms to to generate GR
t fromGt. The first
algorithm, which we will call RND, is well known in the
net-work science community [18]. The algorithmGR
=RND (G)
re-ceives a graphG(V, E) as a parameter and returns a random graph
GR(V, ER) with the same topological characteristics as G, i.e.,
the same number of nodes, number of edges and degree distribu-tion. In this way, we guarantee that the only difference between
the real graphG and GR is to whom each node connects, that is
the focus of our analysis. Thus, given the degree distributionD =
1
In our study, we considered a duration ofδ = 1 day, since the data
sets originate from human activities that feature daily routines.
(d1, d2, . . . , dn) of G with n nodes, this algorithm assigns an edge
between nodesi and j with probability pij= (di× dj)/!|V |k=1dk.
The second algorithm, which we call T-RND, is an extension of RND and is able to generate random graphs from a temporal
network Gt. As mentioned in Section 4.1, the temporal
aggre-gation graphGt = {G1 ∪ G2 ∪ . . . ∪ Gt} is the union of event
graphsGt. Thus, the algorithmGRt =T-RND (G1, G2, . . . , Gt)
re-ceives as parameters a set of consecutive event graphsGtand
re-turns a random temporal graphGR
t. It constructsGRt by executing
RND in each event graph Gtand then aggregating it in a way that
GR
t = {RND(G1) ∪ RND(G2) ∪ . . . ∪ RND(Gt)}. In summary, both
RND and T-RND randomly replicate the total number of contacts with distinct persons each individual had in a given time snapshot.
We first demonstrate the analytical power of random comparison in Figure 1, where we show the behavior of the clustering
coeffi-cient for graphsGt andGRt over time for the three analyzed
net-works. As we have previously mentioned, the clustering coefficient is a good metric to differentiate social networks from random net-works. As we observe in Figure 1-a, for the Dartmouth dataset,
the clustering coefficient ofGtandGRt are different in orders of
magnitude over the first days. However, as time goes by, their val-ues get closer, as random encounters grow in number and tend to veil the social network structure. On the other hand, as we see in
Figure 1-b, the clustering coefficients ofGtandGRt for the USC
dataset are almost constant over time. However, the difference be-tween them is not exceedingly high, since they have the same order of magnitude. We discuss these differences in detail later on.
Finally, as we observe in Figure 1-c, the clustering coefficients of the San Francisco networks are practically the same, being close
to1. In fact, after a few hours, the network becomes similar to
a clique, indicating a global high mobility, allowing each individ-ual taxi encountering most of the other taxis at some point of the
day. Formally, this indicates thatGtandGRt are very similar for
the San Francisco dataset, i.e., the probability of random encoun-ters is much higher than the probability of social contacts, what makes the San Francisco network similar to a random mobile net-work. This makes sense since taxis’ decisions depend on occa-sional customers’ requests rather than on routine mobility patterns of the driver.
5.
CLASSIFIER
In this section, we describe the Random rElationship
ClASsi-fier sTrategy (RECAST)we propose to differentiate relationships among individuals in a social network. More precisely, the purpose of RECAST is to tell apart random interactions from social-driven ones. To that end, Section 5.1 presents the DCWN features used by RECAST. Then, Section 5.2 introduces the RECAST algorithm and, finally, Section 5.3 discusses the results obtained by applying RECAST to the previously introduced datasets.
5.1
Social Networks Features
In order to identify social relationships, we must point out which features distinguish a social relationship from a random one. In-deed, two characteristics are always present in social relation-ships [19]:
1. Regularity. It is well known that social relationships are regular, in that they repeat over time. If two individuals are, for example, friends, co-workers, or daily commuters, they see each other regularly.
2. Similarity. It is expected that two individuals who share a social relationship have common acquaintances between
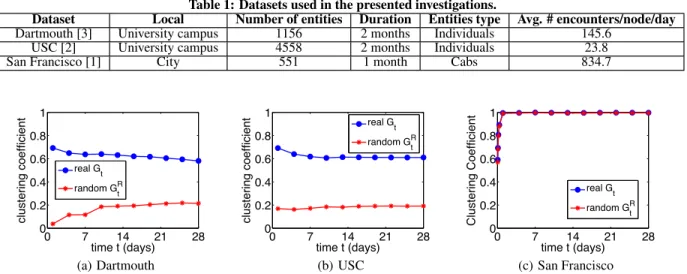
Table 1: Datasets used in the presented investigations.
Dataset Local Number of entities Duration Entities type Avg. # encounters/node/day
Dartmouth [3] University campus 1156 2 months Individuals 145.6
USC [2] University campus 4558 2 months Individuals 23.8
San Francisco [1] City 551 1 month Cabs 834.7
0 7 14 21 28 0 0.2 0.4 0.6 0.8 1 time t (days) clustering coefficient real G t random GtR (a) Dartmouth 0 7 14 21 28 0 0.2 0.4 0.6 0.8 1 time t (days) clustering coefficient real Gt random GtR (b) USC 0 7 14 21 28 0 0.2 0.4 0.6 0.8 1 time t (days) Clustering Coefficient real Gt random GtR (c) San Francisco
Figure 1: Evolution of the clustering coefficient in theGtof the three datasets, and in their random equivalentsGRt.
them. As an example, two individuals who share a large number of friends will most probably know each other as well.
Regularityand Similarity can be mapped into DCWN features
that, in turn, can be computed from a contact dataset so as to iden-tify what kind of relationship two individuals share. In the follow-ing, we discuss such features.
5.1.1
Edge Persistence
A complex network metric mapping of the Regularity of a re-lationship is the edge persistence. Basically, considering the set of
event graphs{G1, . . . , Gt}2, the edge persistencepert(i, j)
mea-sures the percentage of times the edge (i, j) occurred over the
past discrete time steps 1, 2, . . . , t. Formally, it is defined as
pert(i, j) = 1t!tk=1 [(i,j)∈Ek], where [(i,j)∈Ek] is an
indica-tor function that assumes value1 if the edge (i, j) exists in Ekat
timek, and 0 otherwise.
For instance, assuming that each day of the week is a time step, if Smith and Johnson met each other twice in a week, their edge per-sistence is the number of times they encountered, i.e., 2, divided by
the total number of time steps, i.e., 7, orpert=7(Smith, Johnson) =
2/7. The edge persistence allows spotting regular relationships be-tween two entities.
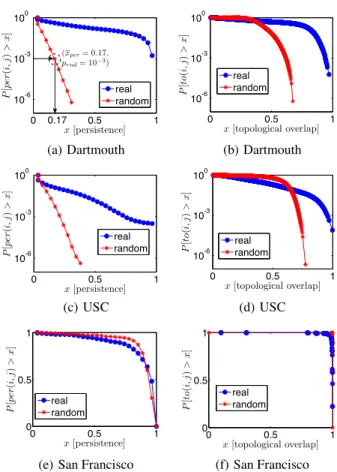
We show in Figure 2 (first column) the edge persistence as
measured in the three datasets. Considering the set of event
graphs {G1, ..., Gt} of all three real networks and their
RND-generated random counterparts3
{RND(G1), ..., RND(Gt)}, we
por-tray the complementary cumulative distribution function (CCDF) Fper(i,j)(x) = P [pert(i, j) > x]. There, the time step is one day
and each curve is obtained by analyzing four weeks of contacts,
sincet = 28 corresponds to the length of the shortest considered
dataset, i.e., the San Francisco one. From Figures 2-a and 2-c, we observe that the Dartmouth and USC networks have edge persis-tence distributions that significantly differ from those computed in their random equivalents. More precisely, while the CCDFs of ran-dom networks show an exponential decay, the individuals in the
2Note that edge persistence is computed over the set of graphsG
t
and not over the temporal accumulation graphGt.
3
We generated five instances for every random graph and the cu-mulative distribution considers all of them.
real network tend to see each other regularly, i.e., for reasons be-yond pure randomness, leading to a heavy-tailed distribution. Con-versely, as from Figure 2-e, the encounters in the San Francisco dataset show an edge persistence similar to that obtained in the ran-dom equivalent graphs.
5.1.2
Topological Overlap
The Similarity of contacts can be mapped to the topological overlap feature of a complex network. This metric is extracted
from the aggregated temporal graphGt. The topological overlap
tot(i, j) of a pair of nodes i and j is defined as the ratio of
neigh-bors shared by two nodes, or, formally,
tot(i, j) =
|{k | (i, k) ∈ Et} ∩ {k | (j, k) ∈ Et}|
|{k | (i, k) ∈ Et} ∪ {k | (j, k) ∈ Et}|
.
In Figure 2 (second column), we show the CCDFFto(i,j)(x) =
P [tot(i, j) > x] of the topological overlap of the edges of the
real networksGtand their respective random networksGRt,
gen-erated by the T-RND mechanism4. Again, we pick one day as the
time step and consider four weeks of contacts (i.e.,t = 28 days).
Similar to what occurred to the edge persistence, we note that the Dartmouth and USC network CCDFs significantly differ from their random counterparts, in Figures 2-b and 2-d. Indeed, pairs of indi-viduals in these datasets share common neighbors in a way that could not happen randomly. Conversely, in Figure 2-f, the San Francisco network again behaves like a random contact network. Since all results indicate that the San Francisco network is random by nature, in the remainder of this work we will focus on the Dart-mouth and the USC datasets.
5.2
The RECAST algorithm
We have seen that both the edge persistence and the topological overlap behave differently in contact graphs generated from real-world social networks and in their random equivalent graphs. We exploit such a diversity to identify which edges are consequences of random or social events. In particular, we propose a classifica-tion of relaclassifica-tionships among network entities into four categories, depending on whether the edge corresponding to the relationship features random-like persistence and topological overlap. The four
4
Again, we generated five instances for every random graph and the cumulative distribution considers all of them.
0 0.5 1 10-6 10-3 100 x[persistence] P [p e r( i, j) > x ] real random (xper= 0.17, prnd= 10−3 ) 0.17 (a) Dartmouth 0 0.5 1 10-6 10-3 100 x[topological overlap] P [t o (i , j) > x ] real random (b) Dartmouth 0 0.5 1 10-6 10-3 100 x[persistence] P [p e r( i, j) > x ] real random (c) USC 0 0.5 1 10-6 10-3 100 x[topological overlap] P [t o (i , j) > x ] real random (d) USC 0 0.5 1 0 0.5 1 x[persistence] P [p e r( i, j) > x ] real random
(e) San Francisco
0 0.5 1 0 0.5 1 x[topological overlap] P [t o (i , j) > x ] real random (f) San Francisco Figure 2: The complementary cumulative distribution function of the edge persistence (a)(c)(e) and topological overlap (b)(d)(f)
for theGtof the three datasets and for their random
correspon-dentsGR
t after four weeks.
classes of relationships are described in Table 2. A feature value is called “social” if there is an almost zero probability of this value being generated randomly. On the other hand, a feature value is called “random” if there is a significant probability of this value be generated randomly. In fact, as we explain in the following
para-graphs, the unique parameterprndof RECAST defines if a given
feature value is social or random.
Table 2: RECAST relationships classes.
Class Edge persistence Topological overlap
Friends social social
Acquaintance random social
Bridges social random
Random random random
Relationships classified as Friends characterize pairs of individ-uals whose connection shows social edge persistence and topolog-ical overlap, i.e., who meet each other regularly and also tend to
know the same people5. The Acquaintance class includes
relation-ships among individuals sharing many common encounters, but not meeting often. As an example, friends of friends who see each
5
It is worth mentioning that, although the friend terminology im-plies attachment among two individuals by affection or personal regard, we use it here to describe strong social ties in terms of reg-ularity and similarity.
other once in a while, in occasions such as birthday parties, gradua-tion ceremonies or weddings, would be classified as Acquaintance. The last social class is that of Bridges, characterizing pairs of in-dividuals who see each other regularly, but do not share a large number of common acquaintances. E.g., the so-called familiar strangers, people who meet every day but do not really know each other (e.g., because they just commute between common home and work areas) are very likely to be classified as Bridges. Finally, when an edge is neither persistent nor characterized by topologi-cal overlap, it is considered the result of a random contact, and we classify it as Random.
In order to distinguish “social” from “random” values of the DCWN’s features, we resort to the distributions we previously
dis-cussed. More precisely, we define a valueprnd, the only
param-eter in RECAST, and we identify the feature value x for which¯
F (¯x) = prndfor the random networkGRt . The valuex represents¯
then a threshold, such that feature values higher thanx occur with¯
a probability lower thanprndin a random network. If we setprnd
to some small value, we can finally state that feature values higher
thanx are very unlikely to occur in a random network, i.e., they¯
are most probably due to actual social relationships. The parameter
prndcan also be seen as the expected classification error
percent-age. For instance, in Figure 2-a, considerprnd= 10−3. This gives
a thresholdx = 0.17, then all values higher than ¯¯ x = 0.17 will be
classified as social. However, there is aprnd= 10−3probability of
randomly generating values that RECAST classified as social edges
(i.e., false positives). In other words, we expect that10−3= 0.1%
of the edges classified as social to be, in fact, random. The full RE-CAST mechanism is described in Algorithm 1, where the criteria
used in each classification are detailed. In this algorithm, indext is
omitted forper and to metrics for clarity purposes.
Algorithm 1RECAST: classify edges ofGt
Require: prnd≥ 0
return class(i, j) ∀(i, j) ∈ ∪tEt
ConstructGR
t and set{RND(G1), ..., RND(Gt)} using T-RND
GetFto(x) and Fper(x) from GRt
Getx¯to| Fto(¯xto) = prndand¯xper| Fper(¯xper) = prnd
for alledges(i, j) ∈ Et do
ifper(i, j) > ¯xperandto(i, j) > ¯xtothen
class(i, j) ← Friends
else ifper(i, j) > ¯xperandto(i, j) ≤ ¯xtothen
class(i, j) ← Bridges
else ifper(i, j) ≤ ¯xperandto(i, j) > ¯xtothen
class(i, j) ← Acquaintance else
class(i, j) ← Random end if
end for
The complexity of RECAST is upper bounded by the
construc-tion ofGR
t using T-RND, which is O(t × (|Vt| + |EtR|)), i.e.,
the minimum complexity for the generation of a degree sequence-based random graph available to date [18]. After the
construc-tion of GR
t, the complexity of the classification mechanism is
O(|ER
t | × |Vt|), where O(|Vt|) is the cost of computing the
topo-logical overlap of an edge.
5.3
Classification results
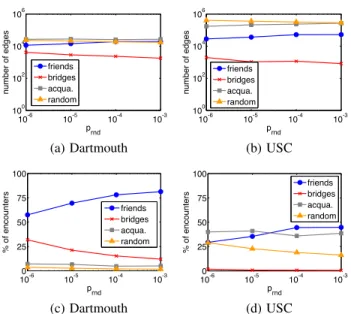
We apply RECAST to the Dartmouth and the USC networks. We are omitting the results for the San Francisco dataset, since, as previously stated, the random-like nature of taxi routes makes the analysis uninteresting, with all edges classified as Random. In Figure 3, we show the number of edges per class as a function of
10-6 10-5 10-4 10-3 100 102 104 106 p rnd number of edges friends bridges acqua. random (a) Dartmouth 10-6 10-5 10-4 10-3 100 102 104 106 p rnd number of edges friends bridges acqua. random (b) USC 100-6 10-5 10-4 10-3 25 50 75 100 prnd % of encounters friends bridges acqua. random (c) Dartmouth 100-6 10-5 10-4 10-3 25 50 75 100 prnd % of encounters friends bridges acqua. random (d) USC
Figure 3: The number of edges (a)(b) and percentage of en-counters (c)(d) of a given class that appears in the first four
weeks of data versusprnd.
theprndvalue. An initial and quite surprising observation is that,
by varyingprndthrough four orders of magnitude, the number of
edges per class stays in the same magnitude. This shows that
RE-CAST is robust with respect toprnd, i.e., it does not need a fine
calibration of the parameter to return a consistent edge classifica-tion.
Secondly, in both datasets, the number of Bridges is orders of magnitude lower than the other classes, a clear indication that in the analyzed social networks regular connections among different com-munities are rare. Also the number of Friends edges is similar in the two networks, implying similar dynamics in tight relationships among individuals in the two campuses. This also agrees with the biological constraint on a social interaction that limits human so-cial networks’ size, i.e., the number of Friends relationships [20]. However, the two datasets differ when looking at the number of edges classified as Acquaintances and Random, that are one order of magnitude larger in USC than in Dartmouth. This is the result of the actual size of the two campuses, USC accounting for a popula-tion around ten times larger than that of Dartmouth. This aspect is also reflected by the size of the traces in Table 1 that clearly leads, in the USC network, to (i) many more Random contacts among in-dividuals who do not actually know each other, but just happen to cross each other while strolling on campus, and (ii) an increased presence of strangers who happen to know the same people, lead-ing to more Acquaintances edges.
The observations above are even more evident when observing the percentage of individual encounters of each type in the Dart-mouth and USC networks. In Figure 3, we show the percentage of encounters of a given class that appear in the first four weeks of
data for a given value ofprnd. The percentage of Random
encoun-ters in the Dartmouth network is close to zero, varying from1.7%
to3.6% as prnddecreases. On the other hand, in the USC network,
this percentage varies from16% to 29%. In fact, the proportion of
Randomencounters provides a good estimate of the probability of random decisions mentioned in Section 4. Thus, the USC network has a significantly higher tendency to evolve to a random topology than the Dartmouth network.
0 7 14 21 28 0 0.2 0.4 0.6 0.8 1 time t (days) clustering coefficient real G t random G t R (a) Dartmouth 0 7 14 21 28 0 0.2 0.4 0.6 0.8 1 time t (days) clustering coefficient real G t random G t R (b) USC
Figure 5: Evolution of the clustering coefficient ofGtwhen only
Randomedges are present, compared to their random
corre-spondentsGR
t.
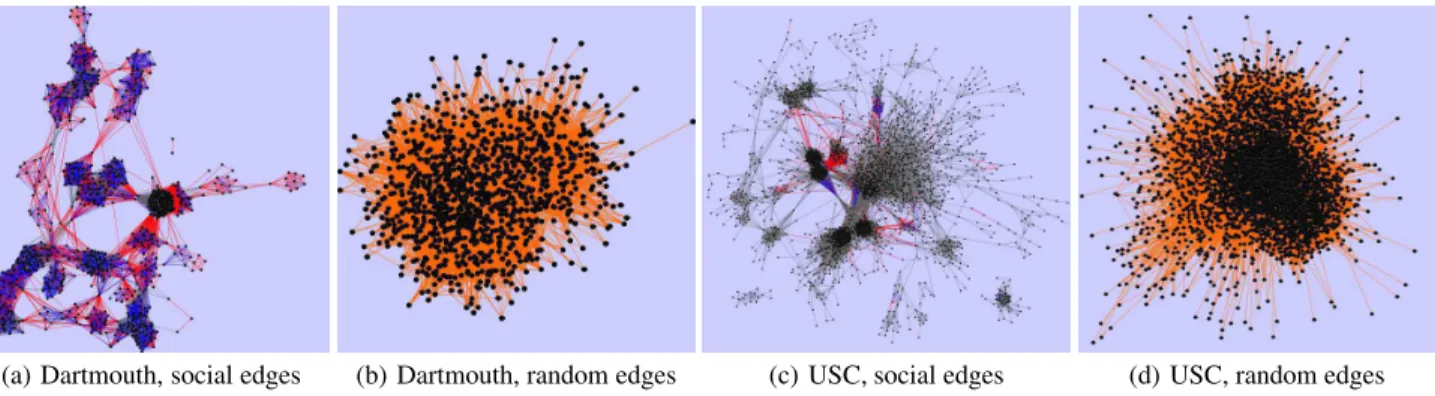
The analysis is confirmed by Figure 4, portraying the snapshots of the Dartmouth and USC networks after two weeks of interac-tions, when considering only social edges (i.e., those classified as
Friends, Acquaintances and Bridges) or only edges tagged as
Ran-dom. Edges of the former networks in Figures 4-a and 4-c are
dis-tinguished by colors, according to the same code used in Figure 3 (Friends edges are in blue, Bridges in red, Acquaintances in gray, and Random in orange). The difference between the social-only networks and the random-only ones is striking. Social networks are characterized by a complex structure of Friends communities, linked to each other by Bridges and Acquaintances. More pre-cisely, when comparing the Dartmouth and USC social networks, the former appears to be dominated by Friends interactions, while the sheer number of Acquaintances in the latter drives its graph structure.
Conversely, networks containing only Random edges do not show any structure and look like random graphs. A rigorous way to verify the randomness of such networks, and thus validate the effi-ciency of the RECAST classification, is to perform a clustering co-efficient analysis. Figure 5 compares the clustering coco-efficients of
the Dartmouth and USC networksGtwhen only Random edges are
presentagainst the same metric computed in their random
counter-partsGR
t. The clustering coefficient, commonly employed to
deter-mine the actual randomness of a network, has very similar
evolu-tions inGtandGRt: this proves that the network of contacts tagged
as Random by RECAST is actually a random network. Therefore, RECAST is able to extract from a real-world contact dataset edges that correspond to random encounters.
6.
RECAST APPLICATION
In this section, we use the Dartmouth and USC contact traces to simulate an epidemic dissemination. We consider that the users communicate with each other in an opportunistic fashion, i.e., with-out any infrastructure and exchanging messages only when they are
within physical proximity. Thus, if useri wants to send a message
to userj, he (she) has to deliver it personally to j or has to ask
other users to relay it for him (her), through a multi-hop carry-and-forward path. Also, we consider the transfer to be epidemic, i.e., in
order to reachj, user i sends a message to all other users he (she)
is in contact with at a given timet. The latter forward it to all of
the users they later meet and so on, until userj is reached. Such an
epidemic approach allows us characterizing the lower bound on the delay required by the opportunistic transfer.
For both Dartmouth and USC contact traces, we use RECAST to classify the relationships between users over one month of contact data, which we refer to as the classifying stage. Then, we simulate the opportunistic transfer scenario above during the two following
(a) Dartmouth, social edges (b) Dartmouth, random edges (c) USC, social edges (d) USC, random edges Figure 4: Snapshots of the Dartmouth and USC networks after two weeks of interactions, considering only the social edges and only the random edges. Friends edges are painted in blue, Bridges in red, Acquaintances in gray and Random in orange. This figure is best viewed in colors.
weeks, termed the routing stage, containing only future encounters,
not known previously by RECAST. For each useri, we randomly
pick a timet0,iwithin the first week of the routing stage for him/her
to start the epidemic transfer process, and a destination userj. We
leave one week for the message to reach its destination: if the mes-sage is not delivered by then, the transfer is deemed failed and the data lost.
In Figure 6, we show the overall forwarding efficiency. Fig-ures 6-a and 6-b show the percentage of messages that were suc-cessfully delivered to their destinations in the Dartmouth and in the USC scenarios, respectively. Each bar represents one relation-ship shared by the message source and destination, and within each bar we depict the fraction of edges of a given class of relationship that was used to deliver the message. First, we observe that all the messages reached their destinations in the Dartmouth scenario, a consequence of the limited network size. Moreover, the edges clas-sified as Friends were the most used to deliver the messages and the Random ones the least used. In fact, considering all the paths
directed to Friends, less than2% of the hops in these paths were
given by users who share a Random relationship.
Different from the Dartmouth scenario, not all messages are de-livered in the USC scenario. The lower delivery ratio is partially due to the larger network that is harder to navigate. However, that is not the only reason, and the social relationship between the source and destination significantly affects the probability of success. So-cially connected pairs (tagged as Friends, Bridges and
Acquain-tances) can actually exchange data: 90% of the messages were
successfully delivered to Friends,92% to Bridges and 77%
Ac-quaintances. If one wants to send a message to a Random contact
in the USC scenario, there is only44% of chances that this
mes-sage will arrive successfully. Moreover, although the majority of the classified edges in the USC scenario are Random (see Figure 3), the majority of the hops in the paths are between users who share a social relationship. Considering all the paths directed to Friends,
less than13% of the hops in these paths were given by users who
share a Random relationship.
In Figure 7, we show how much time it was necessary for the messages to reach their destinations. We grouped together all the
routings from source useri to destination user j by the class of
re-lationshipcthat i and j share. Then, we cumulatively count how
many destinations of the classc are reached per each hour,
con-sidering the total number of routings that were performed between
sources and destinations of classc. Observe that the expected time
to reach a Random contact is significantly higher than the time needed to reach a social contact. Moreover, observe that the
ma-Friends Bridges Acqua. Random 0 20 40 60 80 100 % of messages delivered Friends Bridges Acqua. Random (a) Dartmouth
Friends Bridges Acqua. Random 0 20 40 60 80 100 % of messages delivered (b) USC
Figure 6: The forwarding efficiency when useri sends a
mes-sage to userj in the opportunistic network, and i and j share
a specific RECAST relationship. Within each bar we also show the fraction of edges of a given class of relationship that was used to deliver the message.
100 101 102 0 25 50 75 100 time (hours) nodes reached (%) friends bridges acqua. random (a) Dartmouth 100 101 102 0 25 50 75 100 time (hours) nodes reached (%) (b) USC
Figure 7: The% of users who were reached over the time.
jority of the messages sent to Friends arrive in the first hours for both scenarios.
It is not only the time it takes for a message to arrive at its des-tination that is relevant to the design of forwarding solutions for opportunistic networks. Another fundamental aspect is the number of hops required to reach the destination. In Figure 7, we show the cumulative distribution function (CDF) of the path lengths of
messages between usersi and j who share a determined class of
relationship. Observe that the expected number of hops for a mes-sage to arrive at a Random contact is significantly higher than to
ar-rive at a social contact. For the USC scenario,89%, 92% and 81%
of the routes to Friend, Bridge and Acquaintance destinations,
re-spectively, have path lengths lower or equal to3. In the meanwhile,
100 101 10-2 10-1 100 x [path length] Pr(X ≤ x) Friends Bridges Acqua. Random (a) Dartmouth 100 101 10-1 100 x [path length] Pr(X ≤ x) Friends Bridges Acqua. Random (b) USC
Figure 8: The histogram of the path lengths of messages
be-tween usersi and j who share a determined class of
relation-ship.
lower or equal to3. This difference is even more striking for the
Dartmouth scenario, where65%, 57% and 28% of the routes to
Friend, Bridge and Acquaintance destinations, respectively, have
path lengths lower or equal to3, and only 6% to Random
destina-tions have path lengths lower o equal to3.
Overall, our results show how the RECAST classification allows identifying those who share social relationships with the sender, whose opportunistic paths are usually short and reliable. In fact, such paths usually pass through a few number of hops, mostly us-ing social ties among users, and rarely leverage random encounters. As an intuitive corollary, reaching users that share some social re-lationship is significantly easier than attaining users one does not know, especially in large systems. These results may serve to lever-age the performance of various routing solutions for opportunistic networks. If we previously know the class of relationship the des-tination share with the source, we also know the chances and the probable time the message will take to arrive.
7.
CONCLUSIONS
The contribution of this paper is threefold. First, we modeled three real-world mobile user encounter datasets as temporal con-tact graphs and we proposed the use of random equivalent graphs to outline their hidden social structure. Our original approach shows that different mobility traces can yield completely different social structures, determined by diverse behaviors of the entities partici-pating in the system. These results let us speculate that researchers should not generalize their results based on the analysis of a single dataset. Second, we proposed the RECAST strategy to lazily clas-sify random and social relationships in temporal social networks, and demonstrate its simplicity and effectiveness. Third, we em-ployed the RECAST classification to the case of epidemic oppor-tunistic transfers, and showed its relevance towards the identifica-tion of faster, reliable paths leveraging social ties among users.
As future work, we plan to analyze other mobility scenarios, both real and synthetic. Moreover, it would be interesting to ap-ply the RECAST to other social networks, such as communication networks from phone calls or SMSs.
8.
REFERENCES
[1] A. Rojas, P. Branch, and G. Armitage, “Experimental validation of the random waypoint mobility model through a real world mobility trace for large geographical areas,” in
Proceedings of the 8th ACM MSWiM, MSWiM ’05, (New York, NY, USA), pp. 174–177, ACM, 2005.
[2] W. jen Hsu and A. Helmy, “Impact: Investigation of mobile-user patterns across university campuses using wlan trace analysis,” CoRR, vol. abs/cs/0508009, 2005.
[3] T. Henderson, D. Kotz, and I. Abyzov, “The changing usage of a mature campus-wide wireless network,” in Proceedings
of the 10th annual international conference on Mobile computing and networking, MobiCom ’04, (New York, NY, USA), pp. 187–201, ACM, 2004.
[4] M. C. Gonzalez, C. A. Hidalgo, and A.-L. Barabasi, “Understanding individual human mobility patterns,” Nature, vol. 453, pp. 779–782, 2008.
[5] J. Leskovec, L. Backstrom, R. Kumar, and A. Tomkins, “Microscopic evolution of social networks,” in KDD ’08:
Proceeding of the 14th ACM SIGKDD, (New York, NY, USA), pp. 462–470, ACM, 2008.
[6] E. Cho, S. A. Myers, and J. Leskovec, “Friendship and mobility: user movement in location-based social networks,” in Proceedings of the 17th ACM SIGKDD, KDD ’11, (New York, NY, USA), pp. 1082–1090, ACM, 2011.
[7] A. Barabasi and R. Albert, “Emergence of Scaling in Random Networks,” Science, vol. 286, no. 5439, p. 509, 1999.
[8] R. Albert, H. Jeong, and A.-L. Barabási, “Diameter of the World Wide Web,” Nature, vol. 401, pp. 130–131, September 1999.
[9] P. Erdös and A. Rényi, “On the evolution of random graphs,”
Publ. Math. Inst. Hung. Acad. Sci., vol. 7, p. 17, 1960. [10] A. Mtibaa, M. May, C. Diot, and M. Ammar, “Peoplerank:
Social opportunistic forwarding,” in IEEE Infocom, 2010. [11] W. Gao, Q. Li, B. Zhao, and G. Cao, “Multicasting in delay
tolerant networks: a social network perspective,” in ACM
MobiHoc, 2009.
[12] M. Conti, R. Di Pietro, A. Gabrielli, L. V. Mancini, and A. Mei, “The Smallville Effect: Social Ties Make Mobile Networks More Secure Against the Node Capture Attack,” in
ACM MobiWac, 2010.
[13] A. G. Miklas, K. K. Gollu, K. K. W. Chan, S. Saroiu, K. P. Gummadi, and E. De Lara, “Exploiting social interactions in mobile systems,” in Proceedings of the UbiComp ’07, (Berlin, Heidelberg), pp. 409–428, Springer-Verlag, 2007. [14] G. Zyba, G. M. Voelker, S. Ioannidis, and C. Diot,
“Dissemination in opportunistic mobile ad-hoc networks: The power of the crowd,” in Proceedings of IEEE
INFOCOM 2011, pp. 1179–1187, IEEE, Apr. 2011. [15] S. Milgram, The individual in a social world, ch. The
Familiar Stranger: An Aspect of Urban Anonymity, pp. 51–53. Addison-Wesley, 1977.
[16] D. J. Watts and S. H. Strogatz, “Collective dynamics of "small-world" networks,” Nature, vol. 393, pp. 440–442, 1998.
[17] F. Bai, D. Stancil, and H. Krishnan, “Toward understanding characteristics of dedicated short range communications (dsrc) from a perspective of vehicular network engineers.,” in
ACM MobiCom, 2010.
[18] F. Chung and L. Lu, “Connected Components in Random Graphs with Given Expected Degree Sequences,” Annals of
Combinatorics, vol. 6, pp. 125–145, Nov. 2002.
[19] C. A. Hidalgo and C. Rodriguez-Sickert, “The dynamics of a mobile phone network,” Physica A: Statistical Mechanics
and its Applications, vol. 387, no. 12, pp. 3017 – 3024, 2008. [20] R. I. M. Dunbar, “The social brain hypothesis,” Evol.