HAL Id: hal-02458601
https://hal.archives-ouvertes.fr/hal-02458601
Submitted on 28 Jan 2020HAL is a multi-disciplinary open access archive for the deposit and dissemination of sci-entific research documents, whether they are pub-lished or not. The documents may come from teaching and research institutions in France or abroad, or from public or private research centers.
L’archive ouverte pluridisciplinaire HAL, est destinée au dépôt et à la diffusion de documents scientifiques de niveau recherche, publiés ou non, émanant des établissements d’enseignement et de recherche français ou étrangers, des laboratoires publics ou privés.
Ozone Quantification by Selected Ion Flow Tube Mass
Spectrometry: Influence of Humidity and
Manufacturing Gas of Ozone Generator
Leticia Vitola Pasetto, Romain Richard, Jean-Stéphane Pic, Marie-Hélène
Manero, Frédéric Violleau, Valérie Simon
To cite this version:
Leticia Vitola Pasetto, Romain Richard, Jean-Stéphane Pic, Marie-Hélène Manero, Frédéric Violleau, et al.. Ozone Quantification by Selected Ion Flow Tube Mass Spectrometry: Influence of Humidity and Manufacturing Gas of Ozone Generator. Analytical Chemistry, American Chemical Society, 2019, 91 (24), pp.15518-15524. �10.1021/acs.analchem.9b03337�. �hal-02458601�
OATAO is an open access repository that collects the work of Toulouse
researchers and makes it freely available over the web where possible
Any correspondence concerning this service should be sent
to the repository administrator: tech-oatao@listes-diff.inp-toulouse.fr
This is an author’s version published in:
http://oatao.univ-toulouse.fr/25329
To cite this version:
Vitola Pasetto, Leticia
and Richard, Romain
and Pic, Jean-Stéphane and
Manero, Marie-Hélène
and Violleau, Frédéric
and Simon, Valérie
Ozone Quantification by Selected Ion Flow Tube Mass Spectrometry: Influence
of Humidity and Manufacturing Gas of Ozone Generator. (2019) Analytical
Chemistry, 91 (24). 15518-15524. ISSN 0003-2700
Ozone Quantification by Selected Ion Flow Tube Mass
Spectrometry: Influence of Humidity and Manufacturing Gas of
Ozone Generator
Leticia Vitola Pasetto
/
'*
Romain Richard
/
Jean-Stéphane Pic,§
Marie-Hélène Manero
/
Frédéric Violleau
,*
and Valérie Simon*'*
•
tLaboratoire de Génie Chimique, Université de Toulouse, CNRS, INPT, UPS, 31432 Toulouse, France *Laboratoire de Chimie Agro industrielle, LCA, Université de Toulouse, INRA, 31030 Toulouse, France §TBI, Université de Toulouse, CNRS, INRA, INSA, 31077 Toulouse, France
� ._l ____ •.. _.�_�_::; ___
1
"'-
'
°-
·
_�_.,..__ ... _ ...__J .. I .. 4 jf � • •..
�---"---� ABSTRACT: The quantification of ozone by SIFT MS wasinvestigated in conditions suitable with an industrial emission context (high ozone demand, dry air/oxygen as the manufacturing gas of the ozone generator, and high humidity
levels beyond saturation at room conditions). Ozone reacts -Â ... -t
...
I .., ...
'I
°'
'-
1
CO.•··-•·1
! : (9 ... ,iotl)
-
'
I
-j e • a • � • � • � • • � � •
with four negative precursor ions available in the SIFT MS 0••••
._,.,
device (N02 -, 02 -, HO-, and o-), each precursor ion havingits specific domain oflinearity. For a high ozone concentration range, only N02 -and 02 -have resulted in a linear behavior
(between 1 and 100 ppmv of03 for N02-, between 1 and 50
ppmv of 03 for 02 -). No water interference was identified during ozone measurements by SIFT MS using N02 - and
SIFT/MS
(i,egotive iOfl sœne) � n •
02 -precursor ions, even with extreme humidity levels. The presence of nitrogen oxide contaminants ( due to the use of dry air as the manufacturing gas of the ozone genera tor) affected the ozone quantification by SIFT MS. It is critical for N 02 -precursor ions, whose rate constant varied as a function ofN02 concentrations. With 02 -precursor ion, ozone was successfully measured in the presence of nitrogen oxides; however, the secondary chemistry must be taken into account.
B
esides its crucial role in controlling the UV radiation in the upper atmosphere, ozone (03) is an importantprimary oxidant employed in chemical treatment processes. Because of its high oxidation potential, ozone has been applied worldwide in water treatment for disinfection and removal of color, taste, odor, and micropollutants in drinking water. 1
It is also employed in advanced oxidation processes (AOP) to treat emerging pollutants in wastewater treatments. 2,3 Furthermore, some studies have revealed that ozonation can remove volatile organic compounds (VOCs) from gaseous efBuents4
and is able to reduce the odor intensity by removing specific components.5
ln this chemical treatment context, ozone is usually
generated in the gas phase by plasma/corona discharge
( when an air or oxygen flow passes through two electrodes under high voltage) or by UV lamps ( at wavelengths under 200
nm).6-8 As higher ozone concentrations are produced by
plasma discharge, this technique is frequently applied in studies
with industrial conditions.2,s,9,io However, when air is fed into
the ozone generator (corona discharge), the presence of
contaminants such as nitrogen oxides has been identified.11
'12 Ozone is commonly analyzed using UV analysis ( at 254 nm wavelenfh), by iodometric or by indigo colorimetric studies.6' '13 ln parallel to these traditional analytical methods,
only a few studies have investigated the measurement of ozone
concentrations by mass spectrometry based techniques, such as selected ion flow tube ( SIFT MS) 11 and ion trap.14
Particularly in an industrial context, SIFT MS has emerged as an interesting technique because it is able to analyze in real
time a wide variety of compounds at trace levels in gas phase through an ionization reaction with H30+, NO+, and 0/.15-18
ln recent years, live negative ions (No2-, N03-, 02-, Ho-,
and o-) have been integrated to the range of precursor ions available for analysis of samples, broadening the list of compounds analyzed by SIFT MS
19
-adding among them ozone, which can only react with negative precursor ions because its proton affinity is smaller than water (625.5 vs 691 1g mol-1
).20 The quantification of neutral compounds by
SIFT MS is based on soft ionization reaction with precursor ions, carried out in a region with fixed conditions ( temper ature, pressure, and reaction time). 15'21
According to Williams et al., 1
ozone reacts with four negative precursor ions available in the SIFT MS device (N02 -, 02 -, HO-, and o-), being only
unreactive to N03-. The ionization of 03 usually proceeds via
charge and O atom transfer, as shown in eq 1 for N02 -, eq 2 for 02 -, eq 3 for Ho-, and eq 4 for o-.
+ → + + − − − NO O NO O O NO 2 3 3 2 3 2 l m oo n oo (1) + → + − − O2 O3 O3 O2 (2) + → + + + − − − − HO O O HO HO O O HO 3 3 2 2 2 2 l m ooooo n ooooo (3) + → + + − − − O O O O O O 3 3 2 2 l m oo n oo (4)
Previous studies in the 1970s and 1980s investigated the reaction between ozone and negative ions applying different experimental techniques (such as flowing afterglow22,23 and ion beam methods24). Dotan et al.23 studied the reaction between O3and OH−and reported the conversion of O3−ion to CO3−and O2in the presence of CO2(with a rate constant of 5.5 × 10⁻¹⁰ cm3 molecule−1 s−1). In addition to the rate constant of O2− ion and ozone, Fahey et al.22 reported the cluster formation in the presence of humidity, in which O2−· (H2O)n 1,2,3,4 ions would react with O3by a considerable fast charge transfer and the water molecule transfer (10−10 cm3 molecule−1 s−1). Cluster formations in SIFT MS happen via sequential three body association, in which the molecule of the carrier gas acts as a stabilizing agent.25 The nature of the carrier gas in the reaction chamber (flow tube) may influence the cluster formation and therefore modify its related rate coefficients.
The objective of this work was to explore in more detail the quantification of ozone by SIFT MS in the context of industrial gas emission. Industrial gaseous effluents are usually a mixture of several compounds, often presenting high humidity levels, in which ozone based treatment systems apply quite high ozone concentrations (several hundred ppmv). The determination of the rate coefficient was one of the objectives of this study because the SIFT MS device was employed under different operating conditions than those reported in the literature:11a higher temperature of theflow tube and a different carrier gas (nitrogen). Moreover, the present study investigated the impact of the humidity and the effect of the nature of the manufacturing gas (oxygen or dry air for ozone generator) on ozone quantification by SIFT MS.
■
MATERIALS AND METHODSOzone and Humid Air Generation. Ozone was generated by a plasma discharge ozone generator (HTU500 AZCO Industries Limited, Canada) fed by oxygen (99.999%, Linde Gas, France) and by dry air (dew point equal to−40 °C at 101.3 kPa), which was produced by an air compressor (ZR55, oil free air ISO 8573 1 class 0, Atlas Copco France) integrated to an air filter (Olympian Plus, Norgren, U.K.). Ozone concentration could vary from 370 ppmv to 4000 ppmv with dry air and from 760 ppmv to 4800 ppmv with oxygen, depending on the gas flow and the generator power. Ozone concentrations were measured directly after its production by an UV analyzer (BMT 964, BMT MESSTECHNIK GMBH, Germany). The calibration was performed between 1 ppmv and 100 ppmv (at 6 levels) from the dilution of ozone air or ozone oxygen stream into an air stream, whose gasflows were
controlled by mass flowmeters (SLA 5850S B Brooks Instru ments, U.S.A.).
A humidification system (Serv’Instrumentation, France) was employed to generate calibrated humidity levels from 0.01%vol of H2O (dry air, dew point equal to−40 °C at 101.3 kPa) until 4.00%vol of H2O (dew point equal to 29°C at 101.3 kPa), at five different levels of humidity. Since the range from 2.00 to 4.00%vol of H2O was higher than the saturation at room conditions (20°C and 101.3 kPa), the system was heated at 40 °C by a heated circulating oil bath (Model 1160S, VWR, U.S.A.), composed of a stainless steel smooth coil immersed in a synthetic thermoliquid (Ultra 350, Lauda, Germany) installed at the air line after the humidification system. The gas line between the mixture point and the SIFT MS was isolated and heated using a heated cable (FGR 100, Omegalux, France) to prevent condensation. The estimated residence time of gas in the system (between the mixture point and SIFT MS device) was 2 s.
SIFT-MS Analysis. The SIFT MS device applied in this study (Voice 200ultra, Syft Technologies Ltd., New Zealand) produced the negative precursor ions by microwave discharge using wet conditions for HO− and O2− and using dry conditions for NO2− and O−. Only one precursor ion was selected at a time by afirst quadrupole mass filter and was then injected to the reaction chamber (flow tube) by a nitrogen flow (180 NmL min −1) as carrier gas, whereas the sample was introduced by a calibrated capillary at 20 NmL min−1. In the flow tube (kept at 119 °C and 0.07 kPa), the analyte (neutral compound) reacted with a selected precursor ion and generated product ions with specific mass to charge ratios (m/z) that were quantified by a second quadrupole mass spectrometer, calculating a count rate per second (signal intensity in cps).11,15
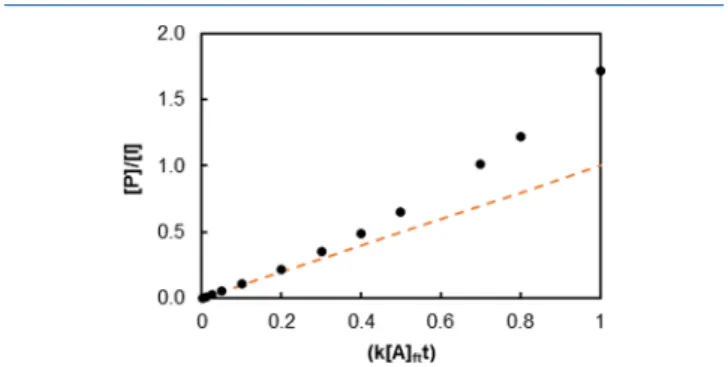
The analyte concentration in the flow tube ([A]ft in molecules cm−3) was calculated by eq 5, which depends on the rate coefficient (k in cm3molecule−1s−1) of the reaction between the neutral compound and the precursor ion, on the ratio between the precursor ion count rate at time equal to 0 ([I0] in cps) and at time t ([I] in cps) and the reaction time in theflow tube (t in s) (considered equal to 5 ms for the Syft model used in this study). In case of a monoconstituent and m/z < 100, the product ion count rate ([P]) can be expressed as the difference between [I0] and [I].eq 5in function of [P] leads toeq 6. [ ] [ ] = [ ] I I k A t lni 0 ft k jjjj y{zzzz (5) [ ] [ ] = − − [ ] − [ ] P I e e 1 k t k A t Aft ft (6)
A critical point on applying SIFT MS analysis is the condition of linear correlation between [P] and [A]ft. It is only valid for low concentrations of analytes, and hence, the precursor ion is only slightly consumed.15This linear correlation between [P]/ [I] and [A]ftwas obtained rearranging theeq 6toeq 8, when the limit of k[A]ftt approaching zero was considered in the exponential expression (eq 7), neglecting the differential diffusion between precursor and product ions.
− = [ ] [ ] → − [ ] − [ ] e e k A t lim (1 ) k A t k A t k A t 0 ft ft ft ft (7)
[ ] [ ] = [ ]
P
I k A tft (8)
InFigure 1, it is clear that the linear correlation between [P] and [A]ftis only valid for [P]/[I] < 1. Knowing the [A]ftand
the operating conditions of the flow tube, the analyte concentration in the sample ([A]sample in ppmv) could be calculated byeq 9, where Tft(K) is theflow tube temperature, Pft(kPa) is theflow tube pressure, φsis the sampleflow (NmL min−1), φc is the carrier gasflow (NmL min−1), and kb the Boltzmann constant (equivalent to the ratio of the ideal gas constant by the Avogadro number, i.e., 1.4× 10⁻²⁰ kPa cm3 molecule−1K−1). φ φ φ [ ]A = [ ]A T k + P 10 ( ) sample ft ft b 6 ft s c s (9)
In the same way that analyte concentration was calculated by
eq 5, the rate coefficient could also be obtained. It represents
the slope of the linear correlation of ln(([P]+[I])/[I]) vs [A]ftt, if the [A]sampleand, consequently, [A]ftare known. In the case when more than one product ion is generated, the branching ratio of each product ion can also be obtained from
eq 5. When all product ion count rates were summed in [P], a global rate coefficient was obtained. Whereas, when only the count rate of one of theproduct ions was considered to calculate [P], a partial rate coefficient was acquired. The ratio between the partial and the global rate coefficient represents the branching ratio of the specific product ion.
The limit of detection (LOD) in SIFT MS analysis was calculated considering the confidence level equal to three standard deviations above background (eq 10), as the limit of quantification (LOQ) is the lowest concentration that can be measured with a precision of±20%26,27(eq 11). bμrepresents the mean background count rate of the product ion at a specific m/z ratio (cps); tmthe time of measurement (s); and s the sensitivity (cps ppbv−1), which represents how many product ions (cps) at the specific m/z ratio were produced for a given concentration of analyte. In this study, bμand tmwere calculated from a blank analysis, i.e., without the presence of the analyte (O3). = b tμ st LODppbv 3 m m (10) = + + b tμ st LOQ 25 5 25 4 2 ppbv m m (11)
■
RESULTS AND DISCUSSIONLinearity Range of Negative Ion Precursors as a Function of Ozone Concentration. The respective spectra
Figure 1.Comparison between the lineareq 8(dotted line) and the
exponential correlation represented byeq 6(●).
Figure 2.Comparison between a blank analysis (black solid bars) and sample containing 75 ppmv of O3generated by oxygen (red dashed bars).
for each of the four negative precursor ions reactive to ozone11 are represented inFigure 2. They were obtained during full scan (FS) mode and individually for each precursor ion. In FS mode, the second quadrupole spectrometer scans over a mass range covering from 15 to 250 m/z, calculating a count rate for each unit of m/z. InFigure 2, the comparison of two different samples is shown: the blank sample (black bars) is obtained only when dry air is fed into SIFT MS flow tube, and the second trace (red bars) is when 75 ppmv of O3is produced from oxygen and diluted in air.
In agreement with Williams et al.,11 the reaction between NO2−precursor ion and O3generated mostly the NO3−[m/z 62] product ion, with a slight generation of O3− [m/z 48], through a charge transfer mechanism (Figure 2A).
In the case of O2−, O−, and HO−precursor ions, besides the expected product ions O3− [m/z 48], O2−[m/z 32] (for O− and HO− precursor ions), and HO2− [m/z 33] (for HO− precursor ion); CO3−[m/z 60] ion was also detected (Figure 2B,C,D). The CO3− generation is a result of the natural occurrence of CO2in air (around 400 ppmv)28 as shown by Dotan et al.23 while studying secondary chemistry of O3−. Since a part of O3−[m/z 48] product ions reacts with CO2in theflow tube, the product ion CO3− [m/z 60] must also be considered as a secondary reaction of O3− [m/z 48] and be counted for the quantification of ozone by O2−, O−, and HO− precursor ions.
However, the intensity signal of O−(Figure 2C) and HO− (Figure 2D) precursor ions were less important than the sum of product ions (O3− [m/z 48]; O2−[m/z 32]; HO2−[m/z 33]; CO3−[m/z 60] and HCO3−[m/z 61]), resulting in [P]/ [I]≫1 (equal to 3.9 for O−and 5.9 for HO−, considering the sum of all product ions). Consequently, O− and HO− precursor ions were out of the linearity domain when the ozone concentration in the sample was at 75 ppmv (75% of the maximum level of the studied range) for the flow tube conditions applied in this study (i.e., for a mixing ratio of the sample into theflow tube equal to 10%). Only NO2−and O2− precursor ions have shown the potential to be linear in the ozone concentration range studied ([P]/[I] was equal to 0.06 for NO2−and to 0.97 to O2−at 75 ppmv of O3). However, it was expected that the O2−precursor ion would not present a linear relation during all the ozone concentration range, because from 0.75, [P]/[I] shows a considerable deviation from the linear expression (Figure 1).
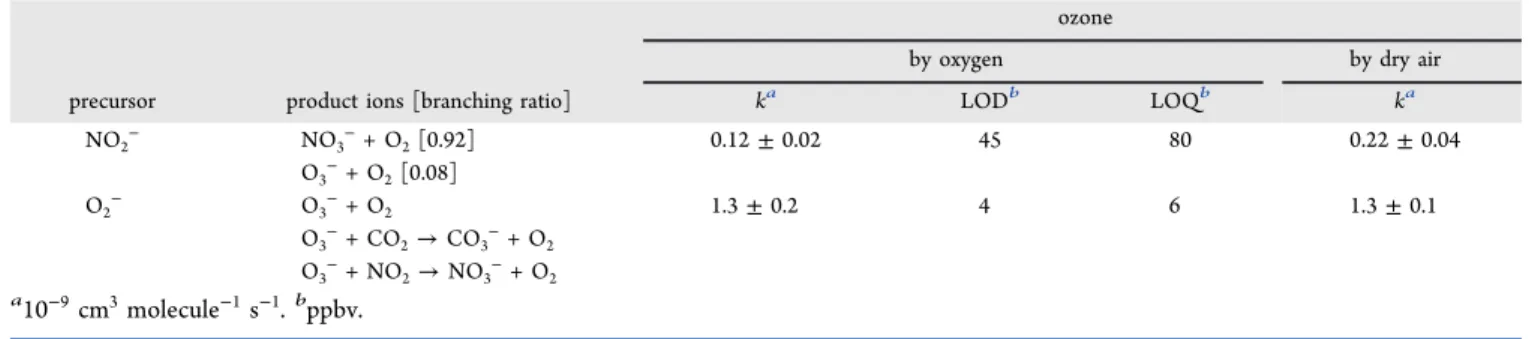
Rate Coefficients of NO2− and O2− with Ozone. The rate coefficients of O2− and NO2− precursor ions with O3 (shown inTable 1) were obtained using nitrogen as carrier gas, aflow tube temperature at 392 K and considering the ozone generated by oxygen and later diluted in air (at 5 levels of humidity). They were calculated byeq 5, where O3−[m/z 48]
and CO3− [m/z 60] product ions were considered for O2− precursor ion and O3−[m/z 48] and NO3−[m/z 62] product ions were counted for NO2−precursor ion. The rate coefficient of O2− obtained in this study (1.3 ± 0.2 × 10⁻⁹ cm3 molecule−1 s−1) is in good agreement with Williams et al.11 (equal to 1.3× 10⁻⁹cm3molecule−1s−1), whereas in the case of NO2−rate coefficient, the value reported by Williams et al.11 (0.18× 10⁻⁹ cm3 molecule−1 s−1) is slightly higher than the one found in this study (0.12± 0.02 × 10⁻⁹cm3molecule−1 s−1). We have also reported a slightly higher contribution of the charge transfer mechanism (equal to 8%) than the 1% presented by Williams et al.11 The uncertainty of the rate coefficients was calculated by the method of error propagation, considering the error from the linearity regression and from the ozone/humid air generation (estimated as <10%).
The ozone concentrations measured by SIFT MS when applying the rate coefficients of NO2−and O2−ofTable 1are shown in Figure 3. Concentrations calculated from NO2−
precursor ion are in excellent agreement with the calibrated ozone concentrations (slope = 0.989 in Figure 3), whereas from O2−precursor ion, it shows a deviation for concentrations higher than 50 ppmv of O3. The falsely high concentrations could be explained by elevated values of [P]/[I], which suggests that O2−precursor ion was out of the linear range for ozone concentrations values higher than 50 ppmv (the slope until 50 ppmv was equal to 1.017 inFigure 3).
The LOD of SIFT MS (Table 1) for measuring ozone (generated by oxygen) by O2−precursor ions is lower than by NO2−(with a measurement time equal to 60 s), which reflects the difference of sensitivity of SIFT MS between the two precursor ions. For NO2− precursor ion, SIFT MS detected 170 cps ppmv−1 of O3; whereas for O2− precursor ion, it measured 2770 cps ppmv−1of O3.
Table 1. Rate Coefficients, LOD, and LOQ for Ozone Generated by Oxygen and Dry Air
ozone
by oxygen by dry air
precursor product ions [branching ratio] ka LODb LOQb ka
NO2− NO3−+ O2[0.92] 0.12± 0.02 45 80 0.22± 0.04 O3−+ O2[0.08] O2− O3−+ O2 1.3± 0.2 4 6 1.3± 0.1 O3−+ CO2→ CO3−+ O2 O3−+ NO2→ NO3−+ O2 a10−9cm3molecule−1s−1.bppbv.
Figure 3.Comparison between the calibrated ozone concentrations
with those measured by NO2− precursor ion (red ●) and O2−
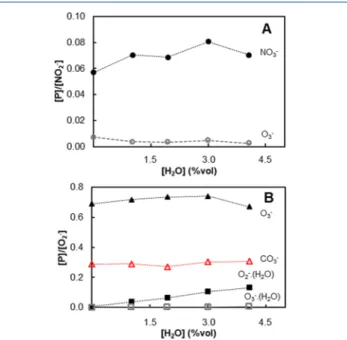
Effect of Humidity. The influence of the humidity in the measurement of ozone concentrations by SIFT MS was investigated in a large range of H2O concentrations (0.01 to 4.00%vol) and for all five levels of ozone concentration between 1 and 100 ppmv. All repetitions of the 5 levels of humidity for each condition of ozone concentration are plotted in Figure 3, and no considerable dispersion is observed. It suggests that the quantification of ozone by NO2− and O2− precursor ions were not affected by humidity, which was confirmed by the analysis of [P]/[I] ratios for both precursor ions at afixed ozone concentration (75 ppmv) as a function of H2O concentration (Figure 4). The [P]/[I] ratios did not significantly vary with the increase of humidity, in agreement with the analysis previously evidenced fromFigure 3.
According to Figure 4B, the formation of the cluster O2· (H2O) [m/z 50] from the precursor ion O2− increased with humidity. However, the ratio between the cluster O3−·(H2O)
[m/z 66] (generated from product ion O3−) and O2− count rate was negligible even with the highest H2O concentration. The contrast behavior of water clusters compared to those proposed by Fahey et al.22 could be explained by a different experimental technique applied and by the use of helium as carrier gas in the previous studies. Assuming that the water cluster generation for negative ions follows a three body mechanism similar to positive ions, the use of nitrogen may have reduced the rate coefficient of the three body reactions, minimizing the water cluster generation.
Effect of the Manufacturing Gas on Ozone
Gen-erator. In order to investigate the influence of NOx contaminants on the ozone analysis by SIFT MS, a second ozone calibration was carried out. Ozone was generated by dry air and then diluted in air streams that containedfive different levels of humidity. Some differences between the calibration when ozone was generated by oxygen and by dry air were identified. They are shown inFigure 5, where NO2−and O2− spectra of both samples containing the same concentration of ozone (75 ppmv) are compared. A higher intensity of NO3− [m/z 62] product ion was generated from NO2−precursor ion (Figure 5A) when ozone was produced by dry air. Regarding the O2−spectra (Figure 5B), a third product ion was detected, identified as NO3−[m/z 62].
The presence of NO3−on the O2−spectra leads to two main conclusions. First of all, it demonstrates the generation of NOx contaminants when dry air is used as feed gas into the ozone generator12 (NO2could be detected29thanks to the positive ion source integrated in SIFT MS device). Second, it indicates a secondary chemistry related to the O3− product ion as previously proposed by Ferguson,30in which O3−would react with NO2, generating NO3−and O2.
The rate coefficient between O3and O2−obtained from the ozone generated by dry air was similar to the rate obtained with oxygen, as shown in Table 1. For the dry air condition, the NO3− product ion must be considered as a secondary reaction of O3−since one part of O3−produced from O3/O2− reaction reacts with NO2 as well as with CO2. As the rate coefficient has not varied, the domain of linearity for O2− precursor remains equivalent to the one found for ozone generated by oxygen, and thus, accurate quantification is only valid until 50 ppmv of O3.
The rate coefficient calculated for the O3/NO2−reaction was higher (around the double) when ozone was generated by dry
Figure 4.[P]/[I] of the product ions as a function of humidity at 75
ppmv of O3. (A) NO2−precursor ion with NO3−[m/z 62] (●) and
O3−[m/z 48] (○). (B) O2−precursor ion with O3−[m/z 48] (▲);
CO3−[m/z 60] (red△); O2−·(H2O) [m/z 50] (■) and O3−·(H2O)
[m/z 66] (□).
Figure 5.Comparison between both samples containing 75 ppmv of O3generated by oxygen (red dashed bars) and 75 ppmv of O3generated by
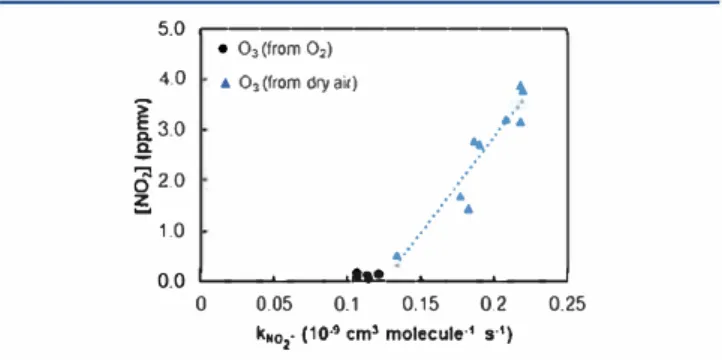
air compared to pure oxygen, as shown in Table 1. It suggests that NOx contaminants interfere on NO3- [m/z 62) product
ion, misrepresenting the rate coefficient of O3/NO2 -reaction. Furthermore, the apparent rate coefficient of OiNO2
-(calculated individually for each condition of the calibration) has increased as a function of the concentration of nitrogen dioxide (NO2), as shown in Figure 6. The NO2 concentrations were obtained from the NO/ [m/z 46) from 0/ precursor ion, applying the rate coefficient available in LabSyft kinetics database (relea se 1.6.2).29 5.0 ,---, 4.0
î
o. 3.0 � (52.0 � 1.0 • o, (from 02)• 03 (from dly air) �
....
...
,
.. ·· :·. ···
... .
.
..
0.0 .__ _ _._ _ _...IU._.__ _ _._ _ _J 0 0.05 0.1 0.15 0.2k•o,- (1 o·• cm' molecule·' s·') 0.25
Figure 6. Apparent rate coefficient of N02-with 03 generated by dry
air (blue Â) and by oxygen (e) as a function of the N02
concentration.
Since the rate coefficient of NO2 -has shown a dependence
with the concentration of NOx contaminants, it seems to be more appropriate to measure ozone concentration from the
02 - precursor ion (if both secondary reactions are
considered). However, it is limited by the domain of linearity.
■
CONCLUSIONSOrone can be successfully measured by SIFT MS up to 100 ppmv, regardless of the humidity level of the sample. Four precursor ions can be used to measure ozone: NO2 -, 02 -, o-, and Ho- with each precursor ion having its specific domain of linearity. For high ozone concentration ranges-the interest of this study-only NO2 - and 02 - have resulted in a linear
behavior (between 1 and 100 ppmv of 03 for NO2 -and 1 and
50 ppmv of 03 for 02 -for the flow tube conditions applied in this study). In addition, no interference due to H2O content
was identified during ozone mea surements by SIFT MS for both precursor ions, which is an interesting property because water interference has been reported in the literature during
ozone measurements by an UV analyzer.31
Furthermore, the presence of nitrogen oxide contaminants and CO2 affected the ozone quantification by SIFT MS.
Therefore, secondary chemistry conceming the reaction of
CO2 and nitrogen oxides with 03 - ( characteristic product ion
of 03 with 02 -) must be taken into account in order to
accurately measure ozone concentration with 02 - precursor
ion. In the case of NO2 -precursor ion, an overlapping with the
ozone characteristic product ion was identified, incapacitating the use of NO2 - precursor for ozone quantification in the
presence of nitrogen oxides (owne generator fed by dry air).
■
AUTHOR IN FORMATIONCorresponding Author
*valerie.simon@)ensiacetfr. Tel. +33 5 34 32 35 52
ORCIDœ
Valérie Simon: 0000 0002 2624 157X
Author Contributions
The manuscript was written through contributions of ail authors. All authors have given approval to the final version of the manuscript.
Notes
The authors declare no competing financial interest.
■
ACKNOWLEDGMENTSThe authors gratefully acknowledge the financial support for the research by French National Agency for Research and Technology and Agro Innovation International ( CIFRE 2015 / 1233) and Dr. Louise Foan for the important contribution.
■
REFERENCES
(1) Loeb, B. L.; Thompson, C. M.; Drago,J.; Takahara, H.; Baig, S.
Oz.one: Sei. Eng. 2012, 34 (1), 64-77 .
(2) Ibaiiez, M.; Gracia Lor, E.; Bijlsma, L.; Morales, E.; Pastor, L.; Hemandez, F. J. Hazard. Mater. 2013, 260, 389-398 .
(3) Gonzalez Labrada, K.; Richard, R; Andriantsiferana, C.; Valdés, H.; Jauregui Haza, U. J.; Manero, M. H. Environ. Sei. Pollut. Res. 2018,
DOi: 10.1007/sll356 018 3S59 9.
(4) Monneyron, P.; Manero, M. H.; Manero, S. Can. J. Chem. Eng.
2007, 85 (3), 326-332.
(5) Bildsoe, P.; Adarnsen, A P. S.; Feilberg, A Biosyst Eng. 2012,
113 (1), 86-93.
(6) Christensen, P. A; Yonar, T.; Zakaria, K Ozone: Sei. Eng. 2013,
35 (3), 149-167.
(7) Surnmerfelt, S. T.; Hochheimer, J. N. Prog. Fish Cult 1997, 59,
94-105.
(8) Li, X; Zhang, G.; Pan, H. J. Hazard. Mater. 2012, 199-200,
255-261.
(9) Vega, E.; Martin, M. J.; Gonzalez Olmos, R Chemosphere 2014,
109, 113-119.
(10) Skalska, K.; Ledakowicz, S.; Louwe, R; Szymczak, R Chem.
Eng. J. 2017, 318 (2), 181 -188.
(11) Williams, S.; Campos, M.F.; Midey,AJ.; Arnold,$. T.; Morris, RA; Viggiano, A A
J.
Phys. Chem. A 2002, 106, 997-1003.(12) Pekarek, S. Acta Polytuh. 2003, 43 (6), 47-51.
(13) Abou Saoud, W.; Assadi, A. A; Guiza, M.; Bouzaza, A; Aboussaoud, W.; Soutrel, L; Ouederni, A; Wolbert, D.; Rtimi, S.
Chem. Eng.
J.
2018, 344 (March), 165-172.(14) Marshall, D. L.; Pham, H. T.; Bhujel, M.; Chin,J. S. R; Yew,J.
Y.; Mori, K; Mitchell, T. W.; Blanksby, S.J.AnaL Chem. 2016, 88 (5), 2685-2692.
(15) Smith, D.; $panel, P. Mass Spectrom. Rev. 2005, 24, 661 -700.
(16) Huffel, K; Van; Heynderickx, P. M.; Dewulf, J.; Van
Langenhove, H. Chem. Eng. Trans. 2012, 30, 67-72.
(17) Vitola Pasetto, L.; Richard, R; Pic, J. S.; Manero, M. H.; Violleau, F.; Simon, V. Int J. Environ. Anal. Chem. 2019,
DOI: 10.1080/03067319.2019.16S0919.
(18) Vitola Pasetto, L.; Simon, V.; Richard, R; Pic,J. S.; Violleau, F.;
Manero, M. H. Chemosphere 2019, 235, 1107-111S.
(19) Hera, D.; Langford, V.; McEwan, M.; McKellar, T.; Milligan, D.
Environments 2017, 4 (1), 16.
(20) Hm1ter, E. P. L; Lias, S. G. J. Phys. Chem. Ref Data 1998, 27
(3), 413-6S6.
(21) Guimbaud, C.; Catoire, V.; Bergeat, A; Michel, E.; Schoon, N.; Amelynck, C.; Labonnette, D.; Poulet, G. Int
J.
Mass Spectrom. 2007,263, 276 -288.
(22) Fahey, D. W.; Bohringer, H.; Fehsenfeld, F. C.; Ferguson, E. E.
J.
Chem. Phys. 1982, 76 (4), 1799-1805.(23) Dotan, I.; Davidson, J. A; Streit, G. E.; Albritton, D. L.; Fehsenfeld, F. C. J. Chem. Phys. 1977, 67 (6), 2874-2879.
(24) Rutherford, J. A; Turner, B. R; Vroom, D. A J. Chem. Phys.
1973, 58 (12), 5267-5271.
(25)$panel, P.; Smith, D. Rapid Commun. Mass Spectrom. 2000, 14,
(26) Milligan, D. B.; Francis, G. J.; Prince, B. J.; McEwan, M. J. Anal. Chem. 2007, 79 (6), 2537−2540.
(27) Francis, G. J.; Milligan, D. B.; McEwan, M. J. Anal. Chem. 2009, 81 (21), 8892−8899.
(28) IPCC. Climate Change 2013: The Physical Science Basis. Contribution of Working Group I to the Fifth Assessment Report of the Intergovernmental Panel on Climate Change: Cambridge, United Kingdom and New York, NY, 2013.
(29) Španěl, P.; Smith, D. Rapid Commun. Mass Spectrom. 2000, 14 (8), 646−651.
(30) Ferguson, E. E. Can. J. Chem. 1969, 47, 1815−1820. (31) Wilson, K. L.; Birks, J. W. Environ. Sci. Technol. 2006, 40 (20), 6361−6367.