-A
CATALYSIS AND REACTOR ENGINEERING FOR
THE ELECTROCHEMICAL CONVERSION OF
CARBON DIOXIDE TO CARBON MONOXIDE
by
Steven M. Brown
Bachelor of Science in Chemical Engineering State University of New York at Buffalo, 2013 Master of Science in Chemical Engineering PracticeMassachusetts Institute of Technology, 2015 Submitted to the Department of Chemical Engineering in partial fulfillment of the requirements for the degree of
Doctor of Philosophy in Chemical Engineering
at the
Massachusetts Institute of Technology
©tAY~'LOV
Autor...-Signature
redacted
A uthor ...
ig n - - u r -r d a -- -d
----
....
Department of Chemical Engineering December 190 2018
Certified by ...
Signatureredacted
Fikile R. Brushett Cecil and Ida Green Career Development Chair Thesis SupervisorAccepted by...Signatureredacted Patrick S. Doyle Robert T. Haslam (1911) Professor of Chemical Engineering, Graduate Officer
MASSACHUSETTS INSTITUTE Chairman, Committee for Graduate Student
OFTECHNOLOGY_
MAY 0
2
?1 1Catalysis and Reactor Engineering for the Electrochemical
Conversion of Carbon Dioxide to Carbon Monoxide
by
Steven Brown
Submitted to the Department of Chemical Engineering in December 2018, in partial fulfillment of the requirements for the degree of
Doctor of Philosophy in Chemical Engineering
Abstract:
Carbon dioxide (C02) utilization processes have garnered significant interest to both mitigate
anthropogenic greenhouse gas emissions and increase the revenue of many chemical and fuel production processes. Low-cost renewable electricity provides impetus for exploring electrochemical methods to recycleCO2 in cost-competitive and sustainable ways. Researchers have experimentally demonstratedCO2 transformations into a variety of industrially relevant
materials. Techno-economic assessments inform that the simplest transformations, such as generation of carbon monoxide (CO), appear to be the most feasible in the near future. Yet, widespread commercialization of this nascent technology has not occurred due to a number of challenges that include synthesizing stable and active catalyst materials, understanding activity-driving force relationships, identifying appropriate reactor configurations, and developing comprehensive process models.
This thesis advances both the experiment and theory of CO2 conversion to CO through
electrocatalysis and reactor engineering. A flow reactor was designed and manufactured to understandCO2 reduction in ways that traditional, batch, electroanalytical devices cannot. A key advantage is that, through the use of porous carbon electrodes, the reactor converts gaseousCO 2
to CO at the catalyst-electrolyte interface in a continuous fashion, alleviating the mass transport limitations common to liquid-phase CO2 delivery systems. To facilitate this transformation, a
carbon-supported gold nanoparticle catalyst was synthesized and deposited onto gas diffusion electrodes. These nanoparticles achieved high selectivity (>90%) to CO formation over the competing hydrogen evolution side reaction. Traditional electrokinetic analyses (e.g., Tafel) were largely unsuccessful at describing the observed current-potential relationship, prompting a rigorous follow-up study on electrokinetics wherein Marcus theory and mass transport convolution, amongst other considerations, were explored. Bayesian statistics concluded that, despite the ubiquitous implementation of Butler-Volmer kinetics in literature, in actuality, a Marcus-Hush-Chidsey model provides the most accurate description of the electrochemical reduction of CO2 to CO. The implications of this result are significant, potentially resulting in
order of magnitude differences in current density projections at high overpotentials. Overall, this thesis experimentally measured catalysis rates in a specialized electrochemical flow cell, unimpeded by mass transport, and leveraging these results, as well as those from prior literature, advanced electrokinetic descriptions of C02 conversion all towards furthering the commercial prospects of this electrochemical technology.
Thesis Supervisor: Fikile R. Brushett, Associate Professor of Chemical Engineering Title: Cecil and Ida Green Career Development Chair
ACKNOWLEDGEMENTS:
My five and a half years of graduate school have been filled with excitement, learning, and
personal growth. During my tenure at MIT, I have shared experiences with many wonderful people in professional and social environments. I am thankful for all of these relationships that have uniquely shaped my tenure as a Ph.D. student.
First and foremost, I would like to wholeheartedly thank my advisor, Professor Fikile R. Brushett, for playing a critical role in my development as a researcher. As the first chemical engineering graduate student to join the Brushett group, I required a significant amount of attention from Fik and he always found time to meet with me and provide guidance, even if it meant exchanging emails at two o'clock in the morning. He adapted his advisement style to suit my needs at the various stages of my doctoral studies and his intellectual curiosity kept me mentally stimulated. I feel privileged to have worked with him and greatly improved as a scientist under his guidance. Also, I would like to thank my thesis committee members Professors Alan Hatton, Martin Bazant, and Yogi Surendranath for supporting my research and professional development.
I appreciate the support of all my friends in the Brushett research group. We had wonderful times
together and you made coming into the laboratory and doing work in the office an enjoyable experience under all circumstances. Jeff Kowalski and John Barton, it was my pleasure joining the Brushett group with you that first year at MIT and developing such close friendships. To the Energy Conversion subgroup, Mike Orella and McLain Leonard, we may have been smaller than the Energy Storage subgroup but that just brought us closer together. I learned a lot and had fun with both of you on our many shared projects. Kyler Carroll, during your post doc you were like a second advisor to me and looking back on our time together in lab always brings a smile to my face. Liang Su, though we never had the pleasure of collaborating on a research project, during your time at MIT we became great friends and I always appreciate your advice. To the post docs in my subgroup, Chaerin Kim and Sujat Sen, it was my pleasure to work alongside you. Thank you to Jessie Hsiao, an undergraduate researcher that worked closely with me, for four years of excellent work in the laboratory. Even though he was formally in the Bazant lab, Kameron Conforti was a close laboratory neighbor that was always there to bounce ideas off of and has my gratitude. Again, thank you to everyone that I interfaced with through the Brushett research group.
Lastly, I would like to thank my family for all of their love and support. At the end of my fourth year of graduate school I married the love of my life, Kaitlyn Adam, and she has been extremely caring and motivational during my studies. Regardless of long work hours or stressful projects, she is an unending source of happiness in my life. Thank you to my sister, Stephanie Brown, for motivating me to do my best as well as keeping my brain active outside of work with conversations about epic fantasy series. Of course, none of this would have been possible without my fantastic parents, Michael and Donna Brown. Their upbringing instilled important values in me and shaped the man I am today. I know they are proud of me and my accomplishments and I want to thank them for playing and integral role in everything that I do.
Table of Contents: A bstract: ... 3 Table of Contents:... 7 List of Figures ... 11 List of Tables: ... 22 1. Introduction ... 23
Energy and the E nvironm ent ... . 23
Electrochem ical Production of Fuels and Chem icals ... . 25
Background on Electrochemical Conversion of C02 to CO... 28
3.1. Therm odynam ics...28
3.2. K inetics... 30
3.3. M ass Transport ... 33
Thesis Outline ... 34
C atalyst D evelopm ent... 39
Introduction... 39 Experim ental... 42 2.1. M aterials... 42 2.2. Synthesis ... 43 2.3. M aterials Characterization... . 44 1. 2. 3. 4. II. 1. 2 .
2.4. Electrochem ical Characterization... . 45
3. Results and Discussion ... 46
3.1. X-Ray Diffraction (XRD)... . 46
3.2. Therm ogravim etric Analysis (TGA) ... . 47
3.3. X-Ray Photoelectron Spectroscopy (XPS)... . 49
3.4. Transm ission Electron M icroscopy (TEM )... 51
3.5. Electrochem ical Analysis ... 52
4. Conclusion ... 56
5. Acknowledgem ents... 57
1 I. Reactor and Electrode Engineering... 59
1. Introduction... 60
2. Experim ental... 62
2.1. Au N anoparticle Synthesis ... . 62
2.2. Au N anoparticle Characterization ... . 63
2.3. Electrode Preparation ... . 64
2.4. CO2 Reduction Reaction Experim ents ... 66
2.5. Hydrogen Oxidation Reaction (HOR) Experim ents:... 67
3. Results and Discussion ... . 68
3.2. Hydrogen Pump...
3.3. Catalyst Loading...
3.4. Im pact of Reactant Flow Rate ...
3.5. TafelA nalysis... 3.6. Electrode D urability ... 3.7. Polarization M odel ... 72 74 76 78 80 81 Conclusions... 84
A cknow ledgem ents... 85
A ppendix... 8 6 Electrochem ical K inetic M odeling ... . 95
Introduction... 96
M ethodology ... 102
2.1. Electrochem ical Kinetic Theories ... 102
2.2. M odelFitting and Goodness of Fit... 104
Results and D iscussion ... 107
3.1. Butler-V olm er K inetics ... . 108
3.2. Butler-V olm er K inetics w ith M ass Transport ... 109
3.3. M arcus-H ush-Chidsey K inetics... . 112
3.4. Series Resistance M odifications to BV and M H C K inetics ... 114 4. 5. 6. IV. 1. 2. 3.
3.5. Quantitative M odel Com parison ... 117
4. Conclusions... 120
5. A cknow ledgem ents... 121
6. G lossary of Term s... 122
7. Appendix... 123
V . Techno-econom ic M odeling... 137
1. Introduction... 138
2. Operating Expenditure Techno-Econom ic M odel... 138
3. Capital Expenditure Techno-Econom ic M odel ... 142
3.1. M odelD escription ... 142
3.2. Results and D iscussion ... 147
4. Conclusions... 153
5. Appendix... 154
V I. O utlook and Conclusions ... 157
1. Opportunities forC0 2Electrolysis ... 157
1.1. Electrode Engineering for Water Management towards Stable Operation ... 157
1.2. Co-Electrolysis for D ual Process V alorization... 158
2.Sum m ar ... 158
List of Figures:
Figure 1: (a) Atmospheric carbon dioxide levels reported in parts per million at Mauna Loa,
Hawaii. The data points in red are mean monthly values centered on the middle of the month and
the black line is the trend corrected for the average seasonal cycle.5 (b) Breakdown of totalC02
released in the United States by economic sector.' Electricity generation and transportation are the
largest sourcesof CO2 emissions. However, electricity generation and industrial consumption are
the target markets because they are stationary applications. ... 24
Figure 2: Electrochemical synthesis gas production and applications. Renewable electrons and
CO2are fed into an electrochemical cell to form CO. Water electrolysis, using renewable energy,
is used to generate H2. Synthesis gas is the combination of H2and CO, typically in a 2:1 ratio, and
used to create fuels and commodity chemicals such as ammonia and methanol. Water (not shown)
is also a reagent in H 2generation and can be used for CO generation. References for the images
are 29-32 ... 27
Figure 3: Impact of catalysis onCO 2reduction product selectivity. (a) Illustration of the various
products of CO2 electrolysis and the corresponding bulk metals that lead to their formation. (b)
Plot of current efficiency (selectivity) for CO2 reduction, against H2production, as a function of
electrode potential (V) vs the reversible hydrogen electrode (RHE) for bulk metals (adapted from
Cave et al.)67. To demonstrate catalysis advances, three points are overlaid (red) corresponding to
a nitrogen-doped graphene quantum dots (NGQDs),57 nanoporous silver (Np-Ag),49 and
Figure 4: Plot of limiting current density as a function of boundary layer thickness. This calculation
assumes the diffusion coefficient and solubility of CO2 in an aqueous solution and a two-electron
tran sfer. ... 3 4
Figure 5: XRD peaks of CB and Au/C catalysts... 47
Figure 6: Thermal graphs of CB and Au/C catalysts... 49
Figure 7: XPS results of oxidation states of Au for 05, 15, 30, 40, 50 and
Au-6 0 ... 5 0
Figure 8: TEM images of CB and Au/C catalysts as well as a statistical particle size distribution
for each A u/C catalyst... 52
Figure 9: HR-TEM of Au-15 showing the internal crystalline structure with emphasis on lattice
d-spacings of (111) and (200) facets. ... 52
Figure 10: Activity (a) and selectivity (b) for all catalysts in a 1 h chronoamperometry experiment
at -1.3 V vs Ag/AgCl. Selectivity (c) and specific CO current density (d) as a function of electrode
p o ten tial... 5 3
Figure 11: Selectivity (a) and activity (b) results of Au-40 sample for a 48 h durability experiment.
... 5 6
Figure 12: Methodological overview of the experimental approach. First, Au/C nanoparticles were
synthesized and deposited onto a gas diffusion electrode (GDE) substrate. Next, a continuous-flow
cell was designed, integrated into theCO2conversion experimental setup, and validated. With the
platform for electrode screening, we optimized catalyst loading, assessed kinetic properties, and
Figure 13: (a) Au/C synthesis overview highlighting the simplistic one-pot method, short reaction
time, and minimal effort (i.e., washing and centrifuging) needed to isolate particles. (b) TEM
image of Au NPs. (c) Particle size distribution of Au NPs where the mean is 6.8 nm and the
standard deviation is 2.8 nm. The distribution is slightly skewed right due to large diameter
o u tliers... 6 4
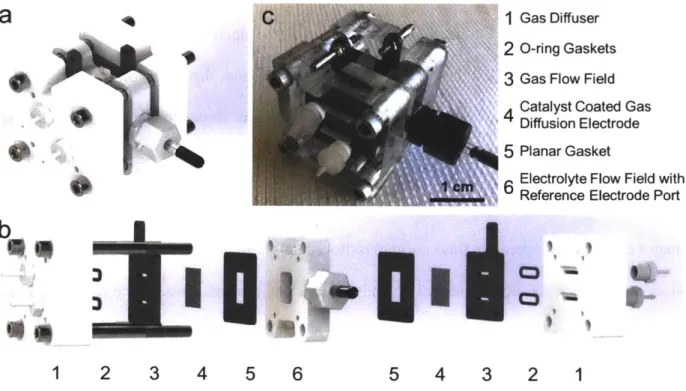
Figure 14: Continuous-flow cell for single electrode characterization. Solidworks renderings of (a) the collapsed view and (b) the exploded view so that individual components can be realized. (c) A photograph of the assem bled cell... 69
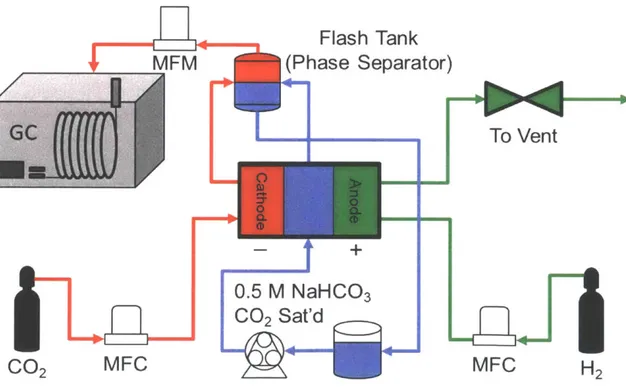
Figure 15: Schematic of theCO 2 electrolyzer system depicting mass flow streams and regulating
equipment. GaseousCO2 and H2 are shown in red and green, respectively. Flow rate is precisely
controlled with a mass flow controller to regulate the pressure balance across the GDEs in the cell.
TheCO2-saturated 0.5 M NaHCO3 electrolyte, shown in blue, is pumped through the cell and drawn from the gas recovery device to a large reservoir ... 71
Figure 16: Plots of the hydrogen oxidation experimental results to quantify mass transport limitations of a gaseous reactant to the catalyst layer of a gas diffusion electrode. Hydrogen oxidation current density as a function of (a) anode potential vs RHE and (b) iR-corrected anode potential vs RHE in cyclic voltammetry experiments at a scan rate of 1 mV s- with H2flow rates
ranging from 0.5 - 2.0 mL min-. Two scans are shown for each H2flow rate. The stoichiometric
current density limitations are annotated in (b) to illustrate the theoretical upper bound. ... 74 Figure 17: Catalyst loading study results: (a) specific CO current (A g-) as a function of catalyst loading identifies a maximum Au usage at 0.3 mg cm-2 Au/C; (b) CO current density (mA cm2 )
peaks at 3 mg cm-2 Au/C and guides catalyst loading for future studies. Error bars are the standard
error of three experim ents... 75
Figure 18: Impact of (a) gas and (b) liquid flow rate on the CO partial current density from the
reductionof C02.Overall, a strong dependence onCO2flow rate is observed at low gas flow rates
but minimal dependence was observed at higher gas flow rates. No discernable trend was found
between CO current density at liquid flow rate. ... 77
Figure 19: (a) Tafel analysis of two linear regions using a Volmer kinetic model.
Butler-Volmer parameters are provided and significant differences are obtained between the high and low
overpotential regions. (b) Selectivity as a function of overpotential may be correlated with the
different Tafel regions in that drastic selectivity changes occur in the low overpotential region but
minimal selectivity changes occur in the high overpotential region... 79
Figure 20:(a) Faradaic efficiency as a function of time for a 50 h durability run where black circles, red squares, and blue diamonds correspond to H2, CO, and their sum, respectively. (b) Partial
current densities where the species match the colors from (a). The average CO faradaic efficiency
is 89.6 ±4.9 % and exhibits only a minor decrease over time. However, the current density
decreases approximately 50 % over the course of the run... 81
Figure 21: (a) Electrochemical polarization model results showing the cumulative potential
breakdown starting from the reversible potential and then including kinetic overpotential, ohmic
losses, and mass transport overpotential. Note that the ohmic curve lies underneath the mass
transport curve due to extremely small mass transport overpotentials in this current range.(b) A
comparison between our data and literature data, both are not iR-corrected, to portray similar
area specific resistances, but the same kinetics and mass transport properties, are shown to help
illustrate the im pact of decreased resistance ... . 84
Figure 22: Calibration curves for (a) carbon monoxide and (b) hydrogen. The linear fit was used
during data processing with the intercept forced through the origin. ... 86
Figure 23: Plot depicting slow cyclic voltammetry (lines) at a scan rate of 1 mV/s overlaid with
chronoamperometry data (markers) to show that they are nearly equivalent. Absolute current from
a 2.5 cm2 active area is plotted against potential vs RHE for both corrected (black) and not
iR-corrected (red) data sets. ... 87
Figure 24: A variety of gas reactant flow fields. The top images show where the gas enters and
exits the flow field. The bottom images show the available path for the gas to take. Note that some
flow fields (e.g. interdigitated and flow through) force reactant gas through the gas diffusion
electrode (not shown) while the others have an uninhibited pass from the inlet to the outlet (e.g.,
sheath an d p arallel). ... 87
Figure 25: Experimental setup with key pieces of equipment highlighted. (a) Equipment labelled
#1 is the column of water the H2 gas is flowed into to regulate back pressure, #2 is the liquid
electrolyte reservoir, #3 is the gas recovery device, #4 is theCO2mass flow controller, #5 is the
CO2mass flow controller, #6 is the H2mass flow controller. A zoomed in view of #1, the water
column to regulate pressure, is shown in (b) where the depth is noted by the black double arrow.
The deeper the H2 the more back pressure on the H2 side... 88
Figure 26: CO selectivity as a function of electrolyte flow rate. Three potential traces are shown
Figure 27: (a) Breakdown of the best fit polarization model by sources of overpotential. (b)
Cumulative best fit kinetic model where the area specific resistance is a fitting parameter resulting
in an im p rov ed fit... 92
Figure 28: Sample faradaic efficiency calculation. (a) Equation for faradaic efficiency calculation.
The pressure (P), volumetric flow rate (V), concentration of species i (Ci), temperature (T), and
current (j) are purple, green, red, yellow, and blue, respectively because these variables are
measured experimentally and averaged for a short period leading up to the sampling of the gas
chromatograph. (b-f) Plots of the variables over time for a 1-hour run with four gas chromatograph
(GC) samples. The colored areas of the plot correspond to the averaged period leading up to a GC
sa m p le . ... 9 2
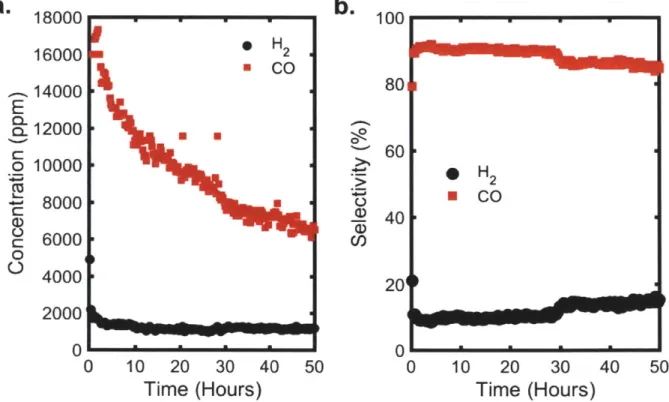
Figure 29: (a) Concentration and (b) selectivity of hydrogen (black) and carbon monoxide (red)
over the course of a 50-hour durability run. ... . 93
Figure 30: Tafel plot of literature data for the electrochemical conversionof CO2 to COon Au
cataly st m aterials... 9 9
Figure 31: BV analysis showing the (a) best-fit curves overlaid on the experimental data and (b)
charge transfer coefficients... 108
Figure 32: Analysis of the BV model with mass transport consideration showing the (a) best-fit
curves overlaid on the experimental data, (b) charge transfer coefficients, and (c) boundary layer
thickness corresponding to the limiting current density. ... 111
Figure 33: MHC analysis showing the (a) best-fit curves overlaid on the experimental data and (b)
Figure 34: BV + R and MHC + R analyses showing the (a, b) best-fit curves overlaid on the
experimental data, (c) charge transfer coefficients, (d) reorganization energies, (e, f) film
resistan ces. ... 1 16
Figure 35: Computed BIC for each of the representative data sets presented, comparing the d ifferent m o d els. ... 1 17
Figure 36: Normalized data sets that are aggregated into a single set for model fitting and
co m p ariso n ... 1 19
Figure 37: Computed BIC for each of the individual models on the aggregate normalized data
su p erset. ... 12 0
Figure 38: (a) Residuals for the BV kinetic analysis of gold catalyst as a function of overpotential.
(b) The same residuals normalized from -1 to 1 over a normalized overpotential range of -1 to 0.
Normalization of the residuals was accomplished by: first adding the minimum residual, second
dividing by half of the new maximum value, and then subtracting one. Normalization of the
overpotentials was accomplished by adding the maximum (least negative) value and then dividing
by the new m inim um value... 123
Figure 39: Best-fit exchange current densities for BV analysis on Au literature data. ... 123
Figure 40: Plot of limiting current density as a function of boundary layer thickness. Typical
boundary layer thicknesses of planar electrodes in electrochemical reactors is 40 - 100 pm, which
corresponds to limiting current densities from 15 - 30 mA cm-2. Governing equation is
J= nFDC ,Al, 1 where J is limiting current density, n is moles of electrons transferred per mole of product, F is Faraday's constant, D is the diffusion coefficient of the reacting species, and 1 is the
Figure 41: (a) Residuals for the BV + MT kinetic analysis of gold catalyst as a function of
overpotential. (b) The same residuals normalized from -1 to 1 over a normalized overpotential
range of -1 to 0. Normalization of the residuals was accomplished by: first adding the minimum
residual, second dividing by half of the new maximum value, and then subtracting one.
Normalization of the overpotentials was accomplished by adding the maximum (least negative)
value and then dividing by the new m inimum value... 125
Figure 42: Best-fit exchange current densities for BV + MT analysis on Au literature data... 125
Figure 43: (a) Residuals for the MHC kinetic analysis of gold catalyst as a function of
overpotential. (b) The same residuals normalized from -1 to 1 over a normalized overpotential
range of -1 to 0. Normalization of the residuals was accomplished by: first adding the minimum
residual, second dividing by half of the new maximum value, and then subtracting one.
Normalization of the overpotentials was accomplished by adding the maximum (least negative)
value and then dividing by the new m inimum value. ... 126
Figure 44: Best-fit kinetic prefactors for MHC analysis on Au literature data. ... 126
Figure 45: Surface plot of reorganization energy as a function of both the distance to the electrode
and the reactant sphere radius... 127
Figure 46: (a) Residuals for the BV + R kinetic analysis of gold catalyst as a function of
overpotential. (b) The same residuals normalized from -1 to 1 over a normalized overpotential
range of -I to 0. (c) Residuals for the MHC + R kinetic analysis of gold catalyst as a function of
overpotential. (d) The same residuals normalized from -1 to 1 over a normalized overpotential
range of -1 to 0. Normalization of the residuals was accomplished by: first adding the minimum
Normalization of the overpotentials was accomplished by adding the maximum (least negative)
value and then dividing by the new minimum value. ... 128
Figure 47: Best-fit (a) exchange current densities for BV + R and (b) kinetic prefactors for MHC
+ R analyses on A u literature data ... . 129
Figure 48: The complete fitting analysis of the BV model to the Ag data showing (a) fitting curves
over the experimental data, (b) charge transfer coefficients, (c) exchange current densities, (d)
residuals, and (e) norm alized residuals... 130
Figure 49: The complete fitting analysis of the BV + MT model to the Ag data showing (a) fitting
curves over the experimental data, (b) charge transfer coefficients, (c) limiting current densities,
(d) boundary layer thicknesses, (e) exchange current densities, (f) residuals, and (g) normalized
re sid u a ls. ... 13 1
Figure 50:The complete fitting analysis of the MHC model to the Ag data showing (a) fitting
curves over the experimental data, (b) reorganization energies, (c) kinetic prefactors, (d) residuals,
and (e) norm alized residuals. ... . 132
Figure 51: The complete fitting analysis of the BV + R model to the Ag data showing (a) fitting
curves over the experimental data, (b) charge transfer coefficients, (c) film resistances, (d)
exchange current densities, (d) residuals, and (e) normalized residuals... 133
Figure 52: The complete fitting analysis of the MHC + R model to the Ag data showing (a) fitting
curves over the experimental data, (b) reorganization energies, (c) film resistances, (d) kinetic
prefactors, (d) residuals, and (e) norm alized residuals. ... 134
Figure 53: Computed BIC for each of the Ag data sets presented, comparing the different models.
Figure 54: Baseline TE model to identify profit margins using thermodynamic energy limits.
Vertical error bars account for variations in electricity cost and horizontal production costs account
for variations in cell voltage. ... 140
Figure 55: TE model focused only on formic acid and CO production. A comparison is drawn
between using the oxidation of water to form oxygen, glycerol to form acetic acid, and glycerol to
fo rm ox alic acid . ... 14 1
Figure 56: Breakdown of cost for the base case conversionof CO2 toCO. For reference, a 20-year
lifetime is assumed to relate capital and operating expenditure. ... 148
Figure 57: Tornado plot showing key parameter sensitivity. The change in total cost is plotted as
a function of a 20% change in each key parameter from its base case value while the other
param eters are held constant... 149
Figure 58: Impact of process lifetime and faradaic efficiency on the production cost of CO from
C O 2 ... 1 5 0
Figure 59: Production costs of CO and H2from three different model normalized by (a) mass and
(b ) m o le s... 15 2
Figure 60: Comparison between the production cost of synthesis for a single process that
inefficiently produces CO but simultaneously generates hydrogen and coupled process for
individual production of H2and CO. A mole of synthesis gas is comprised of 1 mole of CO and 3
m o les o f H 2. ... 15 3
Figure 61: TE model with future electricity pricing where the mean cost of electricity is 0.015 $
Figure 62: Visual thesis summary illustrating that the reactor we developed is at the intersection
of the work in catalyst development, electrode testing and engineering, kinetic modeling, and
List of Tables:
Table 1: Gibbs free energy and standard potential for CO2 reduction to CO. Potentials reported
against the standard hydrogen electrode (SHE)... 29
Table 2: Binding energies (in eV) of CIs and Ols of CB and Au/C catalysts... 50
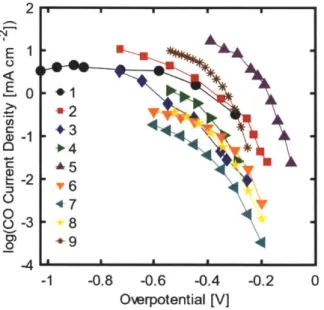
Table 3: Literature data with Au catalyst materials used for kinetic modeling analyses. Each trace
is assigned a unique numerical identifier, the catalyst form, the supporting material if applicable,
and the electrolyte composition. For additional information a reference is provided. ... 99
Table 4: Techno-economic model input parameters for the base case scenario. A description of
each parameter is included along with its value, units, and a reference indicating why the value
I. Introduction
This introductory section provides the necessary background information to enable understanding
of my thesis entitled Catalysis and Reactor Engineeringfor the Electrochemical Conversion of
Carbon Dioxide to Carbon Monoxide. Energy trends and economics motivate the development of energy efficient carbon dioxide utilization processes to generate chemicals and fuels in a
sustainable fashion. Background on the thermodynamics, kinetics, and mass transport of carbon
dioxide conversion to carbon monoxide are provided. There is also a general outline of this
document to assist readers in identifying sections pertinent to them.
1. Energy and the Environment
Energy is of central importance to society and its availability and affordability have been key
progress drivers over the past century. Currently, petrochemicals are the backbone of the global
energy economy and the source of a plethora of fuels and chemicals that enable the continued
advancement of modern society.' Due to their high energy density and low cost, fossil fuels are
widely utilized to meet the growing energy demand, which is projected to increase 48% by 2040.2
However, fossil fuel combustion produces vast quantities of greenhouse gases, primarily carbon
dioxide(CO2),which can alter the environment both locally and globally.3 For reference, 36 billion
tonnesof CO2were released in 2013 alone.4 As a result of these emissions, globalC02 levels have
been steadily rising since the 1960s as shown in Figure la, which contains data from Mauna Loa,
Hawaii. 5 In the United States, electricity generation is the primary source of these emissions,
followed by the transportation and industrial sectors as shown in Figure lb.1
AnthropogenicCO2 emissions are negatively influencing the climate through the greenhouse gas
the atmosphere, which plays a significant role in regulating the surface temperature of our planet.6
In turn, an increasing global mean temperature leads to melting of the polar ice caps, rising sea
levels, and detrimental changes to aquatic environments.3 Ocean acidity serves as an illustrative
microcosm for global warming, wherein an increase inCO2partial pressure decreases the pH of
aqueous environments and corrodes the shells of marine organisms. Projections posit that without
a reduction of greenhouse gas emissions, the consequences could be as drastic as economic
disruption, mass civilian relocation, and increases in the emergence of infectious diseases.7 In the
near future, political pressure through regulations may economically motivate or force
carbon-emitting facilities and vehicles to switch to alternative energy sources.8 Therefore, many upcoming
technologies are focused on identifying and implementing solutions to decouple carbon emissions
from energy use and chemical production.90
a.
Atmospheric C02at Mauna Loa Observatoryb
Commercial Residential 5%6%
400. Scripps Institution of Oceanography
NOAA Earth System Research Laboratory Agriculture
z 9% Zi 380 ---J 3Transportation
4229%
u360 Industry a. 340- 22% B9-lecr city 29% 320-1960 1970 1980 1990 2000 2010 2020 U.S. Greenhouse Gas Emissions by Economic Sector
YEAR
Figure ]: (a) Atmospheric carbon dioxide levels reported in parts per million at Mauna Loa, Hawaii. The data points in red are mean monthly values centered on the middle of the month and the black line is the trend correctedfor the average seasonal cycle.5 (b) Breakdown of total CO2 released in the United States by economic sector.' Electricity generation and transportation are the largest sources of CO 2 emissions. However, electricity generation and industrial consumption are the target markets because they are
Renewable energy sources, specifically solar and wind power, are viewed as the most promising
solution to enable low-cost green electricity in the future." However, the intermittent nature of
renewables makes grid integration challenging due to their inherent variability in electricity
generation, necessitating an energy storage or conversion process. Grid-scale energy storage
systems (e.g., redox flow batteries, lithium ion batteries, pumped hydro, etc.) are one viable option
to temporarily store energy and assist with load-levelling.12-14 Alternatively, the excess electricity
during peak generation could be fed into industrial processes for chemical manufacturing.
2. Electrochemical Production of Fuels and Chemicals
The increasingly urgent need to decouple carbon emissions from societal development without
stifling economic growth necessitates the development and deployment of sustainable, reliable,
energy solutions.15 "16 The development of efficient electrochemical processes, which leverage
renewable electrons, would enable the decarbonization of the industrial sector and simultaneously
spur plant-wide innovations. Incorporating electrochemical unit operations has the potential to:
reduce plant costs through modularity and process intensification, improve safety and decrease
reactor costs through ambient reaction conditions, and increase flexibility through tunable product
generation. The efficient interconversion of electrical and chemical energy can enable the
deployment of green technologies that support the decarbonization of the electric grid, power the
automotive fleet, and offer new opportunities for chemical manufacturing. Moreover, electrochemistry may allow new molecular transformations, unlocking previously inaccessible or
unimaginable synthetic routes.
In part due to the advent of low-cost renewable electricity for potentially cost-competitive
electrochemical manufacturing processes,17-20 CO2 recycling has recently garnered interest as a
methods would be ideally suited to process concentrated C02 streams, sourced from power
generating or manufacturing facility emissions, rather than direct atmospheric utilization. 2 4
Concomitant to the reduction in greenhouse gas emissions,2 5 additional revenue could be realized
from such C02 recycling schemes as increased fuel or product yields are achieved. Therefore, upgrading CO2 into fuels could simultaneously lessen the environmental footprint of a
carbon-emitting facility and provide a useful process for the consumption of surplus electrical energy.26
The transportation sector, in particular, would benefit from liquid fuels derived from recycled CO 2
as large vehicles (e.g., trucks, planes, ships) that are not part of tethered fleets,27 require liquid
fuels to achieve long ranges with high payloads, beyond what is feasible with battery storage.28
In addition to fuels, electrochemical production of synthesis gas, a mixture of carbon monoxide
(CO) and hydrogen (H2), may become a disruptive technology. As the name implies, synthesis gas
is an important building block for hydrocarbon manufacturing, especially in Fischer-Tropsch
processing schemes. A simple schematic for green production of synthesis gas is shown in Figure
2. CO is formed in an electrochemical cell from CO 2 and renewable electrons. H2 is produced via
Hydrogen Fuels Renewable Electrons Synthesis Carbon Gas Dioxide Commodity Chemicals
Carbon
MonoxideFigure 2: Electrochemical synthesis gas production and applications. Renewable electrons andCO2 are
fed into an electrochemical cell toform CO. Water electrolysis, using renewable energy, is used to generate H2. Synthesis gas is the combination of H2and CO, typically in a 2:1 ratio, and used to create fuels and
commodity chemicals such as ammonia and methanol. Water (not shown) is also a reagent in H2generation
and can be usedfor CO generation. Referencesfor the images are-.
Besides large-scale terrestrial applications, a number of high-value niche applications for C02 conversion exist, for example, regulationof CO2 for life support in confined spaces such as a
submarine or spaceship. Presently, oxygen generation for life support involves water splitting and,
in some instances, the Sabatier reaction to recover water fromCO2 and H2. TheCO 2 reduction
reaction could improve this process by eliminating the need to store H2, reducing the energy costs,
and operating under more amenable conditions. A second niche application would be in-situ fuel generation for extraterrestrial exploration. For example, the Martian environment is comprised of
from a concentrated local resource.33 These applications require extremely reliable CO
2
transformations and are considerations for when the technology has greatly matured.
3. Background on Electrochemical Conversionof CO2 to CO
Electrocatalysis research has demonstratedC02 reduction to form multiple products at varying
rates and efficiencies;34-36 techno-economic assessments distill these options to identify the most
valuableCO2 recycling schemes.37-4° Experimentally, researchers have produced formate/formic
acid,41-44 carbon monoxide (CO),45-49 methane,55 ethylene,52-54 and other products55-58 from
C02, but only CO and formate have shown great promise in techno-economic assessments at
current electricity prices.5
9,60 Due to the large market presence of synthesis gas,61 silver and gold (Au) catalysts,6 2 which produce CO, are preferred to tin and lead catalysts,63 which produce
formate. The thermodynamic, kinetic, and mass transport consideration for the electrochemical
conversionof C02 toCO are discussed here.
3.1.Thermodynamics
Thermodynamic calculations are useful for setting bounds or limits on molecular transformations,
and we determine the minimal potential required for the formation of CO fromC02 through two
different reaction schemes. Using free energies of formation of the relevant species (from the 9 2"d
edition of the CRC Handbook),64 the Gibbs free energy of each reaction was calculated. The Gibbs
free energy determines the spontaneity of a reaction, but cannot specify the rate, where a positive
value indicates that energy is required as an input to facilitate the transformation. By definition,
the standard potential is related to the free energy through Equation (1). Table 1 contains the Gibbs
free energies and standard potentials of two reactions forC02 conversion to CO. Any applied
E0= AG O (1)
nF
Table 1: Gibbs
free
energy and standard potentialforCO2 reduction to CO. Potentials reported against the standard hydrogen electrode (SHE).Reaction AGOrxn (kJ mol-1) Standard Potential, E° (V) vs SHE
CO2 + H20+2e- >CO+20H- 179.8 -0.932
CO2 + 2H' +2e- *CO+ H20 20.1 -0.104
Altering the local concentration of any species involved in the reaction will change the equilibrium
potential. The Nernst equation, given in Equation (2), provides a means of quantifying the
electrode potential as a result of the shift. The activities in this equation are local concentrations
normalized by the reference state concentration which are generally defined to be, at a temperature
of 298 K, concentrations of 1 M for aqueous species, and pressures of 1 atm for gases. For close
approximation of most aqueous species the bulk concentration can be substituted in, especially for
convectively mixed systems,65 and partial pressures for gases can be inserted. Equation (3) is the
application of the Nernst equation to the bottom reaction in Table 1 to show how the reaction
potential varies with the partial pressure of C02, the partial pressure of CO, and the pH of the
solution. When comparing performance of catalyst materials, accounting for the reaction
conditions is important; otherwise, the comparison is not valid, and an inferior catalyst could provide misleadingly good results while a superior catalyst is disregarded. Similarly, the reference
electrode used to determine the working electrode potential must be taken into account to ensure
accurate determination of the electrode potential. Most experimental research on the CO2
reduction reaction does not occur near the standard reaction potential due to severe kinetic limitations which necessitate that a large overpotential to be applied to drive the reaction at an acceptable rate, especially on bulk metal catalysts.
E=Eo RTln ° (2)
nF aR
E = -0.104V+0.01281n(P)-,0.059pH -0.01281n(Po)) (3)
3.2. Kinetics
Designing and engineering novel catalytic surfaces for theCO2reduction reaction is a major field
of research that has seen tremendous advances to enable selective and energy efficient
transformations. Often attributed as being the foundation for the modem-day field, work by Hori
et al. in the early 1990s screened a host of monometallic catalysts for theirCO 2reduction activity
and grouped them by major product.3 5 Electrolysis of solubilizedCO
2 in an aqueous solution
yielded groupings by four major products: formic acid, carbon monoxide, hydrocarbons, and
hydrogen. A graphical summary is shown in Figure 3a. Copper is unique because it has
significantly higher hydrocarbon formation than any of the other metals studied, receiving much
academic interest despite the products being less economical. Of the metals that form CO, gold
required the lowest electrode potential (in magnitude) and obtained the highest selectivity. These
groupings guided the development of advanced catalyst and serve as a baseline from which to
improve.
For electrochemical systems, catalyst improvements are often manifest as either increased energy
efficiency or increased target product selectivity, although other criteria such as durability and
throughput are relevant as well. From the constant current electrolyses by Hori and co-workers, a
plot of current efficiency towardsCO2 reduction as a function of working electrode potential was
generated as shown in Figure 3b. Catalyst activity in the top right region is optimal, corresponding
line at -0.1 V cannot be exceeded. Nanomaterials offer many advantages to flat polycrystalline
materials due to higher surface area to volume ratios and a greater fraction of edge, step, and terrace
sites, which often exhibit greater catalytic activity.66 Three nanostructured catalysts:
nitrogen-doped graphene quantum dots (nonmetal), nanoporous silver, and oxide-derived gold, are overlaid
on this plot to demonstrate improvement over bulk materials. The oxide-derived gold achieves
near-unity current efficiency at modest overpotentials of only a few hundred millivolts. This
broadly covers the relevant experimental kinetics of CO2reduction and a more detailed theoretical
a.
AF
b.
100
-80
u60
40
-C20
0
0
-TIInrHg
PbTI InrHg Pb'\eSn Cd .Zn
CuNGQDs Np-Ag
O-D Au
Au
NPsPd
Ga-Ti Ni Pt Fe 1- 0 1, - I - I
-1.4
-1.2 -1.0
-0.8 -0.6 -0.4
E
vs RHE (V)
-0.2
0.0
Figure 3: Impact of catalysis on CO2reduction product selectivity. (a) Illustration of the various products
of CO2 electrolysis and the corresponding bulk metals that lead to their formation. (b) Plot of current
efficiency (selectivity) for CO2reduction, against H2production, as afunction of electrode potential (V) vs
the reversible hydrogen electrode (RHE) for bulk metals (adaptedfrom Cave et al.)6 7. To demonstrate catalysis advances, three points are overlaid (red) corresponding to a nitrogen-doped graphene quantum dots(NGQDs),5 nanoporous silver (Np-Ag),4 and oxide-derived gold (O-D Au NPs).
rPb, Hg, In, Sn, Cd, TI Formic Acid Carbon Monoxide Au, Ag, Zn, Pd, Ga Methane Ethene Ethane Pt, Ni, Fe, Ti Hydrogen
3.3. Mass Transport
Even with efficient catalysis, commercializationof CO2 into any useful product is challenging
because of mass transport limitations in aqueous media and instability of gas delivery systems.
Catalyst materials are often evaluated in electrochemical cells that operate at relatively low current
densities (ca. 1- 10 mA cm-2).4 In contrast, current densities in the range of 0.5 - 1 A cm-2, which are typical of existing industrial electrochemical processes (e.g., chlor-alkali electrolyzers),6 9 are
needed to enable cost-effective scaling, but must be realized without sacrificing efficiency.
Aqueous-phaseCO2delivery at ambient conditions is hampered by low solubility (33mM C0 2)
and diffusivity (1.9 x 10- cm22 s-).'O7 The mass transport governed limiting current density can
be calculated through Equation (4) where LBLis the length of the boundary layer over which the
CO2must diffuse, D is the diffusion coefficient, andCBuIkis the concentrationof CO2dissolved in
the bulk electrolyte (i.e., outside the boundary layer). Experimental boundary layers for planar
electrodes have been measured to be around 70 pm72 and order of magnitude estimates place the
boundary layer thickness around 100 pm73,74 , resulting in limiting current densities < 30 mA cm-2
Therefore, gas-phase deliveryof CO2will be essential for high current density operation at ambient
conditions.24
J = nFD ""lk (4)
LB/
GaseousCO2can be fed into the system via gas diffusion electrodes (GDEs), which were originally
developed as a means of managing gas, liquid, and electron transport at interfaces within polymer electrolyte fuel cells. In this configuration, the high diffusive fluxes of gaseous CO2 enable
increased current densities, typically an order of magnitude or larger, over atmospheric liquid-phase cell designs using neat CO 2.
75
studies have focused on catalyst/electrode performance in electrochemical cells with GDEs.4 2
-Further, direct atmospheric conversion is difficult because the absoluteCO 2concentration is still
very low, only 0.04% or 0.8 g m-3. Therefore, carbon concentration and sequestration processes
will play a key role when concentrated carbon streams are not available.2 4
UN
E
ClC:
-- '0
1
00
90
80
70
60
50
40
30
20
10
0
0.
0.1
1
Boundary Layer Thickness (mm)
10
Figure 4: Plot of limiting current density as a function of boundary layer thickness. This calculation assumes the diffusion coefficient and solubility of CO2in an aqueous solution and a two-electron transfer.
4. Thesis Outline
The objective of my thesis is to understand and improve electrochemical catalysis of C02 to CO towards the development of a commercial, economically-viable, process. As an engineer, I designed and built reactors to serve as platforms for testing catalyst materials. Reactor and
electrode engineering are critical aspects of CO2 conversion that govern product throughput,
stability, and energy efficiency. The previous sections in Chapter I provided the introductory
----content onC02conversion. This section organizes the remainder of my thesis ----content by providing
a brief overview of each other chapter.
To effectively study catalysis, we needed a system and material capable of electrochemically
reducingCO2.Chapter II details the synthesis of a carbon-supported gold nanoparticle catalyst
that we developed for this purpose. Extensive characterization of our material established its composition and structure over multiple syntheses to ensure reproducibility. Specifically, we imaged the particles to measure a size distribution, quantified the gold loading on the carbon black support, and verified that the gold was in a fully reduced state (zero-valence). These gold
nanoparticles exhibited a high selectivity, > 90%, for CO formation over the competing H2
evolution reaction in a simple liquid-phaseCO 2 delivery system. Further, we optimized the ratio
of gold precious metal to the carbon support for future studies.
Next, as detailed in Chapter III, a reactor was developed to bridge the gap between catalyst studies in simple electroanalytical cells and industrial electrolyzers. Our reactor features gas-phase reactant delivery, continuous-flow operation, and a reference electrode centered between the polarized electrodes to study catalyst kinetics under more realistic operating conditions. In addition to describing the reactor, we quantify mass transport limits of the system using the hydrogen oxidation reaction as proxy forCO2 reduction, model polarization at the cathode, examine CO
production rate as a function of operating parameters, optimize catalyst loading on the GDEs, perform a kinetic study in the absence of mass transport limitations, and identify long-term stability constraints. The major results are that theCO2reduction kinetics cannot be explained solely with
Tafel analyses due to curvature, the ohmics constitute a large source of overpotential in our system because of the thick electrolyte channel, and electrode wetting/flooding is the primary source of performance decay at long times.
The inability of traditional Butler-Volmer (BV) kinetic theory to fit our catalysis results motivated
a deeper investigation into the Marcus theory of electron transfer, which is discussed in Chapter
IV. We contrasted a variety of electrochemical models, derived from BV or Marcus-Hush-Chidsey
(MHC) kinetics, by fitting them to our data as well as a survey of literature data on Au catalysts to
strengthen our findings. Unlike the phenomenological BV model, the MHC model inherently
explains much of the nonlinear Tafel behavior that has been observed with a consistent set of fitting
parameters. The validity of this model was strengthened by a goodness-of-fit analysis, using
Bayesian inference that penalized overfitting, which determined that MHC kinetics were the best
model for every data set. Further, we normalized each data set by the kinetic prefactor from the
MHC fitting, to account for differences in electrode morphology, and then fit the conglomerate
data set with each model. This analysis also showed that the MHC model has the lowest Bayesian
Information Criterion value, indicating that this model is closest to the true model based on the
observed data. Given these results, we believe that MHC kinetics are more accurate and physically
informative than Butler-Volmer kinetics. Therefore, MHC kinetics should be implemented in cost
projections that incorporate activity-driving force relationships.
Chapter V focuses on techno-economic models to guide research efforts (e.g. through target
product selection) and identify a feasible design space towards commercialization. We developed
a basic techno-economic model, accounting primarily for thermodynamics, that is focused on
estimating profit margins. Specifically, the profit margin was calculated by subtracting operating
expenditure from revenue without incorporating the additional complications of capital
expenditure. Recently, we expanded our modeling efforts to capture capital costs and incorporate
appropriate descriptors of the current-potential relationship, such as the previously mentioned
cost-savings to lab-scale performance metrics, as well as outlining the most promising pathways to
economical production of fuels or chemicals.
The final chapter of my thesis, Chapter VI, contains the major conclusions from my work as well
as an outlook for the field. The advent of renewable energy is driving down energy costs, which, in turn, enables a variety of new electrochemical processes because their economic viability is
strongly correlated with electricity price. This, coupled with growing environmental concerns
revolving around fossil fuel usage, create a substantial window of opportunity for electrochemical
generation of fuels and chemicals from recycledCO2. The major remaining challenges that are
inhibiting industrial implementationof C02recycling systems are: making durable electrodes that
are stable for long times in gas-fed systems, developing membranes to obstruct anodic CO 2
reformation from ions in solution, gaining a deeper understanding of the effect impurities have on
efficiency, and integrating aCO2 reactor into a complete system with separations trains to isolate
a pure product. Overall, in regard to the future of theC02 conversion field, I am optimistic that
commercialization will eventually be achieved and that my research has made a positive
II. Catalyst Development
This chapter is, in part, reprinted from my co-first author publication in Science of Advanced
Materials, Volume 9, 888-895, 2017, Salih, T., Brown, S. M., Kim, C., Carroll, K. J., Brushett, F. R., Bumajdad, A. Cost Effective and Scalable Synthesis of Supported Au Nanoparticles for the
Electroreduction of CO2 to CO. https://doi.org/10.1166/sam.2017.3019. Permission for
reproduction of this work was obtained on November 14th, 2018 from Dr. Hari Singh Nalwa,
Editor-in-Chief.
Towards the development of an active and selective electrocatalyst, Au nanoparticles supported
on carbon black (Au/C) were synthesized via a simple and scalable one-pot process and then tested
for the electroreductionof CO2 toCO. The bulk and surface properties of the Au/C materials were
characterized using XRD, TGA, XPS, TEM, and HRTEM techniques to ensure complete reduction
of the Au precursor and verify the composition. The synthesized Au nanoparticles have average
diameters of 10± 2 nm and exhibit promising electrochemical performance. Selectivities as high
as 93.5 % for CO formation over the undesired H2 evolution were observed at competitive rates.
Desirable performance for the electroreductionof CO2 toCO is, certainly, achievable with Au/C
catalysts prepared by a low-cost route provided that the nanoparticles are suitably sized and
optimally loaded on the carbon support.
1. Introduction
Energy is of central importance to society and the abundance, availability, and affordability of
liquid fossil fuels has been a key progress driver over the past century. Presently, fossil fuel
technologies comprise the backbone of the global energy economy with the transportation and
not be feasible due to rising populations and continuing economic growth in the developing world,
which is projected to double global energy demand by 2050.78 Non-renewable fossil fuel reserves,
which took millennia to accumulate, are finite and rapidly exhausting. Moreover, the continued
and increasing generation of anthropogenic C02 from fossil fuel combustion will likely have
negative implications for the global climate.7 980 Addressing these challenges will require scientific
and technological advances in energy systems which has sparked worldwide investment in
low-carbon / carbon-neutral power generation, carbon capture and storage, and system-wide
energy efficiency.81,82
The development of energy efficientCO 2electroreduction processes could simultaneously curb
anthropogenic CO2 emissions and provide sustainable pathways for the generation of liquid
transportation fuels and commodity chemicals. If electrochemical technologies employedCO 2
feedstocks from major emission sources (e.g., thermal power plants) and electricity from variable
renewable sources (e.g., solar photovoltaic, wind), then chemicals of economic value could be
generated in a carbon neutral fashion. Electrochemical devices are attractive for these applications
due to their ability to operate efficiently at ambient temperature and pressure, the ability to tune
reaction pathways (and thus product selectivity and generation rates) by varying the electrode
potential, and the ability to operate in a continuous flow mode at large scale.83
Catalysis is the foundation for the electrochemical C02 reduction reaction and impacts virtually
all aspects of research within the field by regulating production rates and selectivities. Early work
by Hori and co-workers demonstrated that polycrystalline gold, silver, and zinc form CO with
relatively high efficiencies (> 75%) whereas palladium, gallium, and cadmium form CO with only
moderate efficiencies (ca. 10-30%).3s The primary competing reaction is the reduction of protons
some metals. Additionally,CO2reduction is kinetically-limited, requiring a large activation energy
to engage the stable CO2 molecule, necessitating a substantial overpotential to drive the reaction
at reasonable rates. Achieving higher selectivity and energy efficiency motivates efforts into
catalyst design, such as nanostructuring and incorporating supporting materials.34 Nanoparticles
offer many advantages over bulk polycrystalline materials due to higher surface area to volume
ratios and a greater fraction of edge, step, and terrace sites,66 but often aggregate without a
supporting material. The support serves to maximize the electrochemically active catalyst area by
positioning the precious metal to simultaneously contact the electrolyte ionically and the electrode
electronically.
Recently, nanostructured Au catalysts have demonstrated great potential as indicated by favorable
results in literature. Many studies have been conducted that vary Au nanoparticle size, structure,
and shape to maximize CO faradaic efficiencies.66
,6 8,84,85 Sun and co-workers reported that 8 nm diameter Au nanoparticles were superior to larger or smaller particles, exhibiting faradaic
efficiency of 90% at -0.67 V (vs. RHE). This result was justified by the presence of an optimum
number of edge sites, which the authors cite as the most active facet for CO formation.8 6 This
motivated follow-up work on the fabrication of ultrathin Au nanowires (2 nm diameter) with
predominantly edge sites that achieved a Faradaic efficiency of 94% for CO formation at -0.35 V
(vs. RHE) and mass activity of 1.84 A g-' for a prolonged period of time (6 hours) without any
change in activity.6 6 To explain the high affinity for CO formation, Cave et al. recently suggested
a mechanism wherein Au does not favor C-O bond cleavage. High detection capabilities revealed
trace amounts of methanol (C-O bond intact) but no methane, supporting their argument.67 Cao et
al. explored surface functionalization of Au nanoparticles and increased the faradaic efficiency of