Working Paper #19
November, 2018
How many Migrants does the
Swiss Pension System Need?
Alice Milivinti
(University of Geneva)
How many Migrants does the
Swiss Pension System Need?
The National Centres of Competence in Research (NCCR) are a research instrument of the Swiss National Science Foundation
The nccr – on the move is the National Center of Competence in Research (NCCR) for migration and mobility studies, which has been operational since 2014. The overall goal of the nccr – on the move is to understand the character of and the experienced shifts in contemporary migration and mobility to Switzerland and beyond. It was established by the Swiss National Science Foundation with the objective of fostering an innovative and competitive field of research on migration and mobility in Switzerland.
Managed from the University of Neuchatel, the network comprises fourteen research teams from eleven Swiss Higher Education Institutions: The Universities of Basel, Bern, Geneva, Lausanne, Lucerne, Neuchatel, and Zurich, as well as ETH Zurich, the Graduate Institute Geneva,and the Universities of Applied Sciences and Arts of Western Switzerland (HES-SO) and Northwestern Switzerland (FHNW). Some 70 researchers and administrative collaborators work at the nccr – on the move.
The Working Papers Series is an online platform for academic debates by members and cooperating partners of the nccr – on the move. The authors are responsible for the analyses and arguments, which do not necessarily reflect those of the nccr – on the move.
nccr – on the move, University of Neuchatel, Rue Abram-Louis-Breguet 2, 2000 Neuchâtel, Switzerland Contact for the Working Paper Series: [email protected]
Abstract
The positive role exerted by migrants to decelerate the ageing population process of devel-oped countries has been stressed by many studies. However, the actual number of migrants needed to sustain the pension systems and its effectiveness in the long-run often remains tacit. While assuming the increment of the retired population to be the only shock, this study un-dertakes an accounting exercise of the Swiss public pension scheme. A ceteris-paribus analysis articulates the alternative compensatory actions, such as the increase in public expenditure, workforce through migration, retirement age, GDP and productivity, required to face the ag-gravating situation of the first pillar of the Swiss pension system (AHV/AVS) between 2014 and 2045. By taking advantage of the federal structure of Switzerland, the repercussions of specific compensatory actions adopted at the national level are evaluated for each canton. In general, even though a policy mix is the most desirable, immigration could by no means be a self-sufficient solution. In fact, if immigration would be the only compensatory action to main-tain the AHV/AVS at its 2014 level, the Swiss foreign population should increase, by 2045, of an extra 110% after having controlled for evolution of migration flows and stocks.
Keywords
International Migration; Pension System.
Acknowledgments
I would like to thank Prof. Philippe Wanner, Prof. Tobias Müller, Prof. Jean-Michel Bonvin, Dr Marco Pecoraro and Dr Thomas Spoorenberg for their comments.
Contacts
Institute for Demography and Socioeconomics (IDESO), Geneva School of Social Sciences Uni-versity of Geneva, 40, Bd du Pont d’Arve, 1211 Genève 4.
Contents
1 Introduction 5
2 Data 6
3 Summary Statistics 6
4 Forecasts 8
4.1 Immigration and Foreign Population Forecasts 9
4.2 Population Forecasts . 13
5 The Swiss Pension System 15
6 The Future Situation: a Base Case Scenario 15
7 Model 16
7.1 The Initial Situation in 2014 . 17
7.2 The Evolution up to 2045 . 18
8 Conclusions 26
Introduction
One of the most popular debated remedies to face the rise of an ageing population is immi-gration (see among others Sinn (1997); Razin and Sadka (1998); Han (2013)). The support of fresh workforce is claimed to bear the burden of a pension system collapsing under the pressure of longer life expectancies, lower fertility rates and the forthcoming retirement of the baby boomers. Migrants can benefit the age structure of the population by increasing the share of labour force and by supporting the dependency ratio. Nevertheless, some studies have already pointed out how immigration might not be a panacea for solving the problems of the weakening pension systems (Munz and Werding, 2005; Serrano, Eguía, and Ferreiro, 2011; UN Population Devision, 2000). In fact, the inflow of foreign workforce is just one among others solutions and not necessary the easiest one, also due to the social costs it brings, such as integration. The current research, while giving particular relevance to study the role of immigration, tries to shed light on alternative compensatory actions available to policy makers to prevent the pos-sible collapse of the Swiss retirement system. Among the three pillars constituting the Swiss
pension system, where the 1st is the federal pension scheme, the 2nd is the pension funds run by
investment foundations, voluntary joint by employers, and the 3rd includes private investments,
I exclusively focus on the 1st pillar (Alters- und Hinterlassenenversicherung (AHV) in German,
Assurance vieillesse et survivants (AVS) in French and Assicurazione vecchiaia, superstiti e
invalidità (AVS) in Italian), which is a pay-as-you-go system (PAYG)1 subscribed by all people
working and/or living in Switzerland.
Switzerland was born as a Confederation of cantons under the principle to give to the federal state the minimum of powers necessary to survive as a union. Throughout history Switzerland became a federal semi-direct democratic state, with a large decentralization across its admin-istrative units, the cantons. In addition to their powers cantons encase cultural, linguistic and religious, differences which reflect historical stratifications. Such regional peculiarities are mir-rored in many areas of the political debate and they can create internal tensions when they generate contrasting positions over topics decided at the federal level. Given that one of the few federal responsibilities is the AHV/AVS, it is interesting to shift the prospective of the analysis to a cantonal level. Such approach will display a cantonal AHV/AVS balance just in the prospective of evaluating how alternative central actions could differently affect each can-ton. In fact, to outline the different demographic issues each canton is facing will be important to take equitable federal decisions.
Starting from the model of Gil-Alonso (2012), the current study investigates the evolution of the Swiss pension system, between 2014-2045, for the 26 cantons. A ceteris paribus analysis, where changes are considered one at time, is developed in order to understand which policies would keep the balance as in the base year 2014. After having produced specific immigration and population forecasts (Milivinti and Benini, 2017), the deficit in workforce results to be unbridgeable if either immigration, the augmentation of the retirement age or the rise of the employment rate are considered separately. Feasible alternatives require a mix of them com-bined with an increase of the public expenditure, at the expenses of a larger public deficit, and the achievement of a target GDP growth.
The paper is mainly organised in two parts. The first photographs the Swiss demographic situation, looking closely at the foreign population and it produces migration and population forecasts. The second part, built on the first, introduces the model used to describe the pen-sion system and to develop the ceteris paribus analysis, investigating how cantons might be differently affected by alternative measures.
Data
This study takes advantage of a newly released dataset, which has the merit of having linked, for the first time, a collection of administrative records and surveys stemming from the Swiss Federal Statistical Office (SFSO) and the Secretariat for Migration (SEM) (Steiner and Wanner,
2015)2. The data harmonization is based on the linkage between the register of foreigners (ZAR
1998-2010) and the matched population registers (STATPOP 2010-2016). The explanatory po-tential of these data, which mainly contain demographic information, has been enriched by the contribution of other databases: the old age and survivors’ insurance (AHV/AVS 1998-2014) contributions (Register of Individual Accounts (CI)) and benefits (Annuities Register (RR)), the unemployment insurance payments (ASAL/PLASTA 1998-2014) and structural surveys (SE/RS 2010-2014). In addition, other data source employed by this investigation are the Swiss Labour Force Survey, ESPOP, Swiss Federal Statistical Office (SFSO) population fore-casts (Swiss Federal Statistical Office, 2015b) and the SFSO cross-border workers statistics (Swiss Federal Statistical Office, 2017). Finally, for the implementation of the second part of the research, the ceteris paribus analysis, the study also relies on the OECD long-term projec-tions of public pension expenditure (OECD, 2015) and the OECD regional economic statistics (OECD, 2017).
The reliance on the Swiss data released by the SFSO conditions the definition of foreign popu-lation and immigration that it is used in the rest of the article. I refer to foreign popupopu-lation as people of non-Swiss nationality residing in Switzerland, which would also include people born in Switzerland form non-Swiss parents who have not been naturalized. Instead, I indicate as "immigrants", people of non-Swiss nationality entering Switzerland. In other words, the foreign population is migration stocks and immigrants and migration flows.
Summary Statistics
Foreign population in Switzerland has mainly experienced a positive trend both in absolute and in relative terms in the past 45 years, see Figure 1-2. Its minimum share of was reached in 1979 when it amounted to 14.35% of the total population and the maximum in 2016 with almost 25%. Due to their age structure (Figure 4) foreigners not only contribute to the overall increase of the Swiss population, but also to the workforce (Figure 2) helping to support the old dependency ratio (Figure 3). In fact, despite the increase in the average foreigners’ age (Figure 5), the natives’ population remains older. The observed rise in the mean age is also due to the fact that recent migration flows are more educated than the old ones. Figure 6 represents the share of foreigners by skill level with respect to the total population. A sharp acceleration in the share of highly skilled migrants has been observed since the mid-90s, which made such category larger than the middle skilled migrants in 1998 and than the low skilled migrants in 2004.
A closer look to the cantonal level shows no significance relation between cantonal rates of for-eigners and mean age. For example, Figure 7 depicts a non significant negative linear relation observed between the share of resident foreign population (permanent and non permanent) and the average age in each canton in the year 2014. Considering their proportion of foreigners, Geneva (GE) and Basel-Stadt (BS) are the two cantons with the highest average age with re-spect to the share of foreigners, which might suggest the presence of a skilled foreign population
2The data have been elaborated by the project "Mapping the Demographics of the New Forms of Mobility and
Measuring their Socio-economic Impact" within the National Center of Competence in Research nccr - on the move financed by the Swiss National Science Foundation.
0.00 0.05 0.10 0.15 0.20 0.25 1971 1972 1973 1974 1975 1976 1977 1978 1979 1980 1981 1982 1983 1984 1985 1986 1987 1988 1989 1990 1991 1992 1993 1994 1995 1996 1997 1998 1999 2000 2001 2002 2003 2004 2005 2006 2007 2008 2009 2010 2011 2012 2013 2014 2015 2016 Year Share of F oreigner Population
Figure1: Share of migrant population from 1971 to 2016. Sources: ESPOP and STATPOP.
0.00 2.00 4.00 1971 1972 1973 1974 1975 1976 1977 1978 1979 1980 1981 1982 1983 1984 1985 1986 1987 1988 1989 1990 1991 1992 1993 1994 1995 1996 1997 1998 1999 2000 2001 2002 2003 2004 2005 2006 2007 2008 2009 2010 2011 2012 2013 2014 2015 2016 Year Population in millions
Figure2: Population between 15 and 65 years old from 1971 to 2016 by nationality. The Swiss Population is in red while the foreigner in blue. Sources: ESPOP and STATPOP.
10 15 20 25 30 1970 1980 1990 2000 2010 Year Old Dependenc y Ratio
Nationality Foreigner Swiss Total
Figure3: Dynamics of the old dependency ratio for natives (dotted line), foreigners (bold line) and the total (dashed line). Sources: ZAR and STATPOP. 0.00 0.01 0.02 0 50 100 Age Age Density 2000 2005 2010 Year
Figure4: Foreigners’ age distribution from 1998 to 2014. Sources: ESPOP and STATPOP.
32.5 35.0 37.5 40.0 42.5 2000 2005 2010 Year A v erage Age
Nationality Foreigner Swiss
Figure5: Evolution from 1998 to 2014 of the population average age for natives (dotted line)
and foreigners (bold line). Sources: SE/RS,
ZAR, STATPOP. 0.1 0.2 0.3 0.4 1990 2000 2010 Year of Arrival Share of Population
Education Level Primary Secondary Tertiary
Figure6: Foreign workforce composition (15-65 years old) by education levels between 1995 and 2014. Source: SE/RS.
● ● ● ● ● ● ● ● ● ● ● ● ● ● ● ● ● ● ● ● ● ● ● ● ● ● ● AG AR AI BL BS BE FR GE GL GR JU LU NE NW OW SH SZ SO SG Switzerland TG TI UR VS VD ZG ZH 0.2 0.3 0.4 0.5 39 40 41 42 43 44 Average Age Share of F oreigner Population
Figure7: Linear relation between the presence of foreign resident population (permanent, non permanent) and the average age in the different cantons in 2014. Sources: ESPOP, STATPOP.
who is older due the years of education accomplished. On the other hand, "younger" cantons with lower rates of foreigners are Lucerne (LU), Appenzell Inn. (AI), just to mention, but a few.
Historical data photograph a situation where migration stocks remain an important source of workforce, but they are ageing at almost the same pace as natives. Such shift seems to be caused by a positive skill selection. Therefore, if on the one hand, the more recent migrants have a less beneficial age structure to support the dependency ratios, on the other they seems to have an education level which can boost the Gross Domestic Product (GDP) and productivity compensating the ageing by the economic growth.
Forecasts
The computation of the evolution of the pension system requires a prior stage: the popula-tion forecasts. For the purposes of the analysis I treat the forecasts of the Swiss napopula-tionals and foreigners separately. I exclusively focus on the latter, whose evolution is more unstable due to effects of migration flows, while for Swiss nationals the projections of the SFSO are
left untouched3. The difficulties in forecasting migration flows lies on their sensibility towards
hard predictable shocks, such as business cycles, wars, etc. For this reason, ad hoc immigra-tion forecasts are elaborated hereafter by relying on the results of the comparative study on immigration forecast methods by Milivinti and Benini (2017). The outcomes of the migration flows forecasts are then used to compute the stock of future foreign population using the co-hort component method. In a second step, the predictions for the whole Swiss population are obtained by summing my predictions of the foreign population stocks to the SFSO projections of the native population ones.
3This choice makes this study relying on the assumptions on Swiss nationals emigration and immigration made
by the Swiss Federal Statistical Office. A closer look to the in- and out- migration of Swiss citizens in the past years shows a pretty steady series with approximately 28,000 people leaving and 26,000 re-entering the country.
8.0 9.0 data −0.4 0.0 seasonal 8.6 9.0 trend −0.5 0.5 1980 1985 1990 1995 2000 2005 2010 2015 remainder time
Figure8: Immigrant Flows Decomposition. From the top to the bottom, the plots show: ob-served data, global trend, seasonal trend and random noise.
Immigration and Foreign Population Forecasts Immigration Flows
Among the different predictors of the population change the most challenging to forecast, due to its instability and high degree of randomness, is the number of immigrants. The prediction exercise of the immigration time series is undertaken following Milivinti and Benini (2017). The latter compares different models to find the best predictive one within a Bayesian approach.
The starting point is to simple decompose the logarithm of the number of monthly arrivals (yt)
into a time and a seasonal trend,
yt= trendt+ seasonalityt+ et. (1)
where, seasonalityt s decomposed into a Fourier decomposition of order 2.
A visual inspection of the decomposition, Figure 8, confirms the presence of a seasonal pat-tern in the population inflows. The decision to treat immigration as a seasonal phenomenon, rather than an annual, will be an essential choice to improve the prediction accuracy. Such leap forward is achieved through the introduction of an interaction between global trend and sea-sonality in the simple model of trend-seasonal decomposition. Hence, an efficient way to model seasonal cycles, whose amplitude depends upon the global trend, is translated into mainly three alternatives, which progressively relax any restrictive functional form’s assumptions. In such setting a semi-parametric additive and a non-parametric specification are compared along-side with a linear one to model the trend-seasonal interactions. The results have shown the semi-parametric formulation to out-perform the alternatives both for shorter and longer time horizons. According to the authors’ advices the additive model with a semi-parametric global trend is preferable for short-term forecasts, while the additive model with linear trend is able to guarantee stability even in long-run forecasts. Thus, the latter is employed here and it will take the following form:
yt= β0+ β1trendt+ 2 ∑ i=1 f2i(cosit+ sinit) + 2 ∑ i=1
8 9 10 11 2000 2010 2020 2030 2040 Year log(Immigration)
Figure9: Semiparametric additive model results for the aggregate immigration forecasts be-tween 2015-2045 with 95% prediction credible interval from the posterior predictive distribution. The values of immigration on the vertical axis are in logarithms.
where seasonalitytis simply re-defined as the sum of two trigonometric functions and a monthly
specific effect which is further interacted with the global trend. The flexibility of the additive model is fully exploit within a Bayesian approach to forecast the future of Swiss migration. I adopt here the same prior used by Milivinti and Benini (2017) for the middle scenario predictions
with the smooth functions computed on three knots: β0 ∼ N(9; 0.5), β1 ∼ N(1; 0.1), σϵ, σθ, σ˜δ∼
HN (0; 2), where σθ and σδ˜ are specific standard deviations of the parameters of the penalized
likelihood built to compute the thin plate regression splines4.
The forecasts obtained stand for the whole amount immigration flows. They have been
per-formed at the aggregate level, e.i. for all ages, to guarantee more stable predictions5. In fact,
because of the stability of the foreigners’ newcomers the age distribution across years (see also Figure 4), once the results in Figure 10 are computed, I disaggregate them by simply multiply-ing the total foreign population by the age distribution.
Immigration Stocks
For developing the consecutive steps of the analysis it is necessary to convert them into migra-tion stocks:
Stockage,t = Stockage,t−1∗ %Stayage,t+ Inf lowsage,t+ Birthst− Deathsage,t,
where Stockage,t−1is the foreign resident population at time t−1 for a specific age age, %Stayage,t
is the stay rate, Inf lowsage,t is the amount of new incomers resulting from the predictions of
model (2), Birthst is obtained by multiplying the foreign population reproduction rate by the
total Stockt−1 and Deathsage,t results from multiplying the death rate by Stockage,t−1. Please
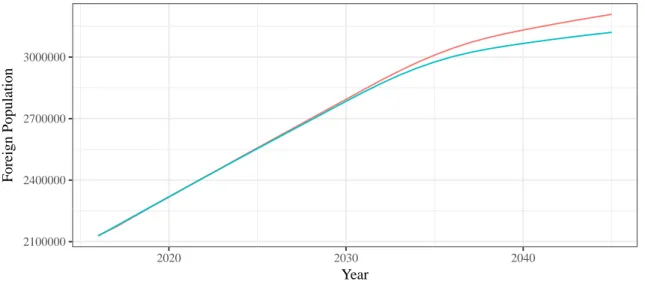
notice that the naturalized population is still accounted for in the foreigner population. Since the current analysis focuses on the impact of migration on the AHV/AVS and the effects of the naturalized population would still fall into the one of the migrant population. The reproduction rate and the death rate for the period 2015-2045 are drawn from the SFSO forecasts. On the other hand, I did specific forecasts for the stay rate using an AIRMA models. The final results include the whole stock of foreign population residing in Switzerland until 2045, also taking into account the migrants’ ageing. Figure 10 shows a comparison between the results of my foreign population forecasts for the middle scenario priors and the ones of the reference scenario of the SFSO. The two display almost the same values until 2030 while the divergence to 2045 is due by the higher predictions of the semiparametric model. Moreover, in Figure 11 I also compare
4For details see Milivinti and Benini (2017)
2100000 2400000 2700000 3000000 2020 2030 2040 Year F oreign Population
Semiparametric Predictions SFSO Reference Scenario
Figure10: Comparison between the SFSO foreign population forecasts reference scenario and the predictions elaborated from the semiparametric model between 2015-2045.
the age distribution of the foreign population between the two in 2045. While no important divergences can be found, which is probably due to the reliance of both forecasts on similar assumptions about mortality and fertility, my forecasts are slightly more optimistic than the ones of the SFSO, which forecast about 20 thousands less people between 0-14 years old and 20 thousands more between 65-100.
Figure 12 and 13 compares the foreign and native active population from 1980 to 2050 assuming the retirement to be fixed to 65, where the foreigners’ forecasts are obtained with the current computations, while the natives’ ones are drawn from the SFSO .
Results highlight that if in absolute terms the foreigner active population will continue to increase until 2045 (Figure 12), in relative terms such an increment is less remarkable and it seems to approach to a steady state by 2025 (Figure 4.13). Said differently, by 2025 the share of foreigner active population will not augment any more, but stay constant around the 80% of the total foreign population.
Another useful distinction for the next stages of this study is the population disaggregation into the twenty-six Swiss cantons. The first step in this direction is to consider the possibility to proceed in the same way as for the age categories, i.e. to obtain the disaggregated values by simply multiplying the aggregate forecasts by the foreigners’ distribution across cantons.
Figure 14 shows how the cantonal shares of foreign population6, while less constant than the
age distribution, still produce a distinct and regular pattern with Zürich having the largest share of foreigners, as well as variation (min. 0.15 max. 0.23), and Vaud being the second except for the period 1995-2002, in which it was surpassed by Geneva. Being the shares of all the other cantons far below, their variation appears less problematic from the absolute point of view of the disaggregation, even though potentially relevant in relative terms.
In light of such considerations, and after having also performed a disaggregate forecast for the single cantons, still the best approach in terms of mean square errors, is to multiply the total
6The cantonal shares in Figure 14 are the number of cantonal foreign population with respect to the whole
0 200 400 600 0−14 15−19 20−24 25−29 30−34 35−39 40−44 45−49 50−54 55−59 60−64 65−100 Age Catogory Population thousands
Scenario Mine reference
Figure11: Comparison of the age distribution of foreign population stocks between the SFSO foreign population forecasts reference scenario and the predictions elaborated from the semi-parametric model in 2045. 1 2 3 4 1980 2000 2020 2040 Year Activ e Population in mln
Nationality Foreigner Swiss
Figure12: Forecasts of the foreigner vs native active population (15-65 years old) until 2045, where the black solid line denotes the foreigners and the dotted the Swiss.
0.65 0.70 0.75 1980 2000 2020 2040 Year Share of Activ e Population
Nationality Foreigner Swiss
Figure13: Forecasts of the foreigner vs native shares of active population (15-65 years old) within each category until 2045 where the solid line denotes the foreigners and the dotted the Swiss.
OW OW NW NW LU LU SZ SZ UR UR ZG ZG JU JU NE NE SO SO FR FR BE BE BS BS BL BL AG AG SH SH SG SG GR GR GL GL TG TG AR AR AI AI GE GE VD VD VS VS TI TI ZH ZH
Northwestern Switzerland Zurich & Ticino
Espace Mittelland Lake Geneva
Central Switzerland Eastern Switzerland
1980 1990 2000 2010 1980 1990 2000 2010 0.00 0.05 0.10 0.15 0.20 0.00 0.05 0.10 0.15 0.20 0.00 0.05 0.10 0.15 0.20 Year Share of Immigrants
Figure14: Evolution of the cantonal foreign population as a percentage of the whole Swiss foreign population between 1981 and 2045. Sources: ZAR and STATPOP.
population by the regional distributions7. The cantonal foreign population forecasts obtained
will be used in the next step of the analysis. Population Forecasts
The second category of forecasts needed concerns the cantonal total population. The evolution of the whole population depends upon different components, such as the survived population, the births and the net migration. Among those three the first two are the easiest to forecast since they hardly show trend inversion, while the latter is the most unstable and difficult to predict. Hence, in order to have the most possible accurate population predictions I will sum to the reference scenario calculated by Swiss Federal Statistical Office (2015b) for the native population, which also takes into account the migration flows of Swiss citizens, the forecasts for the stock of foreigners elaborated in the previous subsection, which shows a steady and gradual increase with some slowdowns, but no trend inversions. Swiss Federal Statistical Office (2015a) reports all the hypothesis on which the SFSO bases its population projections are available. No additional assumptions or modifications are made by the author with regard to internal migration, or migration of Swiss nationals.
7Further evidence in support of this decision has been confirmed by checking the Akike Information Criterion,
for different specifications of ARIMA models. The best model for all regions ends out to be a random walk, except for Zug and Nidwalden for which an AR(1) is preferable.
OW OW NW NW LU LU SZ SZ UR UR ZG ZG JU JU NE NE SO SO FR FR BE BE BSBL BSBL AG AG SH SH SG SG GR GR GL GL TG TG AR AR AI AI GE GE VD VD VS VS TI TI ZH ZH
Northwestern Switzerland Zurich & Ticino
Espace Mittelland Lake Geneva
Central Switzerland Eastern Switzerland
1980 2000 2020 2040 1980 2000 2020 2040 0 500000 1000000 1500000 0 500000 1000000 1500000 0 500000 1000000 1500000 Year Population
Figure15: Evolution of the total population by canton between 1981 to 2045. Source: "2015-2045 scenarios concerning the cantonal permanent population", Swiss Federal Statistical Office, ZAR and STATPOP.
The Swiss Pension System
The Swiss AHV/AVS is a PAYG system pensions, which simply transfers the active popula-tion’s contributions to the retired. It can be watched as an equilibrium where: Pension Benefits = Contributions. As a conventional benefit system, the AHV/AVS fixes the pension amounts based on the average earnings and the number of contribution years. The pensions, as well as the corresponding entitlements, are subject to an hybrid indexation system, which is an equal
combination of price and nominal wage growth (Mischindex8).
The AHV/AVS is highly re-distributional since the maximum pension equates to twice the min-imum pension, depending on individual contribution years. Moreover, differently from others pension schemes, the Swiss one is not exclusively linked to an active labour participation since every individual, irrespectively if employed or not, is covered and must pay a minimal yearly contribution of 478 Swiss francs. The contributions of the active labour force, instead, amounts to the 8.4 % on the actual income for employed workers (paid equally between the employer
and the employee)9.
According to (BSV, 2015), the AHV/AVS is primarily financed by contributions (71 %) and public subsidies (24 %). The latter primarily includes: a small buffer fund, which corrects for
short-term unbalances10, and public contributions11. Additionally to public subsidies connected
to pension, also subsidies from general tax revenue also play a significant role in financing the pension system. In the Swiss case, in fact, the 0.83 % of the value added tax (VAT) and a frac-tion of the revenues from state-owned casinos are used to finance the old-age pension system. However, the correct specification of their contribution on base year pension liabilities can be hard.
The Future Situation: a Base Case Scenario
How will the AHV/AVS balance sheet look like in 2045 if the population evolution will take the shape of the one elaborated in the previous sections? As a simplistic illustrative example I try to multiply the average pension in 2014 by the future retired population until 2045 also adjusting for the hybrid indexation system. According to the 2013 Swiss Parliamentary report (Bundesrat, 2013) about the overall view on the financing perspectives of social insurance until 2035, an annual labour productivity rate of 1 is assumed. By the same token, the active population forecasts are multiplied by the mean contribution, which also accounts for the productivity growth. According to my calculation shown in Figure 16 in 2014 the contributions of the active population covered the 75 % of the old age pension allowances. Those figures slightly differs form the ones of the BSV (2015), which reports the AHV/AVS to be primarily financed by contributions (71 %) and public subsidies (24 %). Some divergences might be due to different accounting of invalidity and other allowances. However, the graph shows the contributive capacity of the active population will be increasingly insufficient to sustain the pension system, which would need to be financed through other sources. However, the years until 2045-2050 are known to be the most problematic since they coincide with the retirement of the baby boomers. In fact, in 2045 the contributions capacity to cover the pension costs will
8M ischindex = (0.5× Wage Index + 0.5 × Consumer Price Index).
9For self-employed the percentage drops to 7.8%, however, for reasons of simplicity the 8.4% will be applied. 10The reserves of the Swiss buffer fund of the old-age pension system (AHV-Fonds) amounts to around 1.2 times
the annual expenditures.
30 40 50 60 70 2020 2030 2040 Year Allowances Contributions
Figure16: The blue line represents the pension allowances according to the population forecasts of section 4.2, while the red line the pension contributions in billionf of Swiss Francs (CHF) between 2014 and 2045.
be of the 55 %. Once that generation would pass away, the AHV/AVS expenses would decrease and slowly rematch the contributions. However, the question on how the AHV/AVS should balance its passives remains an open question. Among the different options, such as an increase of the retirement age, a change in the indexation, a cut of the pensions, etc. the main focus here is the potential role of migrants. While Figure 16 already takes into consideration the increase in net migration in the next years predicted by the model 2, this is far from enough.
Model
This section presents an adaptation of the paper by Gil-Alonso (2012) on which the current analysis is based. Following up form section 5, in the Swiss system the pension benefits are financed by the contributions of the employed population, by a small buffer fund, which corrects
for short-term unbalances12, and public contributions13.
Pension Benefits = Workers’ Contribution + Buffer Fund + Public Contributions. The total benefits corresponds to the number of retired people R multiplied by the average pension p. The increase of the pension benefits due to the indexation regime Mischindex would be disregarded. On the one hand, the inflation would be superfluous since the analysis is carried out in real terms. On the other, the part of the indexation relying on the wages’ growth, is first assumed to be zero and only adapted in the ceteris paribus analysis when the compensatory action of a productivity growth is considered. On the righten side of equation 3, the contributions of the active labour force (E) corresponds to a fraction, the contribution
rate (c), of the average income ¯y, which will be substituted by the GDP per employed in the
analysis, and a set of other contributions
A = Buffer Fund + Public Contributions. The equilibrium can be rewritten as:
R× p = E × ¯y × c + A, (3)
12The reserves of the Swiss buffer fund of the old-age pension system (AHV-Fonds) amounts to around 1.2 times
the annual expenditures.
From Figure 16 A approximately accounts for the 25 % of the pension benefits in 2014 (A =
0.25× (R × t × GDP /E). Since the focus is drawn on the role of the population evolution (R
and E) and not in the one of A, the rest of the study is focusing on the development of the
other model’s parameters necessary to maintain the 2014 level of funding, i.e. that E× ¯y × c
would equal the 75 % of the total contributions. Equation 3 can be rewritten as:
0.75× (R × t × GDP /E) = E × GDP /E × c, (4)
where, t is the "transfer ratio", that is the ratio between the average pension and income[t = py¯[.
The transfer ratio is unobserved, but it can be calculated by simplifying and re-arranging equation (4) to obtain:
t = E× c
0.75× R = 1.33× E/R × c. (5)
The elementary formulation of the accounting model presented overlooks at some components potentially affecting the balance sheet of the AHV/AVS by inevitably making some crucial as-sumptions. First, the Swiss pension formula, for which the maximum pension equates to twice the minimum pension depending upon individual contribution years, is constrained to a large degree of redistribution. However, the simplicity of the model, which implicitly assumes a con-stant wage distribution over time, overlooks the potential effects of the redistributive asset of the AHV/AVS. Second, since the accounting exercise is carried on as a ceteris paribus analysis, GDP and productivity growth are assumed to be unaffected by the other model’s parameters, such as the number of migrants or of retired. Third, since the analysis does not utilize wages, but average GDP per employed person to compute the contributions, I assume wages to be a fixed share of the GDP for the period under study.
According to the model, the sustainability of the pensions system is achieved when the total revenues equalize the expenditures, without widening relative role of A. The analysis looks at the evolution of the Swiss pension system from 2014 to 2045 and it considers what is needed in terms of contributors to keep the system at the status quo of 2014 in relative terms. In such model the only shock examined is the increase in the number of retirees. The investigation is developed by studying the change of one parameter at the time while keeping all others constant (ceteris paribus). Hence, in the first stage the only compensatory action is the employment increase, while in the second, a bunch of alternatives, such as the expansion of the contribution rate, GDP and transfer ratio are tested one at the time.
The Initial Situation in 2014
In this section the situation of the AHV/AVS in 2014 is illustrated for the 26 cantons and for Switzerland. Even though all the parameters are displayed at the cantonal level, the only purpose of such disaggregation is to depict how cantonal demographic differences would shape the costs and benefits caused by different federal actions, rather than the analysis of the cantonal balance per se. The model’s parameters, as well as other indicators, are displayed in Table 1. Column (1) and (3) show the indicators about the ageing population, which respectively represent the number of retired persons (R) and the old dependency ratio (ODR), i.e. number
of retired persons per 100 employed persons14. The canton with the lowest ODR is Geneva,
14Since according to the data about 10% of the people aged 65 and older, which is the official retirement age,
are employed, I did not consider all the population over 65 to be retired, but I included that 10% into the active one.
where there are 19.60 retired per 100 employed people, while the one with the highest is Bern
where the retired are 27.70. The federal average ODR is 23.9015. Column (2), (4) and (6) show
the data about the employment situation correspondingly denoting the number of employed persons (E) in Switzerland, including cross-borders, the employment rate (ER), i.e. the number of employed persons per 100 in their working age, and the residing working age population
(W AP15−65), i.e. the population between 15 and 65 years old. The discrepancies between ER
and the ratio between E and W AP15−65 is given both by the 10% of the old population who
is still at work, as well as the cross-border worker, which are considered in E, but not in the
active resident cantonal population W AP15−65. The canton with the highest employment rate
is Nidwalden with 79.30%, while the canton with the lowest is Ticino with 73.6%. The Swiss
ER amounts to 76.6%16. The parameter C indicates the amount of workers’ contributors used to finance the AHV/AVS. The calculations stem from the data OECD (2015), OECD (2017) and are simply obtained by multiplying the cantonal GDP by the contribution rate on pensions (8.4%). These numbers help to understand which cantons are beneficiaries and which cantons are contributors. For example, if we multiply the number of retired persons by the average pension benefit and we compare the result with C we observe that the first contributor is Zürich, followed by Geneva and the first beneficiary is Valais followed by Uri. Last but not
least, the transfer ratio t, relating the mean pension to the GDP per employed [t = GDP /Ep [,
surpass the Swiss average of 0.35 in the cantons of Lucerne, Zürich, Basel-Stadt, Aargau, Schwyz, Vaud, Thurgau, Zug, Fribourg and Geneva (0.43). Differently said, the cantons with
t> 0.35 are contributors while the cantons with t < 0.35 are beneficiaries in terms of transfers
to the AHV/AVS.
The Evolution up to 2045
Once the initial situation has been described (see subsection 7.1), the effects of an ageing pop-ulation until 2045 can be assessed. I will develop a ceteris paribus analysis where the different outputs reported in Tables 2 and 4 represent the compensatory changes in each of the param-eters necessary to maintain the system at the 2014 status quo.
The number of retired people reported in column (1) is determined by the results of the popula-tion forecast of secpopula-tion 4.2 assuming the retirement age to be fixed at 65 years old. The columns from (2) to (9) simply show the actions required, in terms of employment augmentation, to neutralize the increase in the retired population. Notice that both the number of retired people
(R), as well as the working age population (W AP15−65, ∆W AP70), already include the foreign
population forecast.
By keeping the retirement age at 65 years old, the Swiss retired population will jump from 1,318,971 to 2,463,643 people, which is an increase of 84.7%. By the same token the Swiss ODR will rise from 23.9 in 2014 to 43.30 in 2045. One way to keep the ODR at the same level as in 2014 is to increase the employment at the same pace as the retired population. Column (4) illustrates the values of the percentage annual increase in employed people maintaining the base year equilibrium. Results show that Switzerland should increase its employment by 1.4% yearly from 2015 to 2045. Similarly, the employment rate should rise to +142%. Therefore, despite the upsurge in the working age population (from 5,835,330 in 2014 to 6,743,326 in 2045),
15Above the Swiss ODR we find in order from the lowest to the highest Obwalden, Neuchâtel, Jura, Ticino,
Appenzell Inn., Nidwalden, Solothurn, Appenzell Aus., Schaffhausen, Glarus, Graubünden, Valais, Basel-Land., Uri and Bern.
16The cantons below the federal average ER are from the lowest to the highest: Fribourg, Uri, Basel-Land.,
Table1: Main parameters of the model in 2014 in the 26 Swiss cantons.
Canton R E ODR ER C W AP15−65 t
(1) (2) (3) (4) (5) (6) (7) Aargau 96, 612 426, 693 22.60 78.30 2, 292 453, 435 0.37 Appenzell Inn. 2, 578 10, 231 25.20 79.30 56 10, 601 0.33 Appenzell Aus. 9, 050 34, 751 26.00 78.10 176 36, 532 0.32 Bern 181, 093 653, 606 27.70 78.90 4, 428 669, 115 0.30 Basel-Land. 53, 112 194, 693 27.30 77.00 1, 108 202, 198 0.31 Basel-Stadt 34, 978 154, 343 22.70 76.10 1, 794 161, 934 0.37 Fribourg 40, 291 190, 827 21.10 77.60 1, 012 207, 640 0.40 Genève 70, 932 362, 317 19.60 74.60 2, 790 397, 523 0.43 Glarus 6, 735 25, 623 26.30 78.40 154 26, 812 0.32 Graubünden 34, 626 131, 860 26.30 78.20 800 136, 951 0.32 Jura 12, 802 51, 341 24.90 76.60 269 53, 998 0.34 Lucerne 59, 674 254, 347 23.50 78.50 1, 475 269, 079 0.36 Neuchâtel 29, 368 120, 557 24.40 76.60 856 128, 379 0.34 Nidwalden 7, 033 27, 671 25.40 79.30 169 28, 600 0.33 Obwalden 5, 656 23, 607 24.00 78.20 136 25, 027 0.35 St. Gallen 76, 763 323, 507 23.70 78.10 2, 070 343, 266 0.35 Schaffhausen 14, 458 55, 308 26.10 78.00 390 57, 222 0.32 Solothurn 44, 548 171, 721 25.90 78.50 994 179, 165 0.32 Schwyz 22, 604 99, 001 22.80 78.40 516 105, 355 0.37 Thurgau 38, 984 173, 806 22.40 78.30 915 185, 350 0.37 Ticino 67, 990 270, 740 25.10 73.60 1, 658 289, 581 0.33 Uri 6, 213 22, 475 27.60 77.20 106 23, 730 0.30 Vaud 111, 245 494, 638 22.50 76.30 2, 969 540, 277 0.37 Valais 55, 123 209, 814 26.30 76.70 999 224, 682 0.32 Zug 17, 500 77, 772 22.50 78.30 1, 035 82, 886 0.37 Zürich 219, 003 946, 311 23.10 78.70 7, 991 995, 994 0.36 Switzerland 1, 318, 971 5, 507, 558 23.90 77.60 37, 158 5, 835, 330 0.35
R: Number of Retired people.
E: Number of Employed people in Switzerland including permanent, non-permanent residents and cross-border workers. C: Amount of cantonal contributions to old age survivors’ pension in millions of US dollars, constant prices, constant PPP with
base year 2010.
t: Transfer ratio (t = E/R× c) needed to keep the model in equilibrium. ODR: Old Dependency Ratio.
ER: Average cantonal employment rate obtained by averaging the age-nationality specific employment rates W AP15−65: Resident Working Age Population, i.e. people between 15 and 65 years old.
the additional number of employed people would amount to 3.1 millions. Given the low birth rates, such fresh workforce is supposed to be supplied by migration flows.
From a cantonal prospective large differences are observed, with the lowest increase in old age population is observed for Basel-Stadt passing from 34,978 to 48,585 (+38.9%) and the largest for Schwyz going from 22,604 to 50,787 (+124.7%). Geneva has the lowest ODR with 27.2 retired people for 100 employed and Valais bares the heaviest burden with 52.5 retired people for 100 employed. Large internal disparities are also observed for the employment, ranging from 0.35% for Basel-Stadt to 2.19% for Schwyz and for the employment rate, which would experience the lowest predicted increment for Basel-Stadt and Geneva (+101-102%) and the highest for Obwalden (+194%).
T able2: Main parameters of the mo del in 2045 in the 26 Swiss can tons if the increase in emplo ymen t is the only comp ensatory actions. Can ton R O D R W AP 15 − 65 E ∗(% ) E R ∗(% ) ∆ E ∗ ∆ I mm ∗ ∆ F P ∗(% ) ∆ W AP 70 (1) (2) (3) (4) (5) (6) (7) (8) (9) Aargau 203 ,634 46 .30 524 ,920 1 .90 150 347 ,343 394 ,118 148 42 ,940 App enzell A us. 15 ,467 44 .10 35 ,994 1 .27 144 16 ,861 18 ,590 140 3 ,253 App enzell Inn. 4 ,434 43 .30 10 ,196 1 .33 151 5 ,161 5 ,735 145 948 Basel-Land. 82 ,886 40 .30 212 ,879 0 .83 125 59 ,971 67 ,838 69 17 ,184 Basel-Stadt 48 ,585 28 .90 184 ,659 0 .35 102 19 ,373 21 ,671 21 9 ,954 Bern 305 ,198 46 .40 690 ,927 1 .24 139 306 ,225 346 ,755 140 64 ,937 F rib ourg 89 ,384 46 .60 267 ,984 2 .15 138 178 ,666 206 ,403 165 18 ,691 Genèv e 126 ,494 27 .20 559 ,066 0 .63 101 99 ,826 112 ,492 36 25 ,399 Glarus 11 ,986 46 .80 26 ,942 1 .44 148 14 ,293 16 ,015 109 2 ,532 Graubünden 60 ,302 43 .40 135 ,061 1 .20 149 62 ,097 69 ,322 133 12 ,709 Jura 21 ,341 36 .80 59 ,699 0 .83 125 16 ,908 18 ,894 118 4 ,401 Lucerne 115 ,565 45 .10 299 ,363 1 .69 144 174 ,663 197 ,328 184 24 ,463 Neuc hâtel 46 ,258 35 .10 146 ,889 0 .75 113 34 ,494 38 ,973 57 9 ,542 Nidw alden 12 ,695 45 .60 25 ,127 1 .47 174 15 ,866 17 ,345 197 2 ,715 Ob w alden 12 ,325 51 .50 23 ,191 2 .06 194 21 ,085 23 ,067 317 2 ,598 Sc haffhausen 25 ,752 44 .40 63 ,623 1 .29 135 28 ,249 31 ,615 103 5 ,415 Sc h wyz 50 ,787 51 .10 110 ,214 2 .19 177 95 ,244 105 ,924 210 10 ,731 Soloth urn 80 ,750 45 .90 194 ,525 1 .42 140 96 ,475 109 ,405 126 17 ,083 St. Gallen 143 ,556 43 .10 369 ,965 1 .51 143 196 ,632 222 ,831 125 30 ,219 Th urgau 87 ,267 47 .80 219 ,585 2 .03 155 157 ,731 176 ,619 161 18 ,410 Ticino 126 ,462 38 .00 358 ,940 0 .91 123 107 ,602 117 ,611 78 25 ,026 Uri 11 ,084 49 .30 19 ,208 1 .45 183 12 ,605 14 ,087 206 2 ,303 V alais 111 ,677 52 .50 258 ,325 1 .82 144 159 ,104 179 ,335 145 23 ,067 V aud 216 ,385 41 .00 682 ,804 1 .52 123 313 ,985 356 ,942 89 44 ,465 Zug 34 ,873 44 .40 92 ,328 1 .78 147 57 ,084 65 ,281 128 7 ,356 Züric h 391 ,496 41 .00 1 ,170 ,913 1 .42 126 524 ,205 592 ,284 102 83 ,045 Switzerland 2 ,436 ,643 43 .30 6 ,743 ,326 1 .40 142 3 ,121 ,747 3 ,526 ,479 110 509 ,388 E ∗(% ): p ercen tage of ann ual increase in the emplo y ed p eople necessary to main tain the mo del as in the base y ear 2014. E R ∗: p ercen tage increase in the emplo ymen t rate necessary to main tain the mo del as in the base y ear 2014. ∆ E ∗: emplo y ed p eople necessary to main tain the mo del at the same equilibrium situation as in 2014 ma yb e through immigration. ∆ I mm ∗: Num b er of new immigran ts, necessary to main tain the mo del as in the base y ear 2014. ∆ F P ∗(% ): P ercen tage increase in foreign p opulation necessary to main tain the mo del as in the base y ear 2014. W AP 70 : W orkforce a v ailable if the retiremen t age is p ostp oned to 70 y ears old.
Column (7) reports the values of new total immigrant population necessary to provide the ∆E∗ of column (6) while keeping the foreign population employment rates fixed at the 2014 values.
The difference between ∆E∗ and ∆Imm∗is given by the inactive migrants. As previously said,
∆Imm∗ represents an additional immigration to the one already forecast by the
semiparamet-ric model in subsection 4.1.
To have a more direct interpretation of such values, Column (8) translates ∆Imm∗ into
per-centages. For Switzerland it would mean to increase its foreign population by +110% with the lowest increase necessary for Basel-Stadt (+21%) and Geneva (+36%) and the largest by Obwalden (+317%) far followed by Schwyz (+ 210%).
Finally, the increase of the retirement age is another option to widen the employed population. In column (9) I report the number of people that would become part of the active population, and would therefore exit from the retired one, if the retirement age would be risen to age 70. Table 3 reports the adjustments in the model’s parameters in that case. Such solution would be enough to fill the required workforce almost only for Basel-Stadt, but it will lower the need for foreign population to the 80% at the federal level.
Despite the magnitude of those numbers, it is important to remind that the current ceteris
paribus analysis is assuming that the employment variation is the only measure taken to
bal-ance the system, while all other parameters (for example the GDP, the productivity, public expenditure, etc.) are kept constant at their 2014 level. In fact, the figures given here represent a sort of worst case scenario since we could expect, for example, a positive GDP and pro-ductivity trend, which might even be fostered by immigration. According to (Liebig and Mo, 2013), which has studied the impact of the cumulative migration waves arrived over the past 50 years in OECD countries, suggests that migrations’ impact on the GDP is on average close to zero, rarely exceeding 0.5% in positive or negative terms with the exception of Switzerland and Luxembourg, where immigrants provide an estimated net benefit of about 2% of GDP. The evolution from 2014 to 2045 of the results just discussed is portrayed in Figure 17, which
shows the trend of the active population (AP) and the number of employed people (E∗) to keep
the equilibrium. The blue shaded area illustrates the deficit in workforce the system will face. Notice that I included in the active population also a 10% of people who have already achieved the retiring age of 65, but are still employed, as well as the predicted cross-borders. According to the results, the labour market will be self-sufficient until the 2020, while from 2021 on it will need to be filled with new workforce, i.e. immigration.
T able3: Main parameters of the mo del in 2045 in the 26 Swiss can tons if the retiremen t age is 70 y ears. Can ton R O D R W AP 70 E ∗(% ) E R ∗(% ) ∆ E ∗ ∆ I mm ∗ ∆ F P ∗(% ) (1) (2) (3) (4) (5) (6) (7) (8) Aargau 160 ,694 36 .60 524 ,920 1 .60 135 270 ,116 306 ,491 115 App enzell Inn. 3 ,486 34 .10 10 ,196 1 .00 136 3 ,599 3 ,999 101 App enzell A us. 12 ,214 34 .80 35 ,994 0 .90 130 11 ,794 13 ,003 98 Bern 240 ,261 36 .50 690 ,927 0 .90 126 209 ,543 237 ,277 96 Basel-Land. 65 ,702 31 .90 212 ,879 0 .50 113 34 ,959 39 ,545 40 Basel-Stadt 38 ,631 23 .00 184 ,659 0 .00 92 2 ,248 2 ,515 2 F rib ourg 70 ,693 36 .90 267 ,984 1 .80 125 143 ,059 165 ,268 132 Genèv e 101 ,095 21 .70 559 ,066 0 .30 92 50 ,855 57 ,307 18 Glarus 9 ,454 36 .90 26 ,942 1 .10 134 10 ,360 11 ,608 79 Graubünden 47 ,593 34 .30 135 ,061 0 .90 134 42 ,404 47 ,338 91 Jura 16 ,940 29 .20 59 ,699 0 .50 114 9 ,957 11 ,126 69 Lucerne 91 ,102 35 .50 299 ,363 1 .30 130 131 ,966 149 ,090 139 Neuc hâtel 36 ,716 27 .90 146 ,889 0 .40 103 19 ,060 21 ,535 32 Nidw alden 9 ,980 35 .80 25 ,127 1 .10 156 11 ,427 12 ,492 142 Ob w alden 9 ,727 40 .60 23 ,191 1 .70 175 16 ,671 18 ,239 251 St. Gallen 113 ,337 34 .10 369 ,965 1 .20 129 144 ,903 164 ,209 92 Sc haffhausen 20 ,337 35 .10 63 ,623 1 .00 122 19 ,848 22 ,213 72 Soloth urn 63 ,667 36 .20 194 ,525 1 .10 126 69 ,534 78 ,853 90 Sc h wyz 40 ,056 40 .30 110 ,214 1 .80 159 76 ,048 84 ,576 168 Th urgau 68 ,857 37 .70 219 ,585 1 .70 140 124 ,286 139 ,169 127 Ticino 101 ,436 30 .50 358 ,940 0 .60 113 70 ,895 77 ,490 52 Uri 8 ,781 39 .10 19 ,208 1 .10 165 9 ,286 10 ,378 152 V aud 171 ,920 32 .60 682 ,804 1 .20 112 236 ,543 268 ,905 67 V alais 88 ,610 41 .60 258 ,325 1 .50 131 124 ,438 140 ,262 113 Zug 27 ,517 35 .00 92 ,328 1 .40 132 43 ,766 50 ,051 98 Züric h 308 ,451 32 .30 1 ,170 ,913 1 .10 114 376 ,824 425 ,763 74 Switzerland 1 ,927 ,257 34 .20 6 ,743 ,326 1 .10 128 2 ,264 ,390 2 ,558 ,703 80
6 7 8 9 10 2020 2030 2040 Year
Number of people in millions
Legend
E* AP
Figure17: The blue line represents the change in the active population (AP), according to the population forecasts of section 4.2, while the red line the number of employed people (E*) maintaining the model in equilibrium between 2014 and 2045. The blue shaded area represents the number of workforce needed to keep the system as in its base year.
Nevertheless, the increment of the employment is not the unique solution and, as just seen, it is not enough as a remedy per se. Hence, Table 4 shows alternative compensatory actions. Column (1) and (2) consider the changes in the contribution rate and in percentage points under the assumption of a steady GDP per employed person. For the aggregate Swiss context the percentage of contribution rate to the pensions should rise from 8.4% in 2014 to 13.9% in 2045. However, if a contribution rate of approximately 14% would be imposed to all the cantons, the most penalized ones will be Basel-Stadt, Neuchâtel, Basel-Land, Bern and Jura, which report percentage adjustments below 12.7%. On the other hand, Valais, Aargau, Thurgau, Obwalden, Fribourg and Schwyz would benefit the most since all of them would have had to increase their contribution rates to more than the 15.3%.
The average federal transfer ratio will lower from 0.35 to 0.21, which means that the 2014
value should be multiplied by 0.6 (column(4)). Instead, to keep t2045 = t2014 the average
pension should decrease by 37% (column(5)) in relation to the GDP per employed person. Said differently, an increase in GDP of 68.1%, which is 1.69% a year, is needed to keep the current level of pension rents. In terms of percentage growth such result sounds ambitious, but far from being too unrealistic, since the Swiss GDP grew at a rate of 1.75% between 2000 and 2017 despite the 2008-09 recessions and the OECD long term GDP growth forecast OECD (2018) foresees an average yearly increase of almost the 2% for Switzerland from 2015 to 2045. All other things constant, if such an expansion will actually take place, it should be self-sufficient to cover the rising costs of the old age insurance with no need of a further increase of the workforce beyond the natural migration increment already predicted by the semiparametric model. In line with my calculations, between 2015 and 2045, the average value in term of GDP
of one additional employed person is 153 thousands USD17, whereas the corresponding value
of one additional migrant is of 135 thousands USD. This means that, keeping all other things constant, in case Switzerland would accomplish an hypothetical +1% annual GDP growth, the
workforce and migrant population should respectively adjust to around ∆E∗ = 1.6 mln. and
∆Imm∗= 1.8 mln. to balance the system.
Clearly, the compensatory actions just described have to be viewed as extreme cases, since the measures undertaken to preserve the pension system are likely to be a mix of adjustments of the different parameters. However, even if a policy mix is desirable, I would like to draw the
Table4: Main parameters of the model in 2045 in the 26 Swiss cantons for alternative compen-satory actions. Canton c∗(%) cc∗(%) t∗ ct ∆p(%) ∆GDP (%) ∆GDP y(%) (1) (2) (3) (4) (5) (6) (7) Aargau 15.90 7.50 0.20 0.53 −47.30 107.10 2.38 Appenzell Aus. 12.80 4.40 0.21 0.66 −35.00 62.10 1.57 Appenzell Inn. 12.90 4.50 0.22 0.65 −35.40 63.30 1.59 Basel-Land. 11.90 3.50 0.22 0.71 −28.80 46.10 1.23 Basel-Stadt 10.50 2.10 0.30 0.80 −20.00 28.10 0.80 Bern 12.60 4.20 0.20 0.67 −34.10 59.60 1.52 Fribourg 16.90 8.50 0.20 0.50 −49.90 120.10 2.58 Genève 13.50 5.10 0.27 0.62 −37.70 70.30 1.73 Glarus 13.50 5.10 0.20 0.62 −37.60 69.90 1.72 Graubünden 13.20 4.80 0.20 0.64 −36.20 65.70 1.64 Jura 12.70 4.30 0.22 0.66 −33.30 57.60 1.48 Lucerne 14.70 6.30 0.21 0.57 −42.60 87.50 2.05 Neuchâtel 11.70 3.30 0.24 0.72 −29.50 47.70 1.27 Nidwalden 13.60 5.20 0.20 0.62 −38.50 72.70 1.78 Obwalden 16.40 8.00 0.18 0.51 −49.00 115.50 2.51 Schaffhausen 13.40 5.00 0.20 0.63 −37.60 70.10 1.73 Schwyz 17.10 8.70 0.18 0.49 −50.50 123.50 2.63 Solothurn 13.50 5.10 0.20 0.62 −38.70 73.50 1.79 St. Gallen 14.00 5.60 0.21 0.60 −40.60 80.00 1.91 Thurgau 16.70 8.30 0.19 0.50 −50.40 122.50 2.61 Ticino 13.90 5.50 0.20 0.61 −40.30 78.80 1.89 Uri 13.30 4.90 0.19 0.63 −37.70 70.40 1.73 Valais 15.30 6.90 0.18 0.55 −45.20 97.60 2.22 Vaud 14.60 6.20 0.21 0.58 −42.90 88.40 2.06 Zug 14.90 6.50 0.21 0.56 −44.20 93.80 2.16 Zürich 13.40 5.00 0.23 0.63 −37.80 70.80 1.74 Switzerland 13.90 5.50 0.21 0.60 −37.00 68.10 1.69
c∗(%): contribution rate on old age survivors’ pensions in 2045.
cc∗(%): increase in % points in contribution rate on old age survivors’ pensions in 2045.
t∗: transfer ratio in 2045.
ct: Coefficient multiplying 2014 transfer ratios.
∆p(%): % change in average pension in 2045 if productivity remains constant. ∆GDP (%): % change in GDP in 2045 if the average pension (p) remains constant. ∆GDP y%): yearly % change in GDP in 2045 if the average pension (p) remains constant.
attention on which are the necessary and desirable actions for the Swiss nation and which are the ones that will mostly create internal inequalities.
The Swiss pension system provides a change in the pension benefits based on a hybrid index computed using 50% of the nominal salary index calculated by the SFSO and 50% of the Swiss consumer price index. To alleviate the burden of the natural increase of the mean pension benefit, Gil-Alonso (2012) suggests to index the pensions to prices rather than wages, solution embraced, for example, by Spain. In this way the rise in the average pension benefit would slow down with respect to the GDP per employed. Such move would most probably lower the Swiss
transfer ratio (0.4) closer to the European average (0.23)18. Another common manoeuvre is to
rise the contribution rate above 8.4% to the pensions.
Canton-specific preferable policies arise from the different ageing process each canton is facing. From a decentralized perspective, cantons, like Basel-Stadt and Geneva, which already have a high share of foreign population, should find a more viable solution to increase the employ-ment to sustain the pension system in future years. Conversely, other cantons like Obwalden, Fribourg and Schwyz, should prefer a national homogeneous increase of the expenditure rates.
Conclusions
The imminent boom in the number of pensioners, caused by the retirement of the baby boomers, the low fertility rates and the increase of the life expectancy, is pushing a coherent reform of the pension systems at the top of the political agenda. As a contribution to the discussion, this report has tried to portray the future of the first pillar of the Swiss pension system.
So far Switzerland has been in a better situation than other European countries. One of the characteristics which might have partially contributed to this comparative advantage, beyond the high internal GDP per capita, is the 29% of foreign population, which lowered the average population age. However, this is becoming less and less true. The majority of new migrants has achieved tertiary education, which translates into more years spent for formation and older age when they experience labour migration. Nevertheless, their high skills may compensate their less beneficial age structure by boosting the Gross Domestic Product (GDP) and the productivity.
While the computation of the impact of immigration on the GDP remains beyond the scope of this study, I have concentrated on the possibility to avoid the shrinkage of the pension system through the injection of new workforce into the labour market. The results show that when immigration is considered as the only method to maintain the AHV/AVS at its 2014 state, the number of employed people should rise of an additional 3.1 millions beyond the 5.2 mln predicted by the population forecasts. In terms of migrants these numbers translate into a further 3.5 mln, increasing the total foreign population by 110%. At the same time a rise of the retirement age might be a feasible remedy to reduce the need of foreign labour force from 110% to 80%. An achievable solution requires a policy mix. For example, the required workforce significantly drops if the model accounts for a plausible GDP growth. Even when considering a conservative scenario, where the Swiss GDP would increase by +1% between 2015 and 2045, the number of employed persons would drop to 1.6 mln and of immigrants to 1.8 mln. Fur-thermore, no necessary increase in the labour force would be needed in case of an economic expansion pushing the GDP to a +1.69% per year. Behind the national picture, important dis-parities of the cantonal demographies should be considered by policy makers since alternative
compensatory actions will disadvantage some cantons while benefiting some other. Hence, any reasonable and equitable solution, calls for a combination of the compensatory actions.
Far from being exhaustive, the analysis leaves some important open issues such as, employment rates and GDP ad hoc forecasts, the potential role of inflation and the relation between migra-tion and GDP. Moreover, Switzerland has been considered as a sort of "island" unaffected by anything happening outside its borders. Immigration has been forecast exclusively using the Swiss immigration historical data while its relations with important pulls factors, such as the GDP per capita, have remained unexplained. Further research would benefit not only from the incorporation of the influence of the Swiss GDP per capita on migration flows, but also from considering if the GDP of alternative destination countries might affect Swiss immigration.
References
BSV (2015). Statistique de l’AVS 2014 - Tableaux détaillés. Tech. rep. BSV-318.123.15-f-tab. Office fédéral des assurances sociales, Bern. url: https://www.bfs.admin.ch/bfs/fr/ home/statistiques/securite- sociale/assurances- sociales.assetdetail.350245. html.
Bundesrat (2013). Gesamtsicht über die Finanzierungsperspektiven der Sozialversicherungen bis
2035. Tech. rep. Bern.
Gil-Alonso, Fernando (2012). “Ageing and Policies: Pension Systems Under Pressure”. In: The
Family, the Market or the State? Intergenerational Support Under Pressure in Ageing Soci-eties. Ed. by Gustavo De Santis. Springer Netherlands: Dordrecht, pp. 35–58. isbn:
978-94-007-4339-7. doi: 10.1007/978-94-007-4339-7_2. url: https://doi.org/10.1007/978-94-007-4339-7_2.
Han, Kyung Joon (2013). “Saving public pensions: Labor migration effects on pension systems in European countries”. In: The Social Science Journal 50(2), pp. 152–161. issn: 0362-3319. doi: 10.1016/j.soscij.2012.12.001. url: http://www.sciencedirect.com/science/ article/pii/S0362331912001292.
Liebig, Thomas and Jeffrey Mo (2013). The fiscal impact of immigration in OECD countries;
Chapter 3 in OECD (ed.) International Migration Outlook 2013 (with J. Mo). Chap. 3,
pp. 125–190.
Milivinti, Alice and Giacomo Benini (2017). “Immigration Forecasts: a Bayesian Semiparametric Approach for Seasonal Data”. Manuscript submitted for publication.
Munz, Sonja and Martin Werding (2005). “Public pensions and international migration: some clarifications and illustrative results”. In: Journal of Pension Economics and Finance 4(2), pp. 181–207. doi: 10.1017/S1474747205001988.
OECD (2015). “Long-term projections of public pension expenditure”. In: doi: 10 . 1787 / pension _ glance - 2015 - 33 - en. url: https : / / www . oecd - ilibrary . org / docserver / pension_glance-2015-33-en.pdf.
OECD (2017). “Regional economy”. In: doi: 10.1787/6b288ab8-en. url: https://www.oecd-ilibrary.org/content/data/6b288ab8-en.
OECD (2018). “GDP long-term forecast (indicator)”. In: Accessed on 09 January 2018. doi: 10.1787/d927bc18-en. url: https://data.oecd.org/gdp/gdp-long-term-forecast. htm.
Razin, Assaf and Efraim Sadka (1998). Migration and Pension. Working Paper 6778. National Bureau of Economic Research. doi: 10.3386/w6778. url: http://www.nber.org/papers/ w6778.
Serrano, Felipe, Begona Eguía, and Jesús Ferreiro (2011). “Public pensions’ sustainability and population ageing: Is immigration the solution?” In: International Labour Review 150(1-2), pp. 63–79. issn: 1564-913X. doi: 10 . 1111 / j . 1564 - 913X . 2011 . 00105 . x. url: http : //dx.doi.org/10.1111/j.1564-913X.2011.00105.x.
Sinn, Hans-Werner (1997). The Value of Children and Immigrants in a Pay-As-You-Go Pension
System: A Proposal for a Partial Transition to a Funded System. Working Paper 6229.
National Bureau of Economic Research. doi: 10.3386/w6229. url: http://www.nber. org/papers/w6229.
Steiner, Ilka and Philippe Wanner (2015). Towards a New Data Set for The Analysis of
Mi-gration and InteMi-gration in Switzerland. Working Paper 1. NCCR On the Move. url: http:
//nccr-onthemove.ch/publications/towards-a-new-data-set-for-the-analysis-of-migration-and-integration-in-switzerland/.
Swiss Federal Statistical Office (2015a). Les scénarios de lévolution de la population de la Suisse
2015 2045. url: https://www.bfs.admin.ch/bfs/fr/home/statistiques/population/
evolution-future/scenarios-suisse.html.
Swiss Federal Statistical Office (2015b). Scénarios de l’évolution de la population des cantons
de 2015 à 2045 - Population résidante permanente des cantons selon 3 scénarios. url:
https : / / www . bfs . admin . ch / bfs / fr / home / statistiques / population / evolution -future/scenarios-cantons.assetdetail.335772.html.
Swiss Federal Statistical Office (2017). Frontaliers étrangers selon le sexe, le canton de travail
et le pays de résidence. url: https://www.bfs.admin.ch/bfs/fr/home/statistiques/
travail-remuneration/enquetes/staf.assetdetail.3722283.html.
UN Population Devision (2000). “The UN Population Division on Replacement Migration”. In: Population and Development Review 26(2), pp. 413–417. doi: 10.1111/j.1728-4457. 2000.00413.x. eprint: https://onlinelibrary.wiley.com/doi/pdf/10.1111/j.1728-4457.2000.00413.x. url: https://onlinelibrary.wiley.com/doi/abs/10.1111/j. 1728-4457.2000.00413.x.