HAL Id: hal-01670816
https://hal.archives-ouvertes.fr/hal-01670816
Submitted on 18 Sep 2018
HAL is a multi-disciplinary open access
archive for the deposit and dissemination of sci-entific research documents, whether they are pub-lished or not. The documents may come from teaching and research institutions in France or
L’archive ouverte pluridisciplinaire HAL, est destinée au dépôt et à la diffusion de documents scientifiques de niveau recherche, publiés ou non, émanant des établissements d’enseignement et de recherche français ou étrangers, des laboratoires
Modeling and in-situ evaluation of thermal gradients
during sintering of large ceramic balls
Laurent Gremillard, K Biotteau-deheuvels, P Clement, M Perron, P
Duvauchelle, Sylvain Meille, Jérome Chevalier
To cite this version:
Laurent Gremillard, K Biotteau-deheuvels, P Clement, M Perron, P Duvauchelle, et al.. Modeling and in-situ evaluation of thermal gradients during sintering of large ceramic balls. Ceramics International, Elsevier, 2017, 43 (9), pp.7338-7345. �10.1016/j.ceramint.2017.03.037�. �hal-01670816�
Modelling and in-situ evaluation of thermal gradients during sintering of
large ceramic balls.
Published in Ceramics International, 2017, 43 (9) pp. 7338-45
http://dx.doi.org/10.1016/j.ceramint.2017.03.037
L. Gremillard1,*, K. Biotteau-Deheuvels1, P. Clement1, M. Perron1, P. Duvauchelle2, S. Meille1, J. Chevalier1,
1
Univ. Lyon, INSA-Lyon, MATEIS (UMR CNRS 5510), 20 avenue Einstein, F-69621 Villeurbanne, France
2
Univ. Lyon, INSA-Lyon, LVA, 20 avenue Einstein, F-69621 Villeurbanne, France *
Corresponding author: Laurent.gremillard@insa-lyon.fr
Abstract
During the sintering process of ceramic pieces, temperature gradients may arise inside the piece if the thermal cycle is too fast with regards to the size of the ceramic body. Too large temperature gradients may lead to density gradients, thus to strain gradients which may result in defects or in the fracture of the pieces. This article presents both an experimental setup and the first steps towards a numerical method to evaluate these thermal gradients and their evolutions during sintering, in the case of large zirconia, alumina and zirconia-toughened alumina balls. Finally it discusses the advantages of Rate Controlled Sintering thermal cycles in terms of diminishing the temperature gradients during densification.
Keywords
thermal treatment, zirconia-toughened alumina, simulation, sinter/sintering
1. Introduction
The aim of Total Hip Arthroplasty is to rebuild a functional hip joint. Charnley first used a femoral head with a diameter of 41.5 mm[1]. At that time (the early 1960’s) he unfortunately had to abandon this large head size because of the limitations of the materials wear performances. After a trend to decrease the size of the femoral heads (down to 22.2 mm diameter, allowing lower wear debris generation) larger and larger femoral heads have been recently developed. They now reach 46 mm diameter (sometimes up to 51), which allows more flexibility for the surgeon, more comfort for the patient and lower risks of dislocation. New materials and techniques serve this will of increasing the femoral head diameter toward the size of the natural hip joint (usually between 45 and 55 mm). The use of ceramic-on-ceramic bearing couples give most promising results compared to other bearing couples (lower friction, very few wear debris). Moreover the third generation ceramic-on-ceramic articulation could be of particular benefit for young and/or active adults, with the use of large ceramic femoral heads [2]. This diameter evolution is supported by many studies insisting on the improvement of the living quality: increased Range Of Motion [3], decreased risk of dislocation [3-6], decrease of wear debris amount [7], increased stability of the hip [3] and decreased risk of impingement [8, 9].
However large technical ceramic pieces face an important, intrinsic processing difficulty: their large size and low thermal conductivity make them susceptible to the apparition of potentially large thermal gradients during sintering. Moreover, industrial ceramic components are commonly produced by Cold Isostatic Pressing (CIP) or Uniaxial Pressing, followed by sintering in air. This process can induce defects such as density gradients in the component
which will be exaggerated by sintering [10]. In fact, sintering leads to consolidation of the material through particle bonding and porosity elimination. During the heat treatment, mass transfer takes place to minimize surface energies and large microstructural changes occur, leading to densification and grain growth. Since temperature directly influences the shrinkage rate, the generated thermal gradients linked to the relatively low density gradient may result in differential shrinkage throughout the piece, thus distortion, potential cracking or even premature end of the shrinkage [11]. This is even more pronounced with the application of recent, fast sintering techniques such as Spark Plasma Sintering and Microwave Sintering. Consequently, successful near net shape forming of ceramic powder based components can be made easier by a more careful consideration of thermal gradients, through both experimental and simulation works.
Since the 1960’s, many researches have been conducted to describe and/or model the sintering mechanisms and processes. Modeling of the sintering process is thoroughly investigated, via an important numbers of methods at different scales (mostly scale of the grains, and scale of the parts). The most advanced studies take into account multi-scale modeling [10-12]. Macroscopic models of sintering generally aim to describe shape evolution and mechanical constraints at large scale, with the hypothesis of a homogeneous microstructure by finite elements methods (FEM). More recent developments also take into account the heterogeneity of the initial microstructure. For example, X-Ray Computed Micro-Tomography (XRCT) [13] combined with modeling revealed itself a useful tool to obtain 3D visualization of microstructural evolutions during isothermal sintering. These observations served as a basis for the analysis of sintering phenomena in order to extract more statistical results and experimental data to improve modeling. [14] As an example, Schoenberg et al.[15, 16] recently used finite element analysis to calculate the stresses resulting from the variations in green density. The approach involved measurements of the viscosity constants as a function of green density, combined with X-ray computed tomography to describe the density variations prior to sintering. The finite element analysis then allowed a simulation of the stresses and strains occurring in the densification process of a specific sample. This allowed regions of high stress to be identified and this was correlated to the observed damage.
However, only few of these studies even mention the existence of a thermal gradient during sintering [17, 18]. The goal of this paper is thus to characterize experimentally the thermal gradients in large ceramic spheres during sintering and make a first attempt at simulating them using a finite element model. The latest would give information about the global shrinkage kinetics. This is a first step towards a finite element simulation that could also predict distortions of the compact during and after sintering and internal stresses during sintering.
2. Materials and methods 2.1. Finite Element Model
Finite Element Simulations (with the software ANSYS 14.5) of the heating and plateau phases of a sintering thermal cycle were conducted on 51 mm diameter spheres (diameter before simulation) made of zirconia-toughened alumina, monolithic alumina or zirconia (3Y-TZP) ceramics. The calculations were conducted on an axisymmetric 2D model with a regular mesh (PLANE13 quadrangle elements[19], (2-D coupled field solid)), coupling mechanical and thermal analyses in transitory regime. The output of the calculation was the temperature field in the ceramic sphere versus time. From this output, the evolutions with time of three parameters were specially considered: the temperature on the center of the sphere (TC), on its
the temperature gradient inside the sphere, the issues linked to heat transfer between the furnace and the sphere were ignored using Dirichlet conditions, i.e. by setting the sphere surface temperature to the furnace temperature.
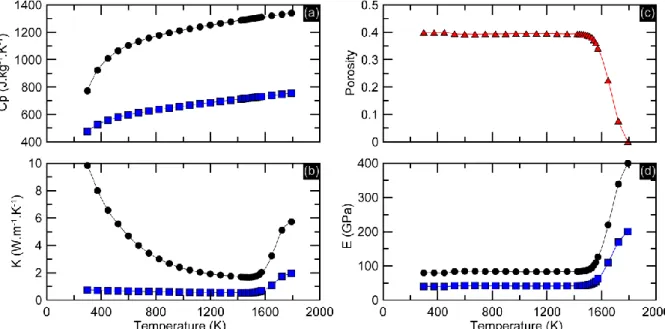
All materials properties necessary for the simulation vary during sintering, both with temperature and density. They are represented on Figure 1, and explained below. The properties of ZTA were approximated using a simple proportionality between those of zirconia (10%) and those of alumina (90%).
Figure 1: Materials properties used for the simulation vs temperature (blue squares: zirconia; black circles: alumina. (a): Specific heat capacity (Cp, J·kg-1·K-1); (b): Thermal conductivity (K, W·m-1·K-1); (c): porosity (measured by dilatometry, the same for all materials); (d): Young’s modulus (E, GPa).
The evolution of density versus temperature, (T), was determined experimentally by
dilatometry on small cylinders ( 1 cm diameter, 5 mm thickness), following a typical thermal sintering cycle (1K·min-1 until 473 K, 2h dwell, 5 K·min-1 up to 1793 K, 2 h dwell and ~5 K·min-1 down to room temperature), giving directly access to the variations of porosity with temperature P(T). It was then translated in the simulation by assimilating the density variation with temperatures to a thermal shrinkage. A secant apparent thermal expansion coefficient varying with temperature,( )T , was therefore defined according to eq. 1:
0
0 0 0 L T L T T T T 3 T T eq.1Where L(T) is the length of the sample used for the dilatometry measurement at a temperature
T, L0 is its initial length (at room temperature T0), and and 0 are the density of the same
sample at temperature T and room temperature. Eq.1 is valid for an isotropic shrinkage, which is reasonable for samples pressed by CIP. The increase in density with temperature results in a negative apparent thermal expansion coefficient. One should note that the densification versus temperature curve is strongly dependent on the powder and pressing parameters, and may vary greatly from one powder to another even if they have the same nominal composition. Conversely, powders of different nature may present the same densification versus temperature curve. Therefore, for the sake of comparison, the same densification vs temperature curve was used for all materials considered here.
All other material parameters were expressed as a function of density (or porosity) and temperature (when applicable). As density itself is expressed as a function of temperature, the variation of every single parameter during simulation can be expressed as a function of temperature only (but this variation accounts for both the effects of temperature and density). This approach greatly simplifies the simulation inputs.
The material was considered as purely linear-elastic. Although this is a huge approximation, especially at higher temperatures, this should not influence the thermal gradients. Young’s modulus was considered as varying linearly with porosity, following Dewey–Mackenzie relations [20] as:
0
0
0 0 E T 3 1 9 T E 5 1 P 2 7 5 ν ν ν eq. 2Where E(T) is the Young’s modulus during the sintering cycle, E0 the Young’s modulus of
the 100% dense material at T0, 0=0.26 the Poisson’s coefficient, and P(T) the porosity of the
material (varying with temperature). E0 was considered as constant with temperature [20]:
400 GPa for alumina et 200 GPa for zirconia. Although in truth E0 varies slightly with
temperature [21], this variation does not impact the thermal behavior.
The thermal conductivity K(T) (W·m-1·K-1) is described by equation 3(a), [22] in which KD(T)
is the thermal conductivity of the dense material (depends on temperature), and n is a dimensionless coefficient chosen equal to 8 [23]. KD varies with temperature following the
phenomenological equations 3(b) [24], and 3(c) [24-27] for alumina and zirconia respectively (T expressed in Kelvin). These equations are derived from the data measured by the cited authors. Note that K(T) varies both with porosity and temperature. However, since a dependence of porosity on temperature only was postulated, K(T) can be expressed (in this simulation) as varying only with temperature.
D
2
1 P K T 1 n P T K T T eq. 3(a)
3
D K T 5.5 34.5exp 3.3 10 T 273 eq. 3(b)
3
D K T 1.89 0.974exp 1.85 10 T 273 eq. 3(c)The specific heat capacities CP of alumina and zirconia were respectively calculated using the
approximations shown in eq. 4(a) [28] and 4(b) [25] (T in Kelvin and Cp in J·kg-1·K-1). It was considered as constant vs. density.
3 1 7 p 2 3.476 10 C T 1.126 10 +1.256 10 T T eq. 4(a)
2 1 7 p 2 1.050 10 C T 5.608 10 +1.104 10 T T eq. 4(b)The properties of zirconia-toughened alumina composites were calculated using a simple rule of mixtures.
Different thermal cycles were used during the simulations, in order to evaluate their effect on temperature homogeneity in the spheres. The first one (EC, standing for Experimental Cycle)
reproduce Rate Controlled Sintering cycles (5RCS and 19RCS: respectively 5 or 19 K·min-1 up to 1430 K, followed by a heating rate proportional to the densification rate so that the duration of the 19 RCS cycle is the same as that of a typical 5 K·min-1 cycle).
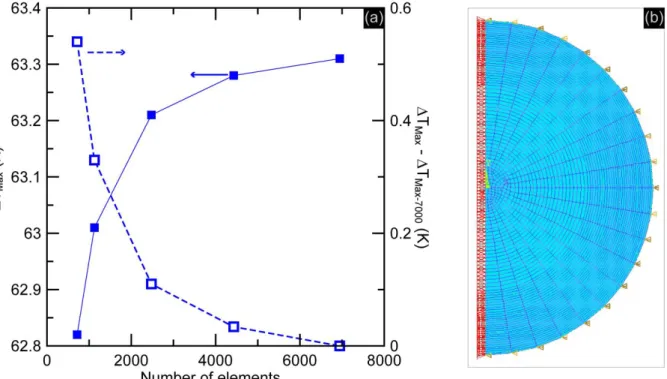
A convergence analysis was conducted on a sintering cycle at 10 K·min-1 applied to zirconia, with a number of elements between 700 and 7000. In these calculations the maximum difference between the temperatures on the surface and in the center of the sphere (TMax) was picked up. Figure 2 shows a maximum difference of 0.5 K between the different TMax
calculated with the different meshes. Thus it was decided to use a 1100 elements mesh, providing both adequate accuracy and fast simulations.
Figure 2: (a) Convergence analysis giving the maximum temperature difference between the center and the surface for different number of elements (left axis) and the difference in this value as compared to the case of 7000 elements (right axis), and (b) representation of the meshing with 1100 elements.
2.2 In-situ measurement of temperatures during sintering
Experiments were conducted on zirconia-toughened alumina composite spheres (around 44 mm diameter in the green state). The spheres were obtained by Cold Isostatic Pressing (CIP) of a granulated powder (composed of 10 vol. % un-stabilized zirconia and 90 vol. % alpha alumina, Medical Group, Vaulx-en-Velin, France). In order to measure temperature gradients
in situ during sintering, S-type thermocouples were embedded in the spheres during the CIP
stage (3 negative wires welded to the same positive wire). Their positions were later checked by X-Ray radiography. The green sphere and embedded thermocouples were then placed on a powder bed, inside a closed crucible in an air furnace. During sintering, the signal of the thermocouples was recorded by a National Instrument acquisition card linked to a computer, allowing real time recording of the temperatures in three locations in the same head. The measured temperatures were then corrected using a blank experiment (performed before embedding the thermocouples in the sphere): the same thermocouples were used with the same temperature cycle, alone inside the closed crucible. The sintering cycles consisted in a
slow ramp (1K·min-1) followed by a dwell at 473 K, then a 5 K·min-1 up to 1793 K, followed by a 2 h dwell and a ~5 K·min-1 cooling ramp, which is consistent with sintering cycles used in real industrial conditions. The experimental setup is described on Figure 3, together with the applied thermal cycle.
Figure 3: Experimental setup (a) and temperature cycle (b) used to measure the thermal gradients in a sphere during sintering.
3. Results
3.1. Finite Element Model
The temperature differences between the surface and the center of a sphere (T=Ts-Tc)
obtained with the FE simulations are presented in Figure 4 for alumina and zirconia (simulations for ZTA do not differ significantly from those of alumina). As expected from their relative thermal conductivity, for all thermal cycles the temperature inside zirconia spheres is more heterogeneous than inside alumina or ZTA spheres.
Beside the material itself, the parameter with the highest influence on T is the heating rate:
faster heating means higher T. Simulations at constant heating rates of 5, 10, 20, 30, 40 and
50 K·min-1 show that whatever the material, both the maximal T during a thermal cycle
(TMax) and the temperature at which it is reached (T(TMax)) are proportional to the heating
rate (Figure 5(a)). Moreover, Figure 5(b) shows that T(TMax) and TMax are alsoproportional,
and that the relation between them does not depend on the material.
Figure 5: (a) Evolutions of TMax and T(TMax) (temperature for which T is maximum) with heating rate, and (b) proportionality between TMax and T(TMax) (the size of the bubbles is proportional to the heating rate).
The simulations with Rate-Controlled Sintering conditions show that at the beginning, during the fast heating rate T logically increases at the same pace as it would with a 5K·min-1 or 19K·min-1 heating rate. However, when densification starts and thus the heating rate decreases (down to near 1 K·min-1), T dramatically decreases and becomes the lowest of all
simulated conditions: in average during the densification steps (between 1440 K and 1793 K), T is 68% lower during Rate Controlled Sintering (whatever the initial heating rate) than
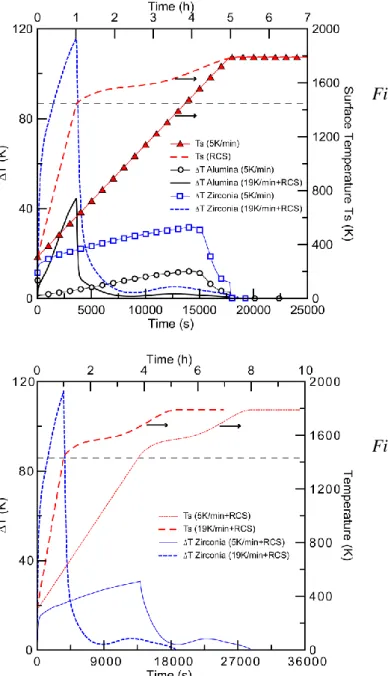
during a sintering at 5 K·min-1 constant heating rate for alumina, and 64% lower for zirconia (Figure 6). A comparison of T obtained for a 5K·min-1 cycle and a 19RCS cycle in zirconia between 100 and 1700 K is shown on figures 7, Reducing the initial heating rate (5RCS cycle) further reduces the temperature gradient before densification starts, without affecting it after. This is illustrated on zirconia on figure 8.
Figure 6: Comparison between Rate-Controlled Sintering (19RCS, thick lines without symbols) and sintering at 5K·min-1 (thin lines with symbols) for alumina (black) and zirconia (blue). Red lines indicate the temperature
Figure 7: Comparison between Rate-Controlled Sintering at two initial heating rates: 19RCS (thick lines) and 5 RCS (thin lines) for
zirconia (blue). Red lines indicate the temperature (thick, dashed line: 19RCS; thin, dashed line: 5RCS)
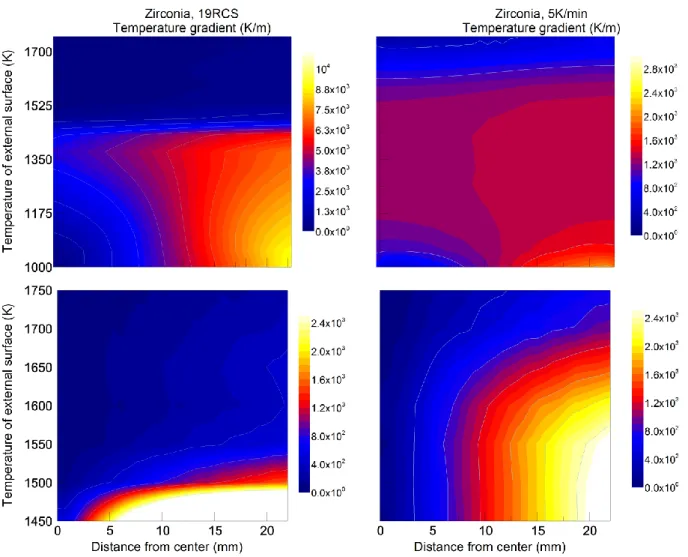
Figure 8: Temperature gradients in zirconia during 19RCS cycle (left) and 5K/min sintering cycle (right). The top line shows the gradient between 100 and 1750K (color scale are not identical). The bottom line shows the gradient during densification (between 1450 and 1750K; color scales are identical); it confirms the much lower gradient during densification (above 1500K in particular) obtained with RCS cycles.
3.2 In-situ measurement of temperatures during sintering
The temperature differences between the surface (TS) and center (Tc) of the spheres were only
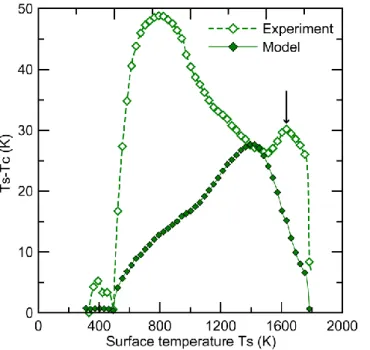
measured on ZTA. Erreur ! Source du renvoi introuvable.The results are presented on Figure 9. A small difference exists at low temperature, but is removed by the plateau at 473 K. After this plateau, the temperature difference increases steadily until it reaches almost 50 K at an external temperature around 800 K. Then it mostly decreases until it reaches 30 K at an external temperature of 1600 K. Finally, the temperature difference decreases in two significant steps: the first step takes place at an external temperature of 1650 K (internal temperature of 1620 K), when a significant densification has already taken place in the whole body (porosity below 30 %) and thus the thermal conductivity increases (arrow indicated in Figure 9). The second decrease takes place when the external temperature reaches the soaking temperature (1793 K) and stops increasing, and the temperature naturally homogenizes with time in the body.
Figure 9: Temperature difference between the surface (Ts) and the center (Tc) of a ZTA sphere measured in situ during densification (open diamonds) and calculated using the finite element model (full diamonds).
4. Discussion
In general, the orders of magnitude of the temperature differences between the surface and center of the spheres computed using the finite element model are in good agreement with the measured ones, for similar conditions. Given the difficulty of the experiments, it is difficult to know whether the experiments or the model are most precise.
Indeed, the experimental measurement may be impaired by many factors. These factors are: - The electromagnetic fields inside the furnace that can change the potentials in the thermocouples.
- The thermal conductivity of the thermocouples can also change the measured temperature, mostly in the center of the heads (thus the temperature of the center would be overestimated during heating, and the measured thermal gradient artificially decreased).
- The thermocouples are bent during the CIP step; this can affect their metallurgical state and thus the temperature measurement.
The most important finding of this study is perhaps the demonstration of the existence of very low thermal gradients during densification when using Rate Controlled Sintering thermal cycles. RCS thermal cycles should be separated in two different phases: heating and densification. During the heating phase, the first heating rate can be large (it was limited here to 19 K / min), and give rise to high temperature differences between the surface and the core (44 K in alumina, 115 K in zirconia, both at a surface temperature of 1433 K, for a 19RCS cycle). Since the temperatures during the heating phase are compatible with an elastic behavior of the materials, with the Young’s modulus given in Figure 1 (or Eq. 2) (resp. 84 and 42 GPa for alumina and zirconia), and using a Coefficient of Thermal Expansion of 6.3·10-6 for alumina and 11·10-6 for zirconia, one can calculate maximum elastic stresses of about 23 MPa for alumina and 53 MPa for zirconia. Of course these values should be taken only as orders of magnitudes. But they still exceed by far the strength of green ceramic bodies (a few MPa at most[29]). Thus heating at such a high rate may result in cracking of the body. However, the initial heating rate applied here for 19RCS was calculated so that the total duration of RCS thermal cycle is the same as the duration of a 5K/min thermal cycle. Since
problem, as it is shown by the 5RCS cycles. As soon as the densification phase starts and microstructures start to develop, the thermal gradients reach very low values (maximum 2 K for alumina and 5K for zirconia above 1573 K, when densification takes place) since simultaneously the heating rate becomes low and the conductivity starts to increase. This presents two advantages: it should produce pieces with very low distortions and with very homogeneous microstructures (because of the very low thermal gradients, every location of the body will experiment the same thermal history). Thus an ideal sintering cycle for large ceramic bodies, in terms of homogeneity and distortions, may be constituted by a slow heating rate up to the temperature where densification starts (1560K here) followed by a rate-controlled sintering cycle during densification.
Some other results of the finite element analysis are expected, such as the proportionality of the maximum thermal gradient with the heating rate. However, the (applied) temperature for which the maximal thermal gradient is observed (T(TMax)) lays between 1500 and 1700K,
depending on the material and the sintering conditions. This indicates first that the temperature gradient decreases between the temperature at which the densification starts (~1500 K) and the soaking temperature (1793 K). This is explained by an increase of the thermal conductivity due to densification. Densification starts at the surface, where the temperature is the highest, and the densification front “propagates” to the interior. When density is high enough everywhere in the sintering body, the thermal gradient can start to decrease. This is reached for an internal temperature of around 1500 K for the three materials, corresponding to a 2% density increase (from 60 to 61.2% theoretical density in the center of the pieces).
As for now, this purely phenomenological model shows three main limitations:
- The simulations do not take into account the elasto-visco-plastic behavior of the materials, which prevents an analysis of internal stresses. However, the model could be improved with further development based on experimental data.
- An important point for a more accurate modeling of the thermal gradient is accounting for density inhomogeneity. Indeed, all the simulations presented here consider a perfectly homogeneous starting material. However, in green bodies, especially in large ones, particles may be heterogeneously packed. These heterogeneities can affect densification either directly or indirectly. The direct effect results from density itself: the less dense parts will sinter with more difficulty, and be submitted to a larger shrinkage (thus larger distortions). The indirect effect is a thermal effect: less dense parts have a lower thermal conductivity and will be submitted to larger thermal gradients, thus to larger distortions.
- The influence of heating rate on the sintering kinetics was neglected. It is known that faster heating rate can result in faster densification (not taking into account the thermal gradients). This effect is neglected here and could be accounted through the establishment of Master Sintering Curves.
Other, less important, points could be more easily refined:
- Most physical characteristics of materials were not measured, but extrapolated from literature.
- The evolution of density with temperature was measured on ZTA only, and was used for the simulations for the three materials. This is of limited importance, since the densification behavior varies greatly with the pre-sintering processing steps (pressing, casting…) and the nature of the powder (particle size, dopants…).
- The simulations are conducted only on the heating part of the cycle and on the plateau, preventing the analysis of thermal gradients during cooling. Simulating the cooling would necessitate to inject the results obtained by the present model after the plateau into a second
model in which the density remains constant with temperature (unlike during heating) while all other physical properties vary with temperature. This is also of limited importance, since cooling in industrial furnaces is generally very slow due to the size and thermal inertia of the furnaces.
The main interest of running such simulation is to obtain a useful and effective tool in order to simulate the sintering behavior of large ceramic parts. This model is quite simple and easily transferable to other geometries but also to other materials. Materials properties and sintering conditions can be easily modified to adapt in every situation. Finally the calculation time is relatively fast, as it takes less than one hour on a commercial laptop, which put this model as a useful tool for calculating sintering thermal cycles.
5. Conclusion
This article aimed at establishing a macroscopic finite element model of sintering, and comparing these simulations to the measured thermal gradients inside a ceramic sphere during sintering. Both experiments and model give results with comparable orders of magnitudes. The model shows that the temperature gradients inside a large ceramic piece vary linearly with the heating rate, and that the maximum gradient is reached just above the temperature where shrinkage begins.
Moreover, it may allow the determination of optimal sintering cycles taking into account the temperature (thus microstructural) homogeneity inside the pieces. It might however not be sufficient in its current version to predict the shape changes during sintering, as these changes are related to temperature gradients via shrinkage and mechanical stresses, which are highly influenced by the thermo-mechanical behavior of the materials (approximated here as purely elastic).
Acknowledgements
The authors wish to acknowledge the French ANR (Agence Nationale pour la Recherche) for its support to project OptHip under grant number MAPR07-0014. The authors also thank Medical Group (Vaulx en Velin, France) for providing ZTA powder, and François Valdivieso (Ecole des Mines de St Etienne) for useful discussions around this topic.
References
[1] B.M. Wroblewski, P.D. Siney, P.A. Fleming, The Charnley Hip Replacement – 43 Years of Clinical Success, Acta Chir.Orthop. Traumatol. Cechols., 73 (2006) 6-9.
[2] J.-W. Byun, T.-R. Yoon, K.-S. Park, J.-K. Seon, Third-Generation Ceramic-On-Ceramic Total Hip Arthroplasty in Patients Younger Than 30 Years with Osteonecrosis of Femoral Head, J. Arthroplast., 27 (2012) 1337-1343.
[3] B.R. Burroughs, B. Hallstrom, G.J. Golladay, D. Hoeffel, W.H. Harris, Range of Motion and Stability in Total Hip Arthroplasty With 28-, 32-, 38-, and 44-mm Femoral Head Sizes: An In Vitro Study, J. Arthroplast., 20 (2005) 11-19.
[4] S.S. Jameson, D. Lees, P. James, I. Serrano-Pedraza, P.F. Partington, S.D. Muller, R.M. Meek, M.R. Reed, Lower rates of dislocation with increased femoral head size after primary total hip replacement: a five-year analysis of NHS patients in England., Journal of Bone and Joint Surgery, British Volume, 93 (2011) 876-880.
[5] P. Triclot, F. Gouin, Update - "Big-head": The solution to the problem of hip implant dislocation?, Ortop. Traumatol.: Surg. Res., 97 (2011) S42-S48.
[6] J.L. Conroy, S.L. Whitehouse, S.E. Graves, N.L. Pratt, P. Ryan, R.W. Crawford, Risk Factors for Revision for Early Dislocation in Total Hip Arthroplasty, J. Arthroplast., 23
[7] M. Slonaker, T. Goswami, Review of wear mechanisms in hip implants: Paper II - ceramics IG004712, Mater. Des., 25 (2004) 395-405.
[8] D. Kluess, H. Martin, W. Mittelmeier, K.-P. Schmitz, R. Bader, Influence of femoral head size on impingement, dislocation and stress distribution in total hip replacement, Med. Eng. Phys., 29 (2007) 465-471.
[9] E. Marchetti, N. Krantz, C. Berton, D. Bocquet, N. Fouilleron, H. Migaud, J. Girard, Component impingement in total hip arthroplasty: Frequency and risk factors. A continuous retrieval analysis series of 416Â cup, Ortop. Traumatol.: Surg. Res., 97 (2011) 127-133. [10] D.J. Green, O. Guillon, J. Rödel, Constrained sintering: A delicate balance of scales, J. Eur. Ceram. Soc., 28 (2008) 1451-1466.
[11] J.-M. Missiaen, Modelling of sintering: recent developments and perspectives., Rev. Métallurgie, 99 (2002) 1009-1019.
[12] A. Maximenko, A. Kuzmov, E. Grigoryev, E. Olevsky, Direct Multi-Scale Modeling of Sintering, J. Am. Ceram. Soc., 95 (2012) 2383-2388.
[13] D. Bernard, D. Gendron, J.-M. Heintz, S. Bordère, J. Etourneau, First direct 3D visualisation of microstructural evolutions during sintering through X-ray computed microtomography, Acta Mater., 53 (2005) 121-128.
[14] J.-M. Chaix, Quantitative analysis of microstructure and modeling of sintering, Mater. Sci. Forum, 624 (2009) 1-18.
[15] S.E. Schoenberg, D.J. Green, G.L. Messing, Effect of green density on the thermomechanical properties of a ceramic during sintering, J. Am. Ceram. Soc., 89 (2006) 2448-2452.
[16] S.E. Schoenberg, D.J. Green, A.E. Segall, G.L. Messing, A.S. Grader, P.M. Halleck, Stresses and distorsion due to green density gradients during densification, J. Am. Ceram. Soc., 89 (2006) 3027-3033.
[17] D. Vallauri, G. Maizza, Simulation of Solid State Sintering through FE Modeling for the Optimum Design of 3D Parts, Adv. Eng. Mater., 6 (2004) 952-957.
[18] B. Zhang, M.M. Gasik, Stress evolution in graded materials during densification by sintering processes, Comput. Mater. Sci., 25 (2002) 264-271.
[19] ANSYS, 4.13 PLANE13 2-D Coupled-Field Solid (UP19980821 ), 1998, pp. Description of Plane13 element.
[20] W. Pabst, E. Gregorova, G. Ticha, Elasticity of porous ceramics—A critical study of modulus−porosity relations., J. Eur. Ceram. Soc., 26 (2006) 1085-1097.
[21] F. Mignard, C. Olagnon, G. Fantozzi, P. Chantrenne, M. Raynaud, Thermal shock behaviour of a coarse grain porous alumina, J. Mater. Sci., 31 (1996) 2131-2138.
[22] E.Y. Litovsky, M. Shapiro, Gas Pressure and Temperature Dependences of Thermal Conductivity of Porous Ceramic Materials: Part 1, Refractories and Ceramics with Porosity below 30%. J. Am. Ceram. Soc., 75 (1992) 3425-3439.
[23] S.K. Rhee, Porosity - Thermal conductivity correlations for ceramic materials, Mater. Sci. Eng., 20 (1975) 89-93.
[24] P. Auerkari, Mechanical and Physical Properties of Engineering Alumina Ceramics, Technical Research Centre of Finland1996.
[25] M.V. Swain, L.F. Johnson, R. Syed, D.P.H. Hasselman, Thermal diffusivity, heat capacity and thermal conductivity of porous partially stabilized zirconia, J. Mater. Sci. Lett., 5 (1986) 799–802.
[26] R. Mévrel, J.-C. Laizet, A. Azzopardi, B.r.r. Leclercq, M. Poulain, O. Lavigne, D. Demange, Thermal diffusivity and conductivity of Zr1−xYxO2−x/2 (x=0, 0.084 and 0.179) single crystals, J. Eur. Ceram. Soc., 24 (2004) 3081-3089.
[27] A.M. Limarga, D.R. Clarke, The grain size and temperature dependence of the thermal conductivity of polycrystalline, tetragonal yttria-stabilized zirconia, Appl. Phys. Lett., 98 (2011) 211906.
[28] M. Miyayama, K. Koumoto, H. Yanagida, Engineering properties of single oxides, ASM International, Engineered Materials Handbook., 4 (1991) 748-757.
[29] P. Pizette, C.L. Martin, G. Delette, F. Sans, T. Geneves, Green strength of binder-free ceramics, J. Eur. Ceram. Soc., 33 (2013) 975-984.
Annex 1: Example of Ansys code used for the simulations
! Modèle de frittage d'une tête de prothèse de hanche en zircone ! Etude thermique
! Cp tient compte de l’évolution avec la température ! K lié à température et densité ; K liste au lieu de polynôme ! rampe de montée à 5°C/min au lieu de 19
nbligne =883 ! Lecture du fichier de température
*DIM,tempreelsurfAnsys,TABLE,nbligne,1,1, , , *TREAD,tempreelsurfAnsys,'tempreelsurfAnsys','txt',, ,
!****************************************************************************** ! Variables géométriques et données du problème
!******************************************************************************
! Données géométriques
RA=22e-3 ! Rayon total de la sphère en mètres
RB=19.4e-3 ! Première couche - maillage
RC=16.718e-3 ! Deuxième couche - maillage
RD=13.518e-3 ! Troisième couche - maillage
RE=3.926e-3 ! Quatrième couche - maillage
! Spécifications matériau PR=0.26 ! Coefficient de Poisson D=3590 ! Densité du matériau !Construction du solide /Pnum,KP,1 /Pnum,Line,1 /pnum,area,1
/CONFIG, nres, 5000 ! Nombre de résultats possibles
!****************************************************************************** ! Création de la géométrie et choix du maillage
!******************************************************************************
! Entrée dans le préprocesseur
/PREP7
! Création de la géométrie
PCIRC,RA,0,90,-90 ! Pour le maillage - Création de plusieurs couches
PCIRC,RB,0,90,-90 PCIRC,RC,0,90,-90 PCIRC,RD,0,90,-90 PCIRC,RE,0,90,-90
ET,1,plane 13 ! Choix de l’élément plane13
KEYOPT,1,1,4 KEYOPT,1,2,0 KEYOPT,1,3,1 KEYOPT,1,4,0 KEYOPT,1,5,0 TOFFST,0
! ****************************************************************************** ! Propriétés matériau
! ******************************************************************************
MPTEMP,, 298.15, 323.15, 358.15, 373.15, 398.15,423.15 ! Variation de la température
MPTEMP,, 448.15, 473.15, 498.15,523.15,548.15, 573.15 ! Pour propriétés mécaniques et thermiques MPTEMP,, 598.15, 623.15, 648.15, 673.15, 698.15, 723.15 MPTEMP,, 748.15, 773.15, 798.15,823.15,848.15, 873.15 MPTEMP,, 898.15, 923.15, 958.15, 973.15, 998.15, 1023.15 MPTEMP,, 1048.15, 1073.15, 1098.15,1123.15,1148.15, 1173.15 MPTEMP,, 1198.15, 1223.15, 1248.15, 1273.15, 1298.15, 1323.15 MPTEMP,, 1348.15, 1373.15, 1398.15,1423.15, 1428.15, 1433.15 MPTEMP,, 1438.15,1443.15,1448.15,1453.15,1458.15, 1463.15 MPTEMP,, 1468.15,1473.15,1478.15,1483.15,1488.15, 1493.15 MPTEMP,, 1498.15,1503.15,1508.15,1513.15,1518.15, 1523.15 MPTEMP,, 1528.15,1533.15,1538.15,1543.15,1548.15, 1553.15 MPTEMP,, 1558.15,1563.15,1568.15,1573.15,1598.15, 1623.15 MPTEMP,, 1648.15, 1673.15, 1698.15,1723.15,1748.15, 1773.15 MPTEMP,, 1793.15
mp,dens,1,D ! Application des propriétés du matériau - densité
mp,PRXY,1,PR ! Application des propriétés du matériau – coefficient de Poisson
! Application des propriétés du matériau – module d’Young
MPDE,EX,1 ! Publication Latella et Liu
MPDATA,EX,1,,3.976E+10 MPDATA,EX,1,,4.049E+10 MPDATA,EX,1,,4.062E+10 MPDATA,EX,1,,3.976E+10 MPDATA,EX,1,,3.976E+10 MPDATA,EX,1,,3.976E+10 MPDATA,EX,1,,3.976E+10 MPDATA,EX,1,,4.019E+10 MPDATA,EX,1,,4.102E+10 MPDATA,EX,1,,4.181E+10 MPDATA,EX,1,,4.208E+10 MPDATA,EX,1,,4.229E+10 MPDATA,EX,1,,4.229E+10 MPDATA,EX,1,,4.208E+10 MPDATA,EX,1,,4.229E+10 MPDATA,EX,1,,4.226E+10 MPDATA,EX,1,,4.229E+10 MPDATA,EX,1,,4.229E+10 MPDATA,EX,1,,4.186E+10 MPDATA,EX,1,,4.186E+10 MPDATA,EX,1,,4.195E+10 MPDATA,EX,1,,4.186E+10 MPDATA,EX,1,,4.186E+10 MPDATA,EX,1,,4.186E+10 MPDATA,EX,1,,4.186E+10 MPDATA,EX,1,,4.172E+10 MPDATA,EX,1,,4.136E+10 MPDATA,EX,1,,4.143E+10 MPDATA,EX,1,,4.143E+10 MPDATA,EX,1,,4.143E+10 MPDATA,EX,1,,4.136E+10 MPDATA,EX,1,,4.143E+10 MPDATA,EX,1,,4.143E+10 MPDATA,EX,1,,4.136E+10 MPDATA,EX,1,,4.143E+10 MPDATA,EX,1,,4.143E+10
MPDATA,EX,1,,4.143E+10 MPDATA,EX,1,,4.178E+10 MPDATA,EX,1,,4.181E+10 MPDATA,EX,1,,4.186E+10 MPDATA,EX,1,,4.178E+10 MPDATA,EX,1,,4.201E+10 MPDATA,EX,1,,4.181E+10 MPDATA,EX,1,,4.186E+10 MPDATA,EX,1,,4.186E+10 MPDATA,EX,1,,4.201E+10 MPDATA,EX,1,,4.215E+10 MPDATA,EX,1,,4.199E+10 MPDATA,EX,1,,4.199E+10 MPDATA,EX,1,,4.229E+10 MPDATA,EX,1,,4.243E+10 MPDATA,EX,1,,4.258E+10 MPDATA,EX,1,,4.272E+10 MPDATA,EX,1,,4.270E+10 MPDATA,EX,1,,4.270E+10 MPDATA,EX,1,,4.291E+10 MPDATA,EX,1,,4.310E+10 MPDATA,EX,1,,4.353E+10 MPDATA,EX,1,,4.396E+10 MPDATA,EX,1,,4.409E+10 MPDATA,EX,1,,4.439E+10 MPDATA,EX,1,,4.520E+10 MPDATA,EX,1,,4.582E+10 MPDATA,EX,1,,4.644E+10 MPDATA,EX,1,,4.709E+10 MPDATA,EX,1,,4.773E+10 MPDATA,EX,1,,4.941E+10 MPDATA,EX,1,,5.066E+10 MPDATA,EX,1,,5.148E+10 MPDATA,EX,1,,5.232E+10 MPDATA,EX,1,,5.492E+10 MPDATA,EX,1,,5.609E+10 MPDATA,EX,1,,5.857E+10 MPDATA,EX,1,,6.302E+10 MPDATA,EX,1,,7.397E+10 MPDATA,EX,1,,9.054E+10 MPDATA,EX,1,,1.098E+11 MPDATA,EX,1,,1.290E+11 MPDATA,EX,1,,1.506E+11 MPDATA,EX,1,,1.694E+11 MPDATA,EX,1,,1.819E+11 MPDATA,EX,1,,1.915E+11 MPDATA,EX,1,,2.000E+11
! mp,kxx,1,KA,KB,KC,KD,KE ! Application des propriétés du matériau – conductivité thermique
MPDE,KXX,1 MPDATA,KXX,1,,0.744205666362131 MPDATA,KXX,1,,0.739095596637678 MPDATA,KXX,1,,0.725317838086449 MPDATA,KXX,1,,0.712389553871171 MPDATA,KXX,1,,0.702729617718701 MPDATA,KXX,1,,0.693507008920525 MPDATA,KXX,1,,0.684701928669299 MPDATA,KXX,1,,0.679542764524676 MPDATA,KXX,1,,0.677697314511143 MPDATA,KXX,1,,0.675818250744359 MPDATA,KXX,1,,0.670356793401028 MPDATA,KXX,1,,0.664776389295863 MPDATA,KXX,1,,0.657917603811226 MPDATA,KXX,1,,0.649814852874495
MPDATA,KXX,1,,0.645117513829061 MPDATA,KXX,1,,0.638952091194269 MPDATA,KXX,1,,0.633450167613004 MPDATA,KXX,1,,0.628009591672646 MPDATA,KXX,1,,0.619845852811009 MPDATA,KXX,1,,0.61491038470031 MPDATA,KXX,1,,0.610785359834162 MPDATA,KXX,1,,0.605699652557927 MPDATA,KXX,1,,0.601404615215334 MPDATA,KXX,1,,0.597304024014825 MPDATA,KXX,1,,0.593389075935807 MPDATA,KXX,1,,0.58871248940573 MPDATA,KXX,1,,0.581457272872958 MPDATA,KXX,1,,0.57989661684504 MPDATA,KXX,1,,0.576659431032107 MPDATA,KXX,1,,0.573568800008418 MPDATA,KXX,1,,0.570172038228086 MPDATA,KXX,1,,0.567800963225432 MPDATA,KXX,1,,0.565111375255013 MPDATA,KXX,1,,0.562103812238947 MPDATA,KXX,1,,0.560091978145506 MPDATA,KXX,1,,0.557751393522115 MPDATA,KXX,1,,0.555516772506007 MPDATA,KXX,1,,0.553915890292847 MPDATA,KXX,1,,0.55134644961921 MPDATA,KXX,1,,0.551511950850398 MPDATA,KXX,1,,0.54982190005783 MPDATA,KXX,1,,0.548388382263173 MPDATA,KXX,1,,0.546170019417321 MPDATA,KXX,1,,0.545933669618772 MPDATA,KXX,1,,0.543171231221213 MPDATA,KXX,1,,0.542034790840639 MPDATA,KXX,1,,0.541746973740741 MPDATA,KXX,1,,0.54232522225666 MPDATA,KXX,1,,0.542906440599495 MPDATA,KXX,1,,0.541680029080365 MPDATA,KXX,1,,0.541402283868441 MPDATA,KXX,1,,0.542935839470111 MPDATA,KXX,1,,0.543527201200008 MPDATA,KXX,1,,0.544121463766273 MPDATA,KXX,1,,0.544718615377959 MPDATA,KXX,1,,0.544322254731248 MPDATA,KXX,1,,0.544057451718477 MPDATA,KXX,1,,0.545079619849563 MPDATA,KXX,1,,0.545976347323049 MPDATA,KXX,1,,0.548328383999059 MPDATA,KXX,1,,0.550691586307503 MPDATA,KXX,1,,0.55120672856697 MPDATA,KXX,1,,0.552810715437804 MPDATA,KXX,1,,0.557553408431787 MPDATA,KXX,1,,0.561127200708515 MPDATA,KXX,1,,0.564742636711708 MPDATA,KXX,1,,0.568550214121921 MPDATA,KXX,1,,0.572363202535151 MPDATA,KXX,1,,0.582765837544311 MPDATA,KXX,1,,0.590612243219992 MPDATA,KXX,1,,0.595737540998404 MPDATA,KXX,1,,0.600980012767243 MPDATA,KXX,1,,0.618090106629032 MPDATA,KXX,1,,0.625828480050249 MPDATA,KXX,1,,0.642760368517748 MPDATA,KXX,1,,0.674275541997735
MPDATA,KXX,1,,1.08598404504908 MPDATA,KXX,1,,1.29221752565183 MPDATA,KXX,1,,1.53359552378941 MPDATA,KXX,1,,1.72788539824325 MPDATA,KXX,1,,1.83649639442823 MPDATA,KXX,1,,1.9036074655151 MPDATA,KXX,1,,1.94965288651708
TREF,298.15 ! Température de référence, 25°C
UIMP,1,REFT,,,298.15
MPDE,ALPX,1 ! Application des propriétés du matériau – coefficient de dilatation thermique
MPDATA,ALPX,1,,3.85852e-9 MPDATA,ALPX,1,, 3.85852e-9 MPDATA,ALPX,1,, 3.85852e-9 MPDATA,ALPX,1,, 3.85852e-9 MPDATA,ALPX,1,, 3.85852e-9 MPDATA,ALPX,1,, 3.85852e-9 MPDATA,ALPX,1,, 3.85852e-9 MPDATA,ALPX,1,, 3.85852e-9 MPDATA,ALPX,1,, 3.85852e-9 MPDATA,ALPX,1,, 3.85852e-9 MPDATA,ALPX,1,, 3.85852e-9 MPDATA,ALPX,1,,8.12401e-8 MPDATA,ALPX,1,, -2.97004e-7 MPDATA,ALPX,1,,-1.44899e-7 MPDATA,ALPX,1,,6.35943e-8 MPDATA,ALPX,1,,2.41095e-7 MPDATA,ALPX,1,, 2.5095e-7 MPDATA,ALPX,1,,4.91133e-7 MPDATA,ALPX,1,,6.01682e-7 MPDATA,ALPX,1,,7.84083e-7 MPDATA,ALPX,1,,6.80578e-7 MPDATA,ALPX,1,,7.42194e-7 MPDATA,ALPX,1,,7.85822e-7 MPDATA,ALPX,1,,6.53749e-7 MPDATA,ALPX,1,,8.45579e-7 MPDATA,ALPX,1,,8.24593e-7 MPDATA,ALPX,1,,7.74465e-7 MPDATA,ALPX,1,,7.65222e-7 MPDATA,ALPX,1,,7.43317e-7 MPDATA,ALPX,1,,7.80233e-7 MPDATA,ALPX,1,,7.41412e-7 MPDATA,ALPX,1,,7.32025e-7 MPDATA,ALPX,1,,7.03236e-7 MPDATA,ALPX,1,,6.67753e-7 MPDATA,ALPX,1,,6.54373e-7 MPDATA,ALPX,1,,6.04375e-7 MPDATA,ALPX,1,,5.74585e-7 MPDATA,ALPX,1,,5.60151e-7 MPDATA,ALPX,1,,5.12017e-7 MPDATA,ALPX,1,,4.85879e-7 MPDATA,ALPX,1,,4.7362e-7 MPDATA,ALPX,1,,4.46357e-7 MPDATA,ALPX,1,,4.6212e-7 MPDATA,ALPX,1,,3.46879e-7 MPDATA,ALPX,1,,3.40177e-7 MPDATA,ALPX,1,,2.48437e-7 MPDATA,ALPX,1,,2.43024e-7 MPDATA,ALPX,1,,2.19785e-7 MPDATA,ALPX,1,,1.78549e-7 MPDATA,ALPX,1,,1.45792e-7 MPDATA,ALPX,1,,1.0469e-7 MPDATA,ALPX,1,,5.9304e-8
MPDATA,ALPX,1,,1.29883e-8 MPDATA,ALPX,1,,-3.91435e-8 MPDATA,ALPX,1,,-1.01003e-7 MPDATA,ALPX,1,,-2.10086e-7 MPDATA,ALPX,1,,-3.06941e-7 MPDATA,ALPX,1,,-4.11507e-7 MPDATA,ALPX,1,,-5.71811e-7 MPDATA,ALPX,1,,-7.4614e-7 MPDATA,ALPX,1,,-9.14691e-7 MPDATA,ALPX,1,,-1.18232E-6 MPDATA,ALPX,1,,-1.4242E-6 MPDATA,ALPX,1,,-1.80655E-006 MPDATA,ALPX,1,,-2.15111E-006 MPDATA,ALPX,1,,-2.56591E-006 MPDATA,ALPX,1,,-3.11705E-006 MPDATA,ALPX,1,,-3.78167e-6 MPDATA,ALPX,1,,-4.40781e-6 MPDATA,ALPX,1,,-5.27314e-6 MPDATA,ALPX,1,,-6.07607e-6 MPDATA,ALPX,1,,-7.14899e-6 MPDATA,ALPX,1,,-8.13782e-6 MPDATA,ALPX,1,,-9.23832e-6 MPDATA,ALPX,1,,-1.06785e-5 MPDATA,ALPX,1,,-1.19506e-5 MPDATA,ALPX,1,,-2.05465e-5 MPDATA,ALPX,1,,-3.08983e-5 MPDATA,ALPX,1,,-4.26065e-5 MPDATA,ALPX,1,,-5.48966e-5 MPDATA,ALPX,1,,-6.70025e-5 MPDATA,ALPX,1,,-7.71642e-5 MPDATA,ALPX,1,,-8.38025e-5 MPDATA,ALPX,1,,-8.78126e-5 MPDATA,ALPX,1,,-9.45613e-5
MPDE,C,1 ! Application des propriétés du matériau – capacité calorifique massique
MPDATA,C,1,,475.625345215673 MPDATA,C,1,,495.953793481068 MPDATA,C,1,,518.509330597106 MPDATA,C,1,,526.614053747216 MPDATA,C,1,,538.546660554123 MPDATA,C,1,,548.902190222778 MPDATA,C,1,,558.022529777733 MPDATA,C,1,,566.161703233839 MPDATA,C,1,,573.511638236074 MPDATA,C,1,,580.219529311507 MPDATA,C,1,,586.399789967496 MPDATA,C,1,,592.142438476623 MPDATA,C,1,,597.519083616485 MPDATA,C,1,,602.587264463721 MPDATA,C,1,,607.393641888108 MPDATA,C,1,,611.976376305493 MPDATA,C,1,,616.366920454009 MPDATA,C,1,,620.591386069978 MPDATA,C,1,,624.67159639435 MPDATA,C,1,,628.625904416721 MPDATA,C,1,,632.469834605892 MPDATA,C,1,,636.216590340421 MPDATA,C,1,,639.877458225717 MPDATA,C,1,,643.462132567302 MPDATA,C,1,,646.978977524647 MPDATA,C,1,,650.435240258664 MPDATA,C,1,,655.184078699852
MPDATA,C,1,,663.769261505233 MPDATA,C,1,,667.002857710311 MPDATA,C,1,,670.203802816087 MPDATA,C,1,,673.375035991488 MPDATA,C,1,,676.519172976688 MPDATA,C,1,,679.638547870267 MPDATA,C,1,,682.735248750627 MPDATA,C,1,,685.811148149898 MPDATA,C,1,,688.86792921322 MPDATA,C,1,,691.907108227683 MPDATA,C,1,,694.930054085518 MPDATA,C,1,,697.938005149192 MPDATA,C,1,,700.932083907366 MPDATA,C,1,,703.913309746324 MPDATA,C,1,,706.882610108813 MPDATA,C,1,,709.840830268875 MPDATA,C,1,,712.788741915413 MPDATA,C,1,,713.377150405391 MPDATA,C,1,,713.96518031925 MPDATA,C,1,,714.552836912591 MPDATA,C,1,,715.140125350133 MPDATA,C,1,,715.727050707585 MPDATA,C,1,,716.313617973486 MPDATA,C,1,,716.899832050993 MPDATA,C,1,,717.485697759627 MPDATA,C,1,,718.071219836985 MPDATA,C,1,,718.656402940398 MPDATA,C,1,,719.241251648562 MPDATA,C,1,,719.825770463125 MPDATA,C,1,,720.409963810238 MPDATA,C,1,,720.993836042067 MPDATA,C,1,,721.577391438275 MPDATA,C,1,,722.160634207465 MPDATA,C,1,,722.743568488592 MPDATA,C,1,,723.32619835234 MPDATA,C,1,,723.908527802471 MPDATA,C,1,,724.490560777139 MPDATA,C,1,,725.072301150177 MPDATA,C,1,,725.653752732354 MPDATA,C,1,,726.234919272601 MPDATA,C,1,,726.815804459214 MPDATA,C,1,,727.396411921025 MPDATA,C,1,,727.976745228549 MPDATA,C,1,,728.556807895105 MPDATA,C,1,,729.136603377913 MPDATA,C,1,,729.716135079165 MPDATA,C,1,,730.295406347072 MPDATA,C,1,,733.187969722395 MPDATA,C,1,,736.074495187638 MPDATA,C,1,,738.955346294552 MPDATA,C,1,,741.830859638654 MPDATA,C,1,,744.7013472226 MPDATA,C,1,,747.567098581307 MPDATA,C,1,,750.428382695873 MPDATA,C,1,,753.285449719952 MPDATA,C,1,,755.568224076766
! Attribution des matériaux aux aires
AOVLAP, 5,4,3,2,1 ! Crée les aires en les « extrudant » les unes des autres - maillage
ASEL,S,AREA,,7 AATT,1,,1
ASEL,S,AREA,,8 AATT,1,,1 ASEL,S,AREA,,9 AATT,1,,1 ASEL,S,AREA,,10 AATT,1,,1 ASEL,S,AREA,,6 AATT,1,,1 ASEL,ALL
! Division des lignes en nombre d’éléments – maillage des différentes couches
LSEL,S,,,1 LSEL,A,,,4 LSEL,A,,,7 LSEL,A,,,10 LSEL,A,,,13 LESIZE, ALL,,,20 LSEL,S,,,16,23 LESIZE,ALL,,,10 LSEL,S,,,24,25 LESIZE,ALL,,,20 ! Maillage AMESH,ALL ! ****************************************************************************** ! Résolution ! ******************************************************************************
! Entrée dans le menu solution
/solu
! Préparation à la solution
NLGEOM,1 AUTOTS,1
ANTYPE,TRANS ! Calcul en régime transitoire (dépend du temps)
OUTRES,ALL,ALL ! Accessibilité des résultats à chaque incrément de temps
KBC,0 ! Application progressive du chargement thermique (rampe)
! Conditions aux limites et symétries
nsel,all ! On bloque la translation selon x sur l’axe de symétrie
LSEL,S, , ,16,25 NSLL,S,1 D,ALL, , , , , ,UX ALLSEL,ALL nsel,all
nsel,s,loc,x,0 ! Sélection de la ligne à x=0
nsel,r,loc,y,0 ! Sélection d'un point à y=0 dans le ligne
D,ALL, , , , , ,UY ! Le centre du cercle est bloqué aussi selon y
nsel,all
! Application de la température sur le contour – première phase
LSEL,S, , ,1 NSLL,S,1
Time, 35320 ! Durée de la montée en secondes – première phase
deltim, 30 ! Durée des incréments
! Première phase de la solution
solve
! Post-traitement des résultats
/POST1 ! Entrée dans General postproc
CSYS,2 ! Lecture des résultats en coordonnées sphériques
RSYS,2 /POST26 NUMVAR,200 FILLDATA,191,,,,1,1 REALVAR,191,191 !* NSOL,3,1,TEMP,,TEMP_3 STORE,MERGE XVAR,1 PLVAR,3, NSOL,4,159,TEMP,, TEMP_4 STORE,MERGE XVAR,1 PLVAR,3,4, FILLDATA,192,,,,0,0 FILLDATA,193,,,,1,0 FILLDATA,194,,,,-1,0 FILLDATA,195,,,,1,1 VARNAME,195,NSET NSOL,200,159,TEMP, NSOL,199,1,TEMP, PROD,197,199,194 ADD,5,200,197,,Gr ! STORE,MERGE XVAR,1 PLVAR,3,4,5, XVAR,1 PLVAR,5, NUMVAR,200 FILLDATA,191,,,,1,1 REALVAR,191,191
! Save time history variables to file Tempcentreexterieuretgradient.txt *CREATE,scratch,gui *DEL,_P26_EXPORT *DIM,_P26_EXPORT,TABLE,1274,4 VGET,_P26_EXPORT(1,0),1 VGET,_P26_EXPORT(1,1),3 VGET,_P26_EXPORT(1,2),4 VGET,_P26_EXPORT(1,3),5 /OUTPUT,'Tempcentreexterieuretgradient','txt','.' *VWRITE,'TIME','TEMP_3','TEMP_4','Gr' %14C %14C %14C %14C *VWRITE,_P26_EXPORT(1,0),_P26_EXPORT(1,1),_P26_EXPORT(1,2),_P26_EXPORT(1,3) %14.5G %14.5G %14.5G %14.5G /OUTPUT,TERM *END /INPUT,scratch,gui