HAL Id: hal-02996531
https://hal.archives-ouvertes.fr/hal-02996531
Submitted on 9 Nov 2020HAL is a multi-disciplinary open access archive for the deposit and dissemination of sci-entific research documents, whether they are pub-lished or not. The documents may come from teaching and research institutions in France or abroad, or from public or private research centers.
L’archive ouverte pluridisciplinaire HAL, est destinée au dépôt et à la diffusion de documents scientifiques de niveau recherche, publiés ou non, émanant des établissements d’enseignement et de recherche français ou étrangers, des laboratoires publics ou privés.
Charge-transfer driven by ultrafast spin-transition in a
CoFe Prussian blue analogue
Marco Cammarata, Serhane Zerdane, Lodovico Balducci, Giovanni Azzolina,
Sandra Mazerat, Cecile Exertier, Matilde Trabuco, Matteo Levantino,
Roberto Alonso-Mori, James Glownia, et al.
To cite this version:
Marco Cammarata, Serhane Zerdane, Lodovico Balducci, Giovanni Azzolina, Sandra Mazerat, et al.. Charge-transfer driven by ultrafast spin-transition in a CoFe Prussian blue analogue. Nature Chemistry, Nature Publishing Group, 2021, 13 (1), pp.10-14. �10.1038/s41557-020-00597-8�. �hal-02996531�
1
Charge-transfer driven by ultrafast spin-transition in a CoFe Prussian blue analogue
Marco Cammarata1,* Serhane Zerdane1, Lodovico Balducci1,Giovanni Azzolina1, Sandra Mazerat2,
Cecile Exertier3, Matilde Trabuco3, Matteo Levantino4, Roberto Alonso-Mori5, James M. Glownia5,
Sanghoon Song5, Laure Catala2, Talal Mallah2 , Samir F. Matar6,7, Eric Collet,1*
*Email: eric.collet@univ-rennes1.fr and marco.cammarata@univ-rennes1.fr
1Univ Rennes, CNRS, IPR (Institut de Physique de Rennes) - UMR 6251, F-35000 Rennes, France.
2 Institut de Chimie Moléculaire et des Matériaux d’Orsay, Université Paris-Sud, CNRS, Université
Paris-Saclay, 91405 Orsay cedex, France.
3 Department of Biochemical Sciences «A.R. Fanelli», Sapienza University of Rome, P.le A. Moro 5,
00185 Rome, Italy
4 ESRF - The European Synchrotron, 71 Avenue des Martyrs, 38000 Grenoble, France
5Linac Coherent Light Source, SLAC National Accelerator Laboratory, Menlo Park, CA-94025, USA.
6 ICMCB, CNRS UMR 5026, Université de Bordeaux, F-33600 Pessac, France.
2
Abstract:
Photoinduced charge-transfer is an important process in nature and technology and is responsible for the emergence of exotic functionalities, such as magnetic order for cyanide-bridged bimetallic coordination networks. Despite its broad interest and intensive developments in chemistry and material sciences, the atomic-scale description of the initial photoinduced process, which couples intermetallic charge-transfer and spin-transition, has been debated for decades; it was beyond reach due to its extreme speed. Here we study this process in a prototype cyanide-bridged CoFe system by femtosecond X-ray and optical absorption spectroscopies, enabling the disentanglement of ultrafast electronic and structural dynamics. Our results demonstrate that it is the spin-transition that occurs first on the Co site within 50 fs, and it is this that drives the subsequent Fe-to-Co charge-transfer within 200 fs. This study represents a step towards understanding and controlling charge-transfer-based functions using light.
3 Main text
Photoinduced charge transfer (CT) is one of the primary events associated with the emergence of functions in nature and technology, found in various systems from simple dyads to proteins. Reported
light-enabled functions are found to range from artificial solar energy conversion to photocatalysis 1,2
and to expand in materials towards magnetism 3-6, ferroelectricity 7 or conductivity 8. Among different
classes of multi-functional materials, cyanide-bridged bimetallic systems known as Prussian blue analogues (PBA) are very attractive, because the reversible CT between the constitutive transition
metal ions is responsible for the emergence of various physical properties3-5,9-11. CoFe PBA, with
chemical composition AxCoy[Fe(CN)6].nH2O (A=alkali) are coordination networks with a face centered
cubic (fcc) structure 4,9-11. The cyanide (CN-) groups bridge the Co and Fe ions in octahedral crystal
fields, splitting their 3d orbitals into t2g and eg sets. This gives rise to bistable electronic/structural
configurations shown in Figure 1a: CoIII(S=0)FeII(S=0) or CoII(S=3/2)FeIII(S=1/2). In the high spin CoIIFeIII
state, the population of the antibonding Co(eg) orbitals expands the Co-N bonds by 0.2 Å in
comparison to the low spin CoIII state. This spin transition (ST) on Co is the main structural reaction
coordinate QR, responsible for lattice expansion.
The original report of Fe-to-Co photoinduced CT by Sato et al. 3, forming a CoII(S=3/2)FeIII(S=1/2) state
with magnetic order at low temperature from the diamagnetic CoIII(S=0)FeII(S=0) state, motivated
many studies during the past two decades,9,12-14 for exploring the remarkable physicochemical
properties of PBA. With the long-term objective to build the next-generation devices based on functional molecules, several groups invested large efforts for developing new synthesis methods,
designing molecular analogues and isolating chemically the Co-N-C-Fe switchable unit.15,16 Similar
observations in various cyanide-bridged bimetallic systems, including MnFe ferromagnets4 or CoW
molecular-bridged assemblies,17 underlined the generalization of the photoinduced CT process.
Since the discovery of photomagnetism in PBA, the quest to understand and control the order of physical processes during the ultrafast photoreaction remained unanswered: does charge-transfer
4
induce spin-transition or vice versa? Very few ultrafast studies have been performed so far and their
time resolution18-20 provided a limited understanding of the CT or structural trapping dynamics. A
recent theoretical work21 discussed how the Co reaches the S = 3/2 state within 20 fs after
photoexciting a low spin CoIII ion by an Fe-to-Co charge transfer. However, another work based on
first-principles relativistic many-electron calculations22 attributed the absorption band around
540 nm, used for photo-transformation, not to the CT FeIIt
2g → CoIIIeg transitions (located at higher
energy region) but to d–d transitions within a given metallic ion. In other words, despite the continuously growing interest in PBA, the basic ultrafast mechanism behind photophysics is still not understood, which limits the development of these broad class of materials. More than twenty years ago, Verdaguer underlined already how "amazing are shortcomings of the oldest molecule-based
inorganic system, with still many things to learn from old systems, once we look at them anew". 23 This
lack of understanding motivated our study of using emerging ultrafast X-ray-based techniques24,25 for
obtaining new insights into the photoinduced CT dynamics in a prototype CoFe PBA, by probing the evolution of charge-transfer and of the structural degrees of freedom on the femtosecond (fs) time
scale. Our results reveal that the t2g→eg photoexcitation centred on the Cobalt triggers ultrafast
intersystem crossing that ultimately drives the Iron to Cobalt charge transfer.
Results
We studied CoIIIFeII nanocrystals [Cs
0.7Co(Fe(CN)6)0.9], transforming under light irradiation towards the
CoIIFeIII state, long-lived at low temperature26 and rapidly relaxing above 120 K27. More details about
the sample are given in supplementary information. X-ray Absorption Near-Edge Structure (XANES) is a relevant technique for studying photoinduced CT phenomena in PBA, because of the X-ray energy-weighted sensitivity to electronic and structural changes around the absorbing Fe and Co elements.
Bleuzen et al characterized the photoinduced CoIIIFeII to CoIIFeIII transformation on very similar
compounds,28 stabilized under pressure.13 At the Fe edge, they observed a ≈0.6 eV rigid spectral shift
5
At the Co edge, the opposite spectral shift towards lower energy, due to the CoIII→ CoII oxidation
change, occurs. In addition, the spin transition on the Co, which increases the Co-N distance due to
the occupancy of antibonding eg orbitals, shifts the first EXAFS feature around 7770 eV towards lower
energy in agreement with Natoli's rule.
For monitoring the photoinduced dynamics in real-time, we used the optical pump / XANES probe
technique with a time resolution X25 fs RMS (IRFFWHM= 58 fs) at the XPP instrument of the LCLS
X-ray free-electron laser 25,29,30. We acquired measurements from an optimized free-flowing jet of CoFe
nanocrystals in aqueous solution, excited by 540 nm optical pulses and probed by X-ray pulses. Details on the experimental setups are given in the Methods section. Figures 1b and 1c show the transient
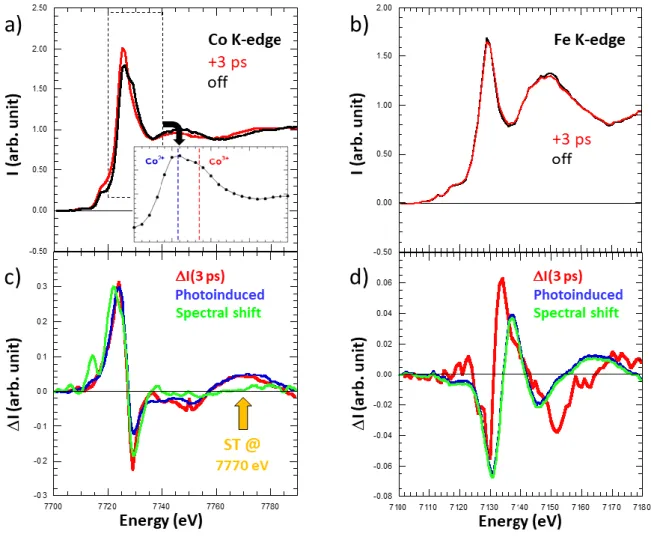
intensity changes of XANES, ΔI(3ps), recorded 3 ps after photo-excitation of the ground CoIIIFeII state.
The simultaneous absorption increase below and decrease above the Co K-edge (7727 eV), and the opposite changes at the Fe K-edge (7131 eV), are characteristic of the spectral shifts previously
reported,13,27 which constitute a direct proof that the Fe-to-Co CT already occurred 3 ps after
photoexcitation. Since there is almost no structural reorganization near the Fe, the XANES change at
the Fe edge is only due to CT (Supplementary Fig. 6) and corresponds to a 0.6 eV rigid spectral shift,13
mainly characterized by an increase of absorption above 7131 eV and a decrease of absorption below. At the Co edge, the photoinduced spectral change we observe is in very nice agreement with that
reported by Cafun13 for the photoinduced [CoIII(S=0)FeII(S=0)] to [CoII(S=3/2))FeIII(S=1/2)]
transformation (Supplementary Fig. 6c). The 2 eV spectral shift due to CT13 contributes to XANES
change below 7740 eV only. Above 7760 eV the XANES change is due to the shift of the first EXAFS feature towards lower energy due to the spin transition on the Co, which increases the Co-N distance in agreement with Natoli's rule. We observed a similar ultrafast shift of the first EXAFS feature during
the photoinduced spin transition in Fe(bpy)32+.25
For learning more about the ultrafast dynamics, we measured XANES changes after photoexcitation at X-ray energies, indicated by coloured lines in Figures 1b and 1c, where spectral changes after 3 ps
6
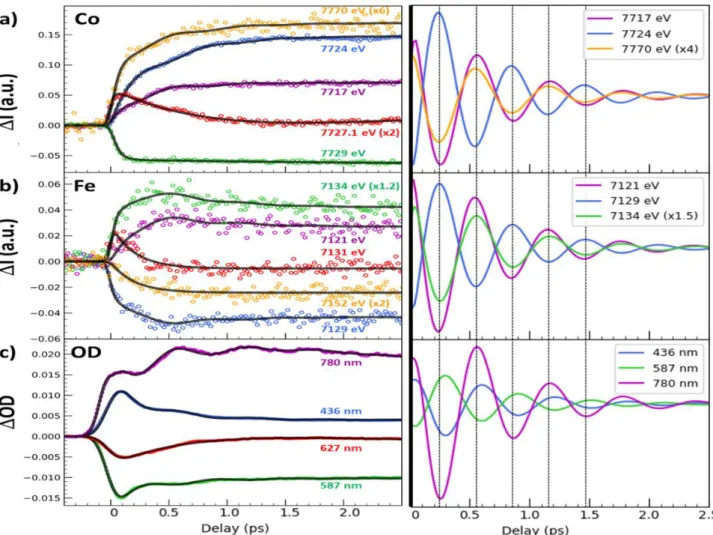
are strong, to increase the signal/noise ratio, or almost zero, to track intermediate states. The time-resolved data around Co (Figure 2a) and Fe (Figure 2b) K-edges indicate that the transformation occurs within a few 100s fs, with opposite absorption changes above and below both edges and opposite changes between the Fe and Co, characterizing the intermetallic CT. The dynamics do not correspond to simple exponential laws and weak damped oscillation components appear (Supplementary Fig. 8 & 9). The transient absorptions at 7727.1 eV and 7131 eV, corresponding to isosbestic points at Co and
Fe edges between CoIIIFeII and photoinduced CoIIFeIII states, highlight the presence of an intermediate
state (or several)s decaying within 200 fs. We performed a complementary optical pump-probe study
at the Institut de Physique de Rennes, with time resolution OD80 fs, exciting the same nanocrystals
with femtosecond pulses at 540 nm. Optical density changes (OD, Figure 2c) for different probe wavelengths have been recorded with high signal to noise. The global spectral change, with bleaching
of the 540 nm band and the appearance of new bands above and below, is characteristic of the CoIIIFeII
to CoIIFeIII transformation, as measured at low temperature and in agreement with TD-DFT calculations
(Supplementary Fig. 4 & 5). Optical data in Figure 2c reflect signals associated with a variety of processes evidenced by XANES, such as the transient state around the isosbestic point (627 nm) or the activation and damping of coherent oscillations with 1.65 THz frequency, more easily observed in OD change compared to XANES data, due to the higher signal/noise ratio (Supplementary Fig. 8 & 9).
Discussion
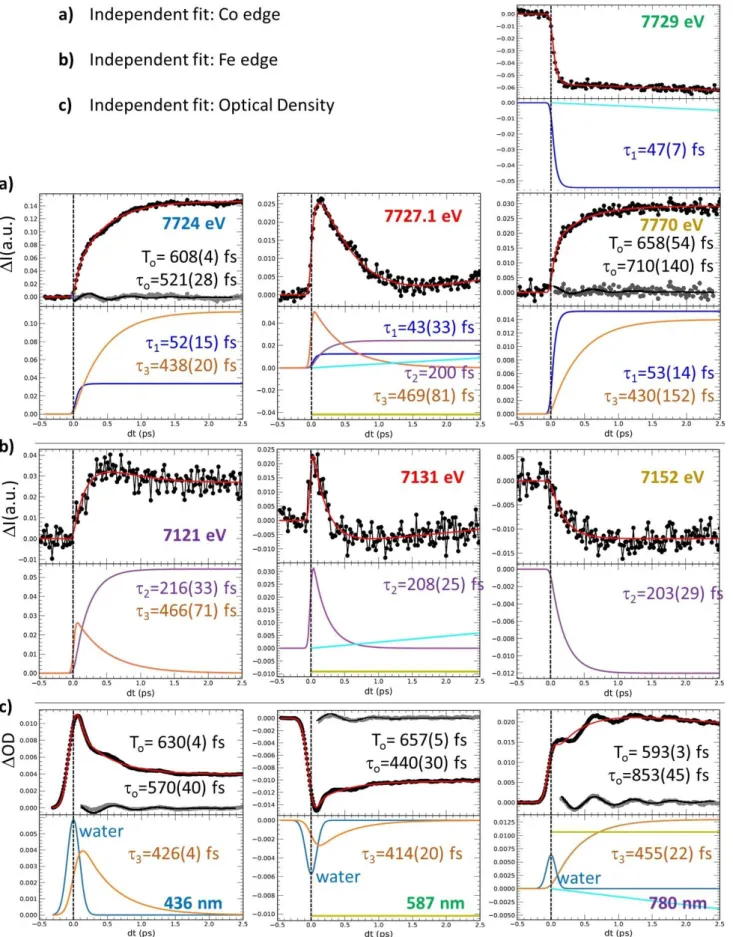
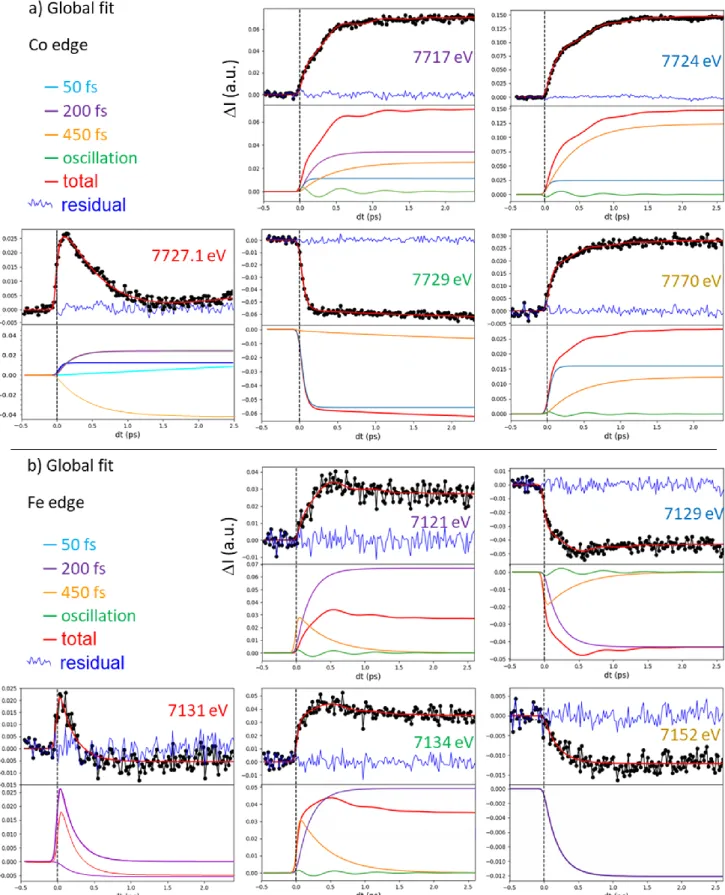
Considering the similar features in the XANES I and OD transients, we fit these globally with a phenomenological model including a minimum number of components ((Supplementary Fig. 7-10). A
fast exponential component (1=50(10) fs) is necessary to describe the XANES changes at the Co
K-edge, while 2=200(10) fs and 3=450(30) fs components must be used to describe slower dynamics at
both Co and Fe K-edges, especially at isosbestic points. An oscillating component is included for accounting the 1.65(2) THz vibration, with ≈600 fs damping constant. This simple global model is able to reproduce the main features of the XANES data around the Co (Figure 2a) and Fe (Figure 2b)
K-7
edges, as well as the OD data (Figure 2c). Black lines in Figure 2 correspond to the global fit of the entire dataset. The weight of each component for each signal shown in Supplementary Fig. 9 was refined and is given in Supplementary Table 1. An important result is that there is no fast component around the Fe K-edge (Supplementary Fig. 6, 8 & 9): the main component is the 200 fs timescale, which corresponds then to the CT timescale. The red Fe-K-edge trace in Fig. 2b monitors the signal close to the isosbestic point. It does not approach zero at large delay because 7131 eV does not correspond exactly to the isosbestic point. However, this time trace shown in Supplementary Fig. 8b & 9b exhibits
a single dynamics (2=200 fs), easily decomposed into two components: an exponential decay due to
the intermediate (INT) state(s) and an exponential increase due to the formation of the CoIIFeIII state.
On the contrary, away from the Co edge (such as at 7770 eV), XANES is not sensitive to the spectral shift due to CT, but only to the structural changes accompanying the ST, responsible for the shift of the first EXAFS feature, and occurring within ≈50 fs (Supplementary Figs. 6c, 8a, 9a). The weak but significant oscillating component, observed in Fe, Co or OD data corresponds to a maximum amplitude around time delay dt=0, characteristic of the displacive nature of the structural reorganization
(Supplementary Fig. 10), as it is the case during LIESST 25,31. Supplementary Fig. 9 shows the different
components in signals and underlines the fast 50 fs dynamics at the Co edge and the main 200 fs dynamics at the Fe edge.
In order to provide further support to the assignment of the optical transitions, we carried out
time-dependent DFT computations32 on a monomeric (CN-)
5-Fe-C-N-Co-(NC-)5 cluster (see Figures 3b and
Supplementary Fig. 5), as also performed by Johansson on VCr PBA.20 The results indicate that the
transitions in the 530-580 nm range correspond to CoIII d-d transitions, with a hole mainly of Co(t
2g
)-like nature and a particle mainly of Co(eg)-like nature with some weight on the CN groups, but it does
not involve the Fe centre. The transitions around 390 nm correspond to intermetallic CT from Fe to Co sites. Both the d-d nature of transitions around 540 nm and the CT nature of transitions at higher
8
These calculations and our TD-DFT analysis, both performed in a regular lattice, do not take into account the effect of phonons, which break the symmetry and enhance the transitions. In addition, DFT calculations reveal vibration modes around 1.62 THz, corresponding to a global torsion of the
network, CoN6 and FeC6 cores and Fe-C-N-Co bridge (videos 1-4). Such torsion modes also correspond
to the mode measured around 1.5 THz by Ohkoshi on similar Mn-N-C-Fe PBA and also identified as a
torsion mode of the lattice.33
Both theoretical calculations and experimental results indicate that the very first step involves changes around the Co site only (see also Supplementary Figs. 5 & 7) and the process thus resembles to the
light-induced excited spin-state trapping process (LIESST) in isoelectronic FeII systems. The fast
intermediate spin transition process on the Co can be described as involving the photoexcited
CoIII*(S=0)FeII(S=0), the CoIII(S=1)FeII(S=0) state possibly, and the CoIII(S=2)FeII(S=0) states. We
characterized these states by DFT calculations for both the monomeric (CN-)
5-Co-N-C-Fe-(CN-)5 and for
the Co-(NC-)
6 clusters (Supplementary Fig. 2-3). The ST on the Co is responsible for the elongation of
the Co-N bond and the fast changes around the Co edge. In addition to the main electronic states shown in Fig. 3, additional electronic states may be involved. However, it was shown that during LIESST these intermediate states act as mediators and that it is difficult to disentangle electronic and
structural degrees of freedom.25,31 The photoexcitation of the CoIII(S=0) generates an excited
CoIII*(S=0) state that may decay in the CoIII*(S=1) state. For both CoIII* states, the population of the Co
antibonding eg states drives the Co-N bond expansion (breathing mode) which reduces the t2g-eg gap
and drives the spin transition towards CoIII(S=2). This initial bond elongation due to spin transition on
the Co occurs within ≃50 fs, which is consistent with the ½ period of the breathing mode of the Co-N6
octahedron found by DFT (video 5). Both the timescale and the nature of the process of this spin
transition are similar to the light-induced excited spin state trapping process (LIESST), reported for FeII
9
This bond elongation due to spin transition occurs within 50 fs and drives charge transfer
(Supplementary Fig. 2-3), as shown by theoretical calculations.35 This CT towards the
CoIII(S=3/2)FeII(S=1/2) state is responsible for the consecutive elongation of the Co-N bond monitored
at 7770 eV and equilibrating within 450 fs. The formation and decay of the intermediate(s), involving changes around the CN groups (Supplementary 2, 3 & 5), contribute to the fast signal change (within the time resolution) and decay (200 fs) around the isosbestic point at the Fe edge (7129, 7131 and 7134 eV). On the contrary, there is no fast component for the other probe energies, especially at the
Fe pre-edge, sensitive to the population of the Fe t2g or eg states and which monitors independently
the CT dynamics within 200 fs.
Another possible mechanism could be the simultaneous CT and ST from the excited CoIII(t
2g5eg1
)-FeII(t
2g6eg0) state (green in Fig. 3) towards the CoII(t2g5eg2)-FeIII(t2g5eg0) state (red). The experimental
data make it possible to exclude such a process, requiring spectral shifts (associated with CT) preceding or simultaneous to EXAFS shift at 7770 eV (associated with spin transition) inconsistent with our
observations. In addition, a CT from Fe t2g to Co eg orbital is not expected to be fast due to the different
symmetry of the orbitals. Finally, initial MLCT states involving CoIV or FeIII states can also be excluded
since there is no XANES signature related to the expected instantaneous spectral shift, as characterized
during LIESST in Fe(bpy)32+ by transient peaks at different probing energies 25.
Our experimental results, thus provide direct insight into the photoinduced electronic and structural dynamics, with an overall picture of the photoinduced process schematically represented in Figure 3. The schematic representation of the potential energy curves is based on our DFT calculations
(Supplementary Fig. 2, 3 & 5) providing equilibrium Co-N bonds and t2g-Co(eg) gap. The ST, tracked
through the Co-N bond elongation, occurs within 50 fs and is accompanied by coherent structural oscillations. Indeed, the crystalline network has no time to expand on this timescale and a torsion of the lattice is needed to accommodate the ST, as schematically shown in Figure 3c. This structural reorganization activates in a displacive way the 1.65 THz lattice torsion mode, which break local
10
octahedral symmetry and modulates optical and X-ray absorptions. This oscillation is damped within 600 fs by the energy transfer towards others degrees of freedom as well as by the relaxation towards a more regular structure, as lattice expansion starts to accommodate the local volume change around the Co site. However, after 3 ps some local torsions should remain within the crystal lattice, as the expansion timescale required to accommodate the Co-N bond elongation is limited to ≃6 ps, given by the ratio between the sample size (11 nm) and the speed of sound (≃2000 m/s) at which elastic deformation waves propagate. It is therefore likely that the crystal structure is not fully equilibrated after 3 ps, which may explain why the Fe XANES change is not exactly a spectral shift (Supplementary Fig. 6d).
The element-specific XANES data, sensitive to the oxidation state or structural reorganization, also allows for monitoring at the Fe K-edge the CT dynamics within 200 fs, as only CT contributes to
spectral shift. This CT is fast because the t2g symmetry of both Fe to Co orbitals allows for an efficient
coupling between the CoIII(S=2)FeII(S=0) and the CoII(S=3/2)FeIII(S=1/2) states. However, CT occurs only
in a second step, well after the ST. It was shown by Kawamoto35 that the Co-N bond expansion
stabilizes the CoIIFeIII state, as it decreases the t
2g-Co(eg) energy gap. Our DFT calculations
(Supplementary Figs. 2 & 3) give similar results: the average Co-N bond expands from 1.99 Å in the
CoIII(S=0) state, 2.04 Å in the CoIII(S=1) state, to 2.06 Å in the CoIII(S=2) state due to the ST on the Co,
which decreases the t2g->Co(eg) gap from ≃2.0 to ≃1.2 eV (Fig. 3). Since the Co-N elongation due to
ST is found to take place before the CT, we conclude that it is the ultrafast ST on the Co site that drives the CT process.
Conclusions
By leveraging element-specific probing offered by hard X-ray together with high time resolution provided by the femtosecond pulse duration at X-ray Free Electron Lasers, the photoinduced electronic and structural dynamics around the metallic centres can be addressed to obtain novel understanding. The results shown in this article provide clear answer to a question debated for
11
decades, by demonstrating that in the photoexcited prototype CoFe PBA, the spin-transition on the Co occurs first and that the associated structural reorganizations drive the charge-transfer in a second step. Our study shows the large potential of ultra-fast X-ray science for monitoring and disentangling structural and electronic dynamics, which is of prime interest for the fundamental understanding of a multitude of CT-based phenomena in chemistry, biology or physics and more especially in the expanding family of photomagnetic materials with CT-based functions.
References
1 McCusker, J. K. Electronic structure in the transition metal block and its implications for light harvesting. Science 363, 484-488 (2019).
2 Canton, S. E. et al. Visualizing the non-equilibrium dynamics of photoinduced intramolecular electron transfer with femtosecond X-ray pulses. Nature Communications 6, 6359 (2015).
3 Sato, O., Iyoda, T., Fujishima, A. & Hashimoto, K. Photoinduced Magnetization of a Cobalt-Iron Cyanide. Science 272, 704-705 (1996).
4 Ohkoshi, S. & Tokoro, H. Photomagnetism in Cyano-Bridged Bimetal Assemblies. Accounts of Chemical Research 45, 1749-1758 (2012).
5 Ferlay, S., Mallah, T., Ouahes, R., Veillet, P. & Verdaguer, M. A Room-Temperature Organometallic Magnet Based on Prussian Blue. Nature 378, 701-703 (1995).
6 Liedy, F. et al. Vibrational coherences in manganese single-molecule magnets after ultrafast photoexcitation. Nature Chemistry, doi:10.1038/s41557-020-0431-6 (2020).
7 Collet, E. et al. Laser-induced ferroelectric structural order in an organic charge-transfer crystal. Science 300, 612-615 (2003).
8 Chollet, M. et al. Gigantic Photoresponse in ¼-Filled-Band Organic Salt (EDO-TTF)2PF6. Science 307, 86-89 (2005).
9 Cartier dit Moulin, C. et al. Photoinduced Ferrimagnetic Systems in Prussian Blue Analogues CIxCo4[Fe(CN)6]y (CI = Alkali Cation). 2. X-ray Absorption Spectroscopy of the Metastable State. Journal of the American Chemical Society 122, 6653-6658 (2000).
10 Risset, O. N. et al. Light-Induced Changes in Magnetism in a Coordination Polymer Heterostructure Rb0.24Co[Fe(CN)6]0.74@K0.10Co[Cr(CN)6]0.70·nH2O and the Role of the Shell Thickness on the Properties of Both Core and Shell. Journal of the American Chemical Society 136, 15660-15669 (2014). 11 Aguila, D., Prado, Y., Koumousi, E. S., Mathoniere, C. & Clerac, R. Switchable Fe/Co Prussian blue
networks and molecular analogues. Chemical Society Reviews 45, 203-224 (2016).
12 Shimamoto, N., Ohkoshi, S., Sato, O. & Hashimoto, K. Control of Charge-Transfer-Induced Spin Transition Temperature on Cobalt−Iron Prussian Blue Analogues. Inorganic Chemistry 41, 678-684 (2002).
13 Cafun, J. D. et al. Room-temperature photoinduced electron transfer in a Prussian blue analogue under hydrostatic pressure. Angew Chem Int Ed Engl 51, 9146-9148 (2012).
14 Verdaguer, M. et al. Molecules to build solids: high TC molecule-based magnets by design and recent revival of cyano complexes chemistry. Coordination Chemistry Reviews 190–192, 1023-1047 (1999). 15 Koumousi, E. S. et al. Metal-to-Metal Electron Transfer in Co/Fe Prussian Blue Molecular Analogues:
The Ultimate Miniaturization. Journal of the American Chemical Society 136, 15461-15464 (2014). 16 Mercurol, J. et al. [FeIILSCoIIILS]2 [Leftrightarrow] [FeIIILSCoIIHS]2 photoinduced conversion in a
cyanide-bridged heterobimetallic molecular square. Chem Commun 46, 8995-8997 (2010). 17 Miyamoto, Y. et al. Photo-induced magnetization and first-principles calculations of a
12
18 Asahara, A. et al. Ultrafast dynamics of reversible photoinduced phase transitions in rubidium
manganese hexacyanoferrate investigated by midinfrared CN vibration spectroscopy. Physical Review B 86 (2012).
19 Moritomo, Y. et al. Photoinduced Phase Transition into a Hidden Phase in Cobalt Hexacyanoferrate as Investigated by Time-Resolved X-ray Absorption Fine Structure. Journal of the Physical Society of Japan 82, 033601 (2013).
20 Johansson, J. O. et al. Directly probing spin dynamics in a molecular magnet with femtosecond time-resolution. Chem Sci 7, 7061-7067 (2016).
21 van Veenendaal, M. Ultrafast intersystem crossings in Fe-Co Prussian blue analogues. Sci Rep 7, 6672 (2017).
22 Watanabe, S. et al. Intra- and inter-atomic optical transitions of Fe, Co, and Ni ferrocyanides studied using first-principles many-electron calculations. Journal of Applied Physics 119, 235102 (2016). 23 Verdaguer, M. Molecular Electronics Emerges from Molecular Magnetism. Science 272, 698-699
(1996).
24 Chergui, M. & Collet, E. Photoinduced structural dynamics of molecular systems mapped by time-resolved x-ray methods. Chemical Reviews 117, 11025–11065 (2017).
25 Lemke, H. T. et al. Coherent structural trapping through wave packet dispersion during photoinduced spin state switching. Nat. Commun. 8, 15342 (2017).
26 Trinh, L. et al. Photoswitchable 11 nm CsCoFe Prussian Blue Analogue Nanocrystals with High Relaxation Temperature. Inorganic Chemistry 59, 13153-13161, doi:10.1021/acs.inorgchem.0c01432 (2020).
27 Zerdane, S. et al. Probing Transient Photoinduced Charge Transfer in Prussian Blue Analogues with Time-Resolved XANES and Optical Spectroscopy. Eur J Inorg Chem 2018, 272-277 (2018).
28 Bordage, A. & Bleuzen, A. Influence of the number of alkali cation on the photo-induced
CoIIIFeII↔CoIIFeIII charge transfer in Csx CoFe PBAs – A Co K-edge XANES study. Radiat Phys Chem 175, 108143 (2020).
29 Chollet, M. et al. The X-ray Pump-Probe instrument at the Linac Coherent Light Source. Journal of Synchrotron Radiation 22, 503-507 (2015).
30 Harmand, M. et al. Achieving few-femtosecond time-sorting at hard X-ray free-electron lasers. Nature Photonics 7, 215-218 (2013).
31 Zerdane, S. et al. Comparison of structural dynamics and coherence of d–d and MLCT light-induced spin state trapping. Chem. Sci. 8, 4978-4986, doi:10.1039/c6sc05624e (2017).
32 Frisch, M. J. e. a. Gaussian, Inc., Wallingford CT (2016).
33 Ohkoshi, S. I. et al. Cesium ion detection by terahertz light. Sci Rep 7, 8088 (2017).
34 Zerdane, S., Cammarata, M., Iasco, O., Boillot, M. L. & Collet, E. Photoselective MLCT to d-d pathways for light-induced excited spin state trapping. The Journal of chemical physics 151, 171101 (2019). 35 Kawamoto, T. & Abe, S. Mechanism of reversible photo-induced magnetization in prussian blue
analogues. Phase Transitions 74, 209-233 (2006).
Acknowledgements
Funding: E.C and M.C. acknowledge the support of Rennes Métropole, ANR (ANR-13-BS04-0002
FEMTOMAT and ANR-15-CE32-0004 Bio-XFEL), Centre National de la Recherche Scientifique (CNRS, PEPS SASLELX), Fonds Européen de Développement Régional (FEDER) and Région Bretagne (ARED 8925/XFELMAT). M.C., L.B., M.L., C.E., M.T acknowledge the support of European Union Horizon2020
13
under the Marie Sklodowska-Curie Project “X-Probe” Grant No. 637295. The authors would like to thank A. Bleuzen for sharing published XANES data used in Supplementary Fig. 7. Use of the Linac Coherent Light Source (LCLS), SLAC National Accelerator Laboratory, is supported by the U.S. Department of Energy, Office of Science, Office of Basic Energy Sciences under Contract No. DE-AC02-76SF00515.
Author Contributions
E.C. and M.Ca. conceived the project. S.M., L.C. and T.M. synthesized and characterized the CoFe sample. M.Ca., S.Z., L.B., G.A., C.E., M.T., M.L., J.R.A.M., M.G., D.Z. and E.C. performed the femtosecond XAS experiment. S.Z. and G.A. performed the optical study. S.Z., M.Ca and E.C. analyzed the data. S.F.M. performed the DFT and TD-DFT calculations. E.C. and M.Ca set the physical picture for interpreting the data. E.C. and M.Ca wrote the paper. All authors contributed to discussions and gave comments on the manuscript.
14
Figure 1 | CoFe PBA and X-ray absorption fingerprints of the transformation. (a) The
cyanide-bridged coordination network with a schematic representation of the CoIII(S=0)FeII(S=0) and
CoII(S=3/2)FeIII(S=1/2) states, where the charge transfer is accompanied by a spin transition on the Co.
The bleu arrows indicate that upon filling up of the eg orbitals the Co-N distance increases (QR mode),
which closes the Fe(t2g)-Co(eg) gap as indicated by the coloured arrow. (b,c) XANES spectral changes
observed at the Co and Fe K-edges 3 ps after photoexcitation at 540 nm of CoFe nanocrystals and measured using femtosecond X-ray pulses at LCLS free-electron laser. The coloured lines of panels b and c indicate X-ray energies for which high time resolution data have been measured. The data shown in figure 2a and 2b use the same colour code.
15
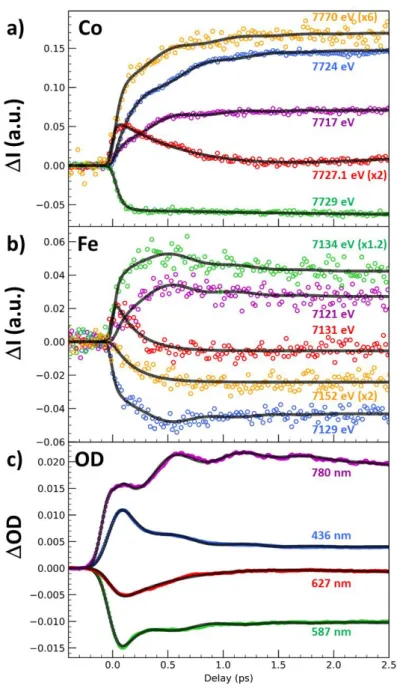
Figure 2 | Disentangling spin transition and charge-transfer dynamics in real-time. (A) Time scans
after photoexcitation at 540 nm of the X-ray absorption intensity change (I) at selected energies around the Co (a) and around the Fe K-edges (b) and of the optical density change (OD) at different probing wavelengths (c). The data reveal a 50 fs component attributed to ST (mainly at Co edge), a 200 fs component attributed to CT (seen at both the Fe and Co K-edges), a 450 fs component attributed to vibrational cooling and a coherent oscillation (at 1.65 THz) damped with a 600 fs timescale. Black lines correspond to the global fit of the entire dataset with the same physical parameters and time constant mentioned above and only the amplitudes of each component have been refined (Supplementary Table 1). Colour code of panels (a) and (b) matches the figures 1b and 1c.
16
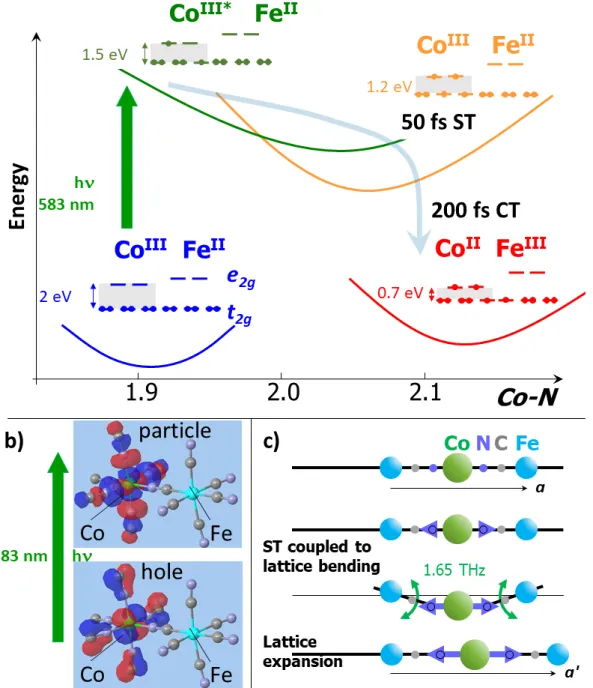
Figure 3 | Spin-transition inducing charge-transfer. (a) Schematic representation of the PES of
different key states involved in the process. The optical excitation of the ground CoIIIFeII state (blue)
leads to an electronically excited CoIII*FeII state (green) by promoting one electron from the Co(t
2g) to
the Co(eg) orbital, as obtained from TD-DFT calculations (b). The population of the antibonding eg
orbitals elongates Co-N bonds, driving so the spin transition (ST) within 50 fs on the Co towards the
CoIII(S=2)FeII(S=0) state (orange), which closes the FeII(t
2g) - CoIII(eg) gap (grey background). The
consecutive CT results from the electronic decay within 200 fs between the Fe(t2g) to the Co(t2g)
orbitals, leading to the CoII(S=3/2)FeIII(S=1/2) state. (c) As the Co-N bonds elongate during the ST, the
lattice has to distort to accommodate the local structural change, activating so the lattice torsion mode at 1.65 THz, which is damped by the following expansion of the lattice parameter from a to a'.
17 Methods
CoFe nanoparticles
We used a colloidal solution of CsCoFe Prussian blue analogue nanoparticles (11±1.5 nm) of formula
[Cs0.7Co(Fe(CN)6)0.9]n-, mainly made of active and vacancy-free CsCoIIIFeII species, and recovered as a
solid sample by cethyltrimethyl ammonium (CTA+) (supplementary information). Our previous XANES
study with 100 ps time resolution 27 has shown that these particles are stables in water and that the
lifetime of the photoinduced CoIIFeIII state is shorter than 1 ms at room temperature. The particles
were fully characterized in ref26.
Femtosecond optical pump / XANES probe.
The time resolved X-ray absorption signal of CoFe nanoparticles was measured using the pump/probe
technique through total fluorescence, by using the same method as presented in ref 25. We used a
silicon (111) double crystal monochromator available at the X-ray Pump Probe instrument of the LCLS. CoFe nanocrystals dispersed in water circulated via a closed loop system through a 30 µm diameter liquid Rayleigh jet, to mitigate any laser or X-ray induced damage. The sample was excited by 540 nm pulses from a Ti:sapphire laser system and an Optical Parametric Amplifier (OPerA Solo, Coherent).
The relative X-ray to optical pulses arrival time was recorded using the timing tool diagnostic 30. The
X-ray beam was focused by two appropriate sets of Be lenses (one for each K-edge). The chromatic effects of the lenses are negligible over the tens of eV scan range for the moderate chosen focal spot size of 10-20 µm. The ~30 eV wide radiation central wavelength produced by the machine was adjusted using the so-called “Vernier” to be synchronized with the monochromator. The pump laser
was focus to 140 x 220 µm2. The excitation energy was set to 25 µJ resulting in fluence of 0.8 mJ/mm2,
below the observed onset of nonlinear signal response at 1.5mJ/mm2. The overall time resolution was
18 Femtosecond optical pump / optical probe spectroscopy.
We used an optical pump-probe method to probe the photoinduced dynamics in CoFe nanocrystals dispersed in solution. We set the wavelength of the pump laser pulse to 540 nm and we measured the time-resolved optical density (OD) change at various probing wavelengths. We configured the femtosecond optical pump-probe experiments in transmission geometry with a quasi-collinear configuration of pump and probe beams, which allowed reaching a time resolution of 80 fs RMS. We performed pump-probe measurements in a stroboscopic way by pumping the sample with at 500 Hz repetition rate and probing the OD change at 1 kHz.
DFT and TD-DFT calculations.
For understanding the optical spectral changes and the transitions involved in the process, we used
time-dependent DFT (TD-DFT) computations for (CN)5-Fe-C-N-Co-(NC)5 cluster and Co(NC)6 clusters.
We performed calculations in both CoIII(S=0)FeII(S=0) or CoII(S=3/2)FeIII(S=1/2) states, starting from
geometry optimized molecule with UB3LYP/6-31g(d,p) functional-basis set (i.e. an unrestricted hybrid functional accounting for paramagnetic configurations couples with an all-electron basis set preferred to limited valence one as LANL2DZ). Preliminary to these calculations, geometry optimizations
followed by deriving the vibration frequencies were carried out, with Gaussian 09 code 32. Frequencies
are determined from the second derivatives of the energy with respect to the atomic positions and then operating transformation to mass-weighted coordinates. TD-DFT, as implemented in the Gaussian 09 code, package was applied for calculating oscillator strength and obtaining the "natural transition orbitals" (NTO) through an account for hole–particle pairs, which are then used to interpret the initial photo-excitation process. In order to account for the spin transition on the Co, while keeping Fe in S=0, and the CT processes, both stabilized by molecular deformations around the Co, we model
the Co(NC)6 cluster with specific oxidation states. Divalent and trivalent Cobalt hexacyanide charged
19
by 6 (NC)─. The quantum chemical calculations were carried out similarly to dinuclear PBA FeCo using
G09 program (license University of Bordeaux) with restricted B3LYP hybrid functional for S=0 state and UB3LYP unrestricted hybrid functional for all other configurations; the choice of the basis set was 3-21g; tests with higher basis sets as 6-31g did not change the results. After full geometry optimizations,
the 6 Co-N bonds are equivalent for the state Co3+(S=0) in O
h field, while for the other states different
Co-N distances were identified in relation with the splitting of the orbitals in the D4h field. Results are
presented in supplementary information.
Data availability
1
Supplementary Information
Charge-transfer driven by ultrafast spin-transition in a CoFe Prussian blue analogue
Marco Cammarata1,* Serhane Zerdane1, Lodovico Balducci1, Giovanni Azzolina1, Sandra Mazerat2, CecileExertier3, Matilde Trabuco3, Matteo Levantino4, Roberto Alonso-Mori5, James M. Glownia5, Sanghoon Song5,
Laure Catala2, Talal Mallah2 , Samir F. Matar6,7, Eric Collet,1*
*Correspondence to: eric.collet@univ-rennes1.fr and marco.cammarata@univ-rennes1.fr
1Univ Rennes, CNRS, IPR (Institut de Physique de Rennes) - UMR 6251, F-35000 Rennes, France.
2 Institut de Chimie Moléculaire et des Matériaux d’Orsay, Université Paris-Sud, CNRS, Université Paris-Saclay,
91405 Orsay cedex, France.
3 Department of Biochemical Sciences «A.R. Fanelli», Sapienza University of Rome, P.le A. Moro 5, 00185 Rome,
Italy
4 ESRF - The European Synchrotron, 71 Avenue des Martyrs, 38000 Grenoble, France
5Linac Coherent Light Source, SLAC National Accelerator Laboratory, Menlo Park, CA-94025, USA. 6 ICMCB, CNRS UMR 5026, Université de Bordeaux, F-33600 Pessac, France.
7Lebanese German University (LGU), Sahel Alma Campus, PO Box 206, Jounieh, Lebanon
List of Supplementary Materials: Video 1-4 Torsion modes.
Video 5 breathing mode.
Fig. 1. Size of the nanoparticles and X-ray diffraction pattern. Fig. 2. DFT for the (CN)5-Co-N-C-Fe-(CN)5 cluster.
Fig. 3. DFT for the Co(NC)6 cluster.
Fig. 4 Calculated oscillator strength (left) and measured OD change after photoexcitation at 10 K (right). Fig. 5. Natural transition orbitals (NTO) of the CoIIIFeII state.
Fig. 6. XANES spectral changes. Fig. 7. XANES IRFX.
Fig. 8. Independent fits.
Table 1 and Fig. 9. Global fit of the dynamics. Fig. 10. Oscillating component in the fit of the data.
2 CoFe nanoparticles
A colloidal solution of CsCoFe Prussian blue analogue nanoparticles was prepared by adding an aqueous solution of K3[FeIII(CN)6] (50 ml, 10-3 mol) to 50 ml of an aqueous solution containing [CoII(H2O)6]Cl2 (10-3 mol)
and CsCl (2x10⁻³ mol). The sample was characterized by various complementary techniques including
transmission electron microscopy, XPS, magnetism, optical spectroscopy, X-ray diffraction and photocrystallography as well as EPR spectroscopy (ref 26). Energy Dispersive X-ray Spectroscopy (EDS) was performed on the particles recovered as a solid sample by cethyltrimethyl ammonium (CTA+) that allows
reconstructing their average formula as [Cs0.7Co(Fe(CN)6)0.9]n-. Infrared spectroscopy is consistent with the
presence of a very small amount of passive FeIIICoIIFeII species assumed to be located at the nanocrystals’ surface
while the core is mainly made of the active and vacancy-free CsCoIIIFeII. The analysis revealed a majority (≈70%)
of low spin and photoactive diamagnetic CoIIIFeII pairs occupying the core of the nanocrystals and a mixture of
CoIIFeII and CoIIFeIII species (see also Fig. 7). Energy Dispersive X-ray spectroscopy allowed us to determine the
following chemical formula: (CTA)0.4[Cs0.7Co{Fe(CN)6}0.9]•H2O. After light excitation, the change of magnetic
susceptibility and lattice parameters probed by X-ray diffraction confirm the photoinduced transformation of CoIIIFeII species to the CoIIFeIII state. Our previous XANES study with 100 ps time resolution (25) has shown that
the particles are stable in water and that the lifetime of the photoinduced CoIIFeIII state is shorter than 1 ms at
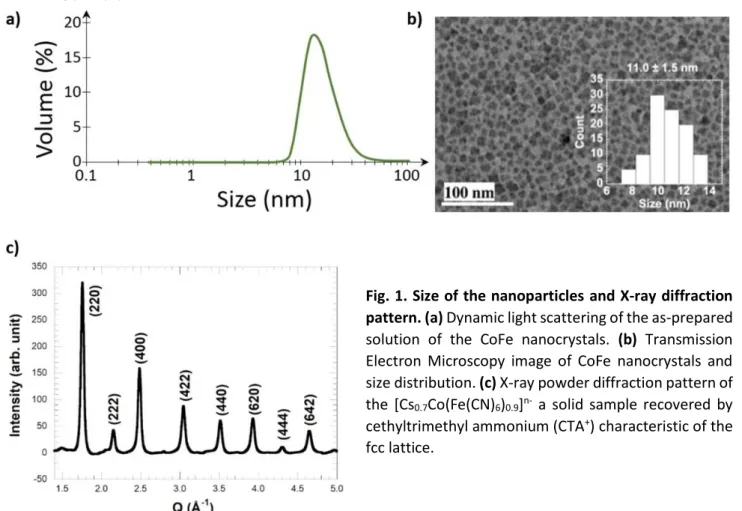
room temperature, allowing to perform pump-probe studies. Dynamic light scattering of the as-obtained solution shows the presence of objects in 10-12 nm hydrodynamic size (Fig. 1a). Transmission electronic microscopy confirmed the size of the crystals to 11±1.5 nm as depicted in Fig. 1b.
The XRD pattern (Fig. 1c) of the CoFe sample shows the good crystalline quality of the nanoparticles and is characteristic of the FCC lattice. The cell parameter is a=10.03±0.05 Å, which is close to the one of the pure CsCoIIIFeII network with a=9.96 Å. This confirms that the sample is made of a majority of CoIIIFeII species and we
estimate a 28% contribution from the CoIIFeIII and CoIIFeII species, and 72% of the diamagnetic CoIIIFeII network.
Our previous XANES study with 100 ps time resolution (27) has shown that the particles are stables in water and that the lifetime of the photoinduced CoIIFeIII state is shorter than 1 ms at room temperature, allowing for
performing pump-probe studies.
Fig. 1. Size of the nanoparticles and X-ray diffraction pattern. (a) Dynamic light scattering of the as-prepared solution of the CoFe nanocrystals. (b) Transmission Electron Microscopy image of CoFe nanocrystals and size distribution. (c) X-ray powder diffraction pattern of the [Cs0.7Co(Fe(CN)6)0.9]n- a solid sample recovered by
cethyltrimethyl ammonium (CTA+) characteristic of the
3 DFT and TD-DFT calculations.
We performed DFT and TDDFT calculations with Gaussian 09. The calculations go through two main steps. The first step is to geometry optimize the molecule. Then the second step consists of calculating the force constants (k) through selective displacements of the molecule as stretching, torsion or other types of modes. There are (3N-6) modes in nonlinear molecules, N being the number of atoms. The resulting force constants kN
and the reduced mass provide the frequencies of the vibration modes. We performed such DFT calculations on a monomeric (CN-)
5-Co-N-C-Fe-(CN-)5 cluster for both the CoIII(S=0)FeII(S=0) state and the CoII(S=3/2)FeIII(S=1/2)
state (Fig. 2). The molecular geometry changes between both states with the characteristic elongation of the Co-N bonds from 1.93 Å for the CoIII(S=0)FeII(S=0) state to 2.12 Å for the CoII(S=3/2)FeIII(S=1/2) state. We
performed a similar calculation in the Co2Fe2 square cluster in the LS state. All these calculations show similar
torsion modes of the Co-N-C-Fe bridge at around 1.6 THz in each state.
Video 1 & 2 show torsion modes of the CoII(S=3/2)FeIII(S=1/2) state at 1.44and 1.62 THz
Video 3 shows the torsion mode of the CoIII(S=0)FeII(S=0) state at 1.85 THz
Video 4 shows the torsion mode of the Co2IIIFe2II state at 1.56 THz
Such a torsion mode also corresponds to the mode measured around 1.5 THz by Ohkoshi on similar Mn-N-C-Fe PBA (ref 33) and also identified as involving a torsion of the lattice and especially the cyano bridge.
Video 5 shows the Co-N breathing mode around 11.2 THz (90 fs period) for the CoII(S=3/2)FeIII(S=1/2)
state. The spin-transition timescale is limited by the elongation time of the Co-N bonds from the CoIII(S=0) to CoII(S=2) potentials, which is of the order of the ½ period of the breathing mode of the CoN
6
octahedron, i.e. 45 fs.
We also performed time dependent DFT calculation, equally based on the DFT with the major difference of replacing the Hohenberg-Kohn first theorem by time-dependent Runge-Gross theorem introducing time– dependence. The G09 program starts from previously obtained geometry minimum ground state energy and operates vertical excitation calculations (without structural rearrangement) with single-point TD-DFT of the absorption energy: initial state, excited states, from the lowest to the highest. This will be used to identify which excited states are of interest. That’s how we get the (absorption) UV-VIS spectrum and the NTO (Natural Transition Orbitals) with the ”hole electron” schematics excited states transition.
In order to provide additional information, we used Gaussian to calculate different electronic states with different spin multiplicities. In addition to the ground CoIII(S=0)FeII(S=0) state and the photoinduced state
CoII(S=3/2)FeII(S=1/2), we calculated the excited CoIII*(S=1)FeII(S=0) state, which has the same Co t
2g5 - Co eg1
electronic distribution as the initially excited CoIII*(S=0)FeII(S=0) state and therefore both CoIII* excited states
have similar structure and energy. However, the CoIII*(S=0)FeII(S=0) state is not accessible with Gaussian as the
stable state S=0 is the ground CoIII(S=0)FeII(S=0) state. We used the same 3-21g basis set, but we had to use the
gradient GGA functional PBE (J. Perdew, K. Burke, M. Ernzerhof, Phys. Rev. Lett. 77 (1996) 3865), as the B3LYP hybrid (Hartree-Fock+DFT) used for CoIII(S=0)FeII(S=0) and CoII(S=3/2)FeIII(S=1/2) didn’t lead to converged results
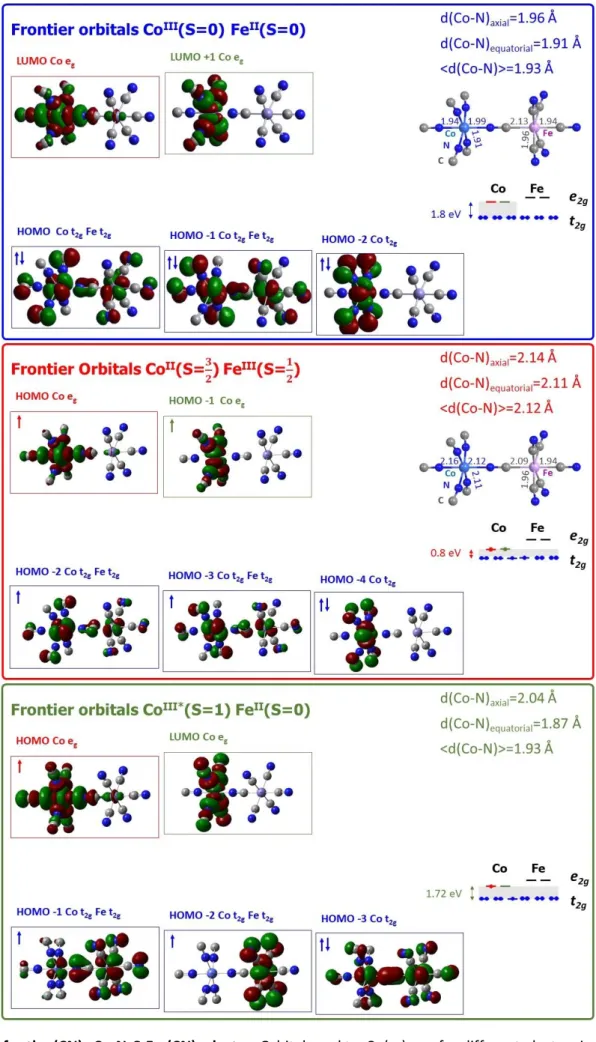
for CoIII(S=1)FeII(S=0) calculations. The calculations provide valuable information (see Fig. 2 ) about the nature
of the frontier molecular orbitals including LUMO and HOMO, the Co(t2g)-Co(eg) gap and the structure (Co-N
4
5
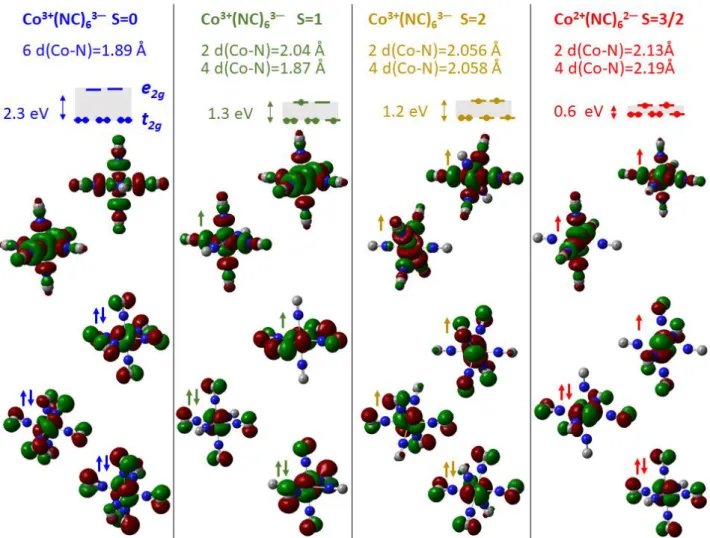
In order to account for the spin transition on the Co, while keeping Fe in S=0, and the CT processes, both stabilized by molecular deformations around the Co, we modeled the Co(NC)6 cluster with specific oxidation
and spin states. Divalent and trivalent cobalt hexacyanide charged molecules were modeled based on a starting octahedral environment with central cobalt surrounded by 6 (NC)─. The quantum chemical calculations were
carried out similarly to dinuclear PBA FeCo using G09 program (license University of Bordeaux) with restricted B3LYP hybrid functional for S=0 state and UB3LYP unrestricted hybrid functional for all other configurations; the choice of the basis set was 3-21g; tests with higher basis sets as 6-31g did not change the results. After full geometry optimizations, the 6 Co-N bonds are equivalent for the state Co3+(S=0) in O
h field, while for the other
states different Co-N distances were identified in relation with the splitting of the orbitals in the D4h field, as
indicated in Fig. 3. Our calculations agree with well-known features for LIESST in isoelectronic FeII complexes
undergoing spin transition: on the pathway CoIII(S=0) -> CoIII*(S=0) -> CoIII*(S=1) -> CoIII(S=2), the t
2g-eg gap closes
and the Co-N bonds expand. This is due to the fact that the LUMO in the CoIII(S=0) and HOMO in the CoIII*(S=0),
CoIII*(S=1), CoIII(S=2) are clearly Co e
g like character. The Co-N bond expands even more in the CoII(S=3/2) state.
The calculations for (CN-)
5-Co-N-C-Fe-(CN-)5 and Co(CN-)6 clusters are in good agreement and in Fig. 2 we
represent the different PEC with typical Co-N bond length and t2g-eg gap:
- the CoIII(S=2)FeII(S=0) state with Co-N ≈ 1.89 Å and t
2g-eg gap ≈ 2.3 eV
- the CoIII*(S=1)FeII(S=0) state with axial Co-N ≈ 2.04 Å and t
2g-eg gap ≈ 1.3 eV
- the CoIII(S=2)FeII(S=0) state, with axial Co-N ≈ 2.06 Å and t
2g-eg gap ≈ 1.2 eV
- the CoII(S=3/2)FeII(S=1/2) state, with axial Co-N ≈ 2.13 Å and t
2g-eg gap ≈ 0.6 eV.
6
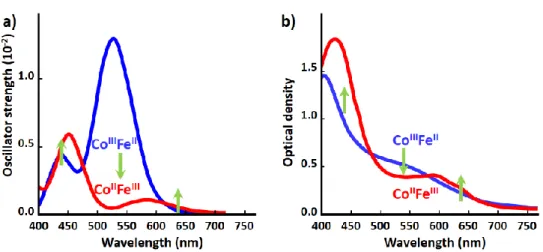
The (Fig. 4) compares the calculated oscillator strength with the OD measurements for the ground state CoIIIFeII
and the photoinduced CoIIFeIII state at 10 K. Fig. 5 shows the results of TD-DFT calculations. For the CoIIIFeII state,
the band in the 530-580 nm range corresponds to Co d-d transitions: the hole has mainly a Co(t2g)-like nature
and the particle mainly of Co(eg)-like nature. FeII(t2g)→ CoIII(eg) transitions, corresponding to the optical gap, are
located in the 1200-1500 nm range, but have an extremely weak oscillator strength, while additional transitions with CT character are located around 390 nm. In Fig. 4, the measured OD change and the calculated oscillator strength changes between the ground CoIIIFeII and the photoinduced CoIIFeIII qualitatively agree, with a
bleaching of the Co d-d band of the CoIIIFeII state (540 nm) and the appearance of two bands below (440 nm)
and above (640 nm) in the CoIIFeIII state.
Fig. 4. Calculated oscillator strength (a) and measured OD change after photoexcitation at 10 K (b). The switching from the ground CoIIIFeII to the photoinduced CoIIFeIII is associated with bleaching of the Co d-d band
of the CoIIIFeII state (540 nm) and the appearance of two bands below (440 nm) and above (640 nm) in the
CoIIFeIII state.
Fig. 5. Natural transition orbitals (NTO) of the CoIIIFeII state. NTO of hole and particle for different transitions showing the CoIIIt
2g→eg nature of the transitions in the 530-580 nm range, and the CT FeIIt2g → CoIIIeg nature of
7 XANES spectral changes
Fig. 6 shows the changes of the XANES spectra of the CoFe nanoparticles, measured at the LCLS around Co and Fe edges (7a and 7b) before and after laser irradiation. The inset of fig. 6a shows the XANES white line before laser irradiation, with maxima at 7725 eV and 7728 eV characteristic of the presence of both CoII and CoIII ions,
as shown by Bordage [ref 27]. The XANES spectral change demonstrates the photo-conversion from CoIII to CoII.
Fig. 6c and 6d show the intensity change measured 3 ps (red) after photoexcitation. These are compared to the XANES intensity changes reported by Bleuzen et al (ref 13) during the photoinduced CoIIIFeII to CoIIFeIII transition
under pressure (blue). There are two processes which contribute to spectral changes at the Fe and Co edges : the change of oxidation state due to charge-transfer and the structural reorganization due to the spin transition. - At the Fe edge, the XANES change is mainly due to CT as there is little structural reorganization in the vicinity of the Fe. The green curve is the spectral change calculated from the ground state, by taking into account the 0.6 eV rigid spectral shift reported by Bleuzen et al (ref 13) after CoIIIFeII to CoIIFeIII photo-switching. The blue
and green curves superpose perfectly, confirming that, at the Fe edge, it is mainly the CT which contributes to the spectral change between CoIIIFeII and CoIIFeIII states. This spectral shift is mainly characterized by an increase
of absorption above 7131 eV and a decrease of absorption below. We attribute the ~1 eV mismatch between Bleuzen's data and our data to a difference in the energy calibration of the instruments used in the two experiments.
Fig. 6. XANES spectral changes. XANES spectra of the CoFe nanoparticles at the Co and Fe edges (a,b). The inset at the Co edge shows the maxima at 7725 eV and 7728 eV characteristic of CoII and CoIII states. XANES intensity
change measured at the LCLS around Co and Fe edges 3 ps (red) after photoexcitation (c,d), compared to XANES intensity changes reported by Bleuzen et al (ref 13) during the photoinduced CoIIIFeII to CoIIFeIII phase transition
under pressure (blue). The green curves represent the spectral changes due to CT only and due to rigid spectral shifts (2 eV at the Co edge and 0.6 eV at the Fe edge).
8
Our time-resolved spectral change data (red curve) provide a satisfying agreement, with absorption increase (resp. decrease) above (resp. below) the isosbestic point around 7131 eV. The difference at higher energy may be due to the inhomogeneous nature of our sample or the partial conversion as in Bleuzen’s data the initial and final states correspond to pure CoIIIFeII and CoIIFeIII states. Another possible explanation for this spectral
difference at higher energy is that after 3 ps some torsion remains in the crystal lattice, which may not be equilibrated. Indeed, the lattice expansion timescale is limited to ≃6 ps, as given by the ratio between the sample size (11 nm) and the speed of sound (≃2000 m/s) at which elastic deformation waves propagate. It is therefore likely that the crystal structure is still locally distorted after 3 ps, as indicated by the activation of the torsion mode during the photo-switching process.
- At the Co edge, the spectral change we observe 3 ps after photoexcitation (red curve Fig. 6c) is in very nice agreement with Bleuzen's data (blue), characterizing the photoinduced CoIII(S=0) to CoII(S=3/2) transformation.
Data analysis of femtosecond optical pump / X-ray probe and optical pump / probe spectroscopies. We analyse the data in two steps, with independent fits first and a global fit of the data in a second stage. For the independent fits of the different XANES time traces, we used a Gaussian function to describe the instrument response function (IRF), 𝐼𝑅𝐹𝑋(𝑡) =
1
√2𝜋𝜎𝑋exp(−
𝑡2
2𝜎𝑋2), characterized by the Gaussian RMS width 𝜎𝑋.
The fastest time trace was observed at the Co edge (7729 eV), where the measured signal 𝑆7729(𝑡) is the
convolution of the IRF with the exponential dynamics at positive delays, selected by Heaviside function 𝐻(𝑡): 𝑆7729(𝑡) = 𝐼𝑅𝐹𝑋(𝑡) [𝐴7729(1 − exp (
−𝑡
𝜏1)) . 𝐻(𝑡)].
Fig. 7. XANES IRFX. Fit of the time trace at 7729 eV providing the IRF (𝜎𝑋=25(10) fs)
and the exponential time constant 𝜏1=46(11) fs.
From the fit shown in Fig. 7, where the amplitude 𝐴7729 is a free parameter, we obtained 𝜎𝑋=25(10) fs and
𝜏1=46(11) fs. Similar fits at 7770 and 7724 eV also gave an IRF in the 25(10) fs range. The IRF of the XANES
experiment was then fixed to 𝜎𝑋=25 fs for fitting the other XANES time traces. We performed independent fits
for each XANES time trace by decomposing the signal into: - rising components: 𝑅𝑖(𝑡) = 𝐴𝑖[1 − exp (
−𝑡 𝜏𝑖)]
- decaying components: 𝐷𝑖(𝑡) = 𝐴𝑖exp( −𝑡
𝜏𝑖)
with characteristic timescales 𝜏𝑖 and amplitudes 𝐴𝑖 as free parameters.
Figs. 8a&b show selected fits for which we clearly distinguish different components:
- at the Fe edge, the main component is 2≈ 200 fs (203-216 fs range), with an additional 3≈ 450 fs (466 fs).
- at the Co edge, the main component is faster with 1≈ 50 fs (43-53 fs range). We also observed observe a
9
We performed similar fits for the OD data (Fig. 8c). However, due to the instrument response function of the OD set-up, 𝐼𝑅𝐹𝑂𝐷 characterized by 𝜎𝑂𝐷 = 80(5)𝑓𝑠, the 50 fs dynamics appears as a step convoluted to the
IRF. Here again we find time constants 3 ≈ 450 fs (414 455 fs range). The damped oscillating component is
clearly observed in OD with a frequency ωo≈1.65 THz (period To in the 593-657 fs range) with a damping constant
o≈600 fs (440-853 fs range). For the XANES data, a weak oscillating component is observed in some time traces
as well. For XANES and OD data, a slower component needs to be included sometimes through a weak linear contribution, very likely due to a much slower process like the global crystal expansion not resolved here. All those independent fits evidence that:
- the Co-N bond elongates within 1≈50 fs, as independently monitored at 7770 eV through the
associated characteristic shift of the first EXAFS feature accompanying the spin transition on the Co. - the CT occurs within 2≈ 200 fs, as monitored through the associated changes at the Fe edge related to
the spectral shift, and also observed for some time traces at the Co edge. 7121 eV also probes a change in the population of Fe d states related to CT.
- an intermediate (INT) state (or several) forms and decays within 200 fs, as clearly observed at the Fe and Co isosbestic points, accompanied by a 450 fs decaying dynamics.
- the oscillating component at o≈1.65 THz, corresponding to periods To≈600 fs, is damped with time
constant o≈600 fs, clearly seen in OD and observed for some XANES data (Fig. 8).
In a second step, we fixed the time constants of the different processes to their characteristic values found from the independent fits: 1=50(10) fs, 2=200(10) fs and 3=450(40) fs. For the oscillating component, we used a
damping constant o≈ 600 fs and a frequency o=1.65 THz. Then we extracted the amplitudes 𝐴𝑖 of the
contribution of each process in the different time traces as shown in Fig. 9. The fits take into account the convolution with the IRF (𝜎𝑋=25 fs for XANES data and 𝜎𝑂𝐷 =80 fs for OD data). The global fits of the XANES
signals measured at different X-ray energies around the Co and Fe edges and in the OD changes are shown by black lines in the main text in Fig. 2. The time trace at 7131 eV shown in Fig. 9b exhibits a single dynamics (2=200 fs), easily decomposed into two components: an exponential decay due to an intermediate (INT) state
(or several) and an exponential increase due to charge transfer (CT): 𝑆7131(𝑡) = 𝐼𝑅𝐹𝑋(𝑡) [[𝐴𝐼𝑁𝑇𝑒𝑥𝑝 (
−𝑡
𝜏2)]. 𝐻(𝑡) + [𝐴𝐶𝑇(1 − 𝑒𝑥𝑝 (
−𝑡
𝜏2)) . 𝐻(𝑡)]]
The INT state, mainly responsible for XANES change around the isosbestic point at the Fe edge (7131 eV), is also responsible for the initial XANES changes at 7129 and 7134 eV.
In addition, the maximum amplitudes around dt=0 of the oscillations show that the equilibrium position is shifted by the spin transition (Fig. 10).
10
Fig. 8 Independent fit. Independent fits of the time traces of XANES at the Co (a) and Fe (b) edges and OD (c), resolving different components i to the signals. The residual between the signal and fits with exponential laws
evidence damped oscillations of OD and some XANES data with period To and damping timescale o. For OD
11 Amplitude/ Probe a1 (1=50 fs) a2 (2=200 fs) a3 (3=450 fs) ao (To=610 fs) to= 600 fs Co 7717 eV 0.0113(3) R 0.034 (5) R 0.025 (3) R 0.0072 (1) Co 7724 eV 0.024 (2) R 0 0.123 (2) R 0.0088(25) Co 7727.1 eV 0.012 (4) R 0.024 (18) R - 0.042 (10) R 0 Co 7729 eV - 0.056 (3) R 0 0 0 Co 7770 eV 0.0159 (7) R 0 0.0122 (7) R 0.0012 (7) R Fe 7121 eV 0 0.0667 (6) R 0.032 (4) D 0.004 (2) Fe 7129 eV 0 - 0.0430 (3) R - 0.021 (1) D 0.0035 (13) Fe 7131 eV 0 0.036 (2) D 0.0054 (3) R 0 0 Fe 7134 eV 0 0.049 (6) R 0.037(4) D 0.0028 (18) Fe 7152 eV 0 - 0.0121 (2) R 0 0 OD 436 nm 0.0040(1) 0.0048 (5) D 0.0051 (2) D -0.0018 (1) OD 587 nm - 0.0109(4) -0.0023 (7) D -0.0033 (3) D 0.0015(2) OD 627 nm -0.0006(3) 0 -0.0048 (2) D 0 OD 780 nm 0.007(2) 0.010 (1) R 0.010 (1)D 0.0045 (3)
Table 1: Amplitude 𝐴𝑖 in the fit of the data of the exponential components with =50(10) fs, 2=200(10) fs, 3=
450(40) fs and of the 1.65 THzoscillating component damped within 600 fs. R stands for rising signal in the form 𝑅𝑖(𝑡) = 𝐴𝑖[1 − exp (
−𝑡
𝜏𝑖)] or decaying signal 𝐷𝑖(𝑡) = 𝐴𝑖exp( −𝑡
𝜏𝑖). Due to the time resolution for OD
12
Fig. 9 Global fit of the dynamics. The global fit (black lines) of the data includes exponential components with 1≈50 fs (bleu), 2≈200 fs (purple) and 3≈450 fs (orange) and the oscillating dynamics (green). The global fit
13
Fig. 10. Oscillating component in the fit of the data. Global fit of the data (left) at the Co edge (a), the Fe edge (b) and OD (c) with oscillating component (right) showing the maximum amplitude around dt=0 characteristic of a displacive process.