Contracts, Not Concrete: De-Risking Private Finance of Sustainable
Infrastructure in Emerging Markets
By
Liam James O'Dea
B.A. Economics and Politics, School of Oriental and African Studies (SOAS) University of London, 2009
M.B.A. Seoul National University, 2016
SUBMITTED TO THE MIT SLOAN SCHOOL OF MANAGEMENT IN PARTIAL FULFILLMENT OF THE REQUIREMENTS FOR THE DEGREE OF
MASTER OF SCIENCE IN MANAGEMENT STUDIES AT THE
MASSACHUSETTS INSTITUTE OF TECHNOLOGY
JUNE 2016
C2016
LiamJames
O'Dea. All rights reserved. The author hereby grants to MIT permission to reproduceand to distribute publicly paper and electronic copies of this thesis document in whole or in part
in any medium now known or hereafter created.
Signature of Author: Certified by: MASSACHUSETTS INSTITUTE OF TECHNOLOGY
JUN 0 82016
LIBRARIES
ARCHIVES
Signature redacted
*Nfr
Sloan School of Management
May 6, 2016
Signature redacted
Juanjuan Zhang Epoch Foundation Professor of International Management Thesis Supervisor
Signature redacted
Accepted by:
Program Director,
Rodrigo S. Verdi Associate Professor of Accounting M.S. in Management Studies Program MIT Sloan School of Management
Contracts, Not Concrete: De-Risking Private Finance of Sustainable
Infrastructure in Emerging Markets
By
Liam James O'Dea
Submitted to MIT Sloan School of Management on May 6, 2016 in Partial fulfillment of the requirements for the Degree of Master of Science in
Management Studies.
ABSTRACT
Matching long-term infrastructure demands in emerging markets with long-dated capital supply - from pension funds, insurers or sovereign wealth funds - has never been so high on the agenda of governments, climate funds and multilateral development banks. It has been argued that with the right policies and incentives in place, and with careful use of development capital and
climate finance, private investors can make a profit financing emerging market infrastructure needs in a sustainable manner. However, this focus on policies and incentives constitutes a model of infrastructure investment risks comprised of country-level and sector-specific macro correlates. In fact there are significant contract-level micro correlates of infrastructure investment risks.
Despite the literature on private demand for sustainable infrastructure investments, few have considered the effects of supply constraints on the process. Infrastructure is not yet clearly an asset class and sustainable infrastructure presents greater uncertainty because technologies are new, funding models are uncertain, financing instruments are inadequate, and there is a paucity of cash-flow data with which to forecast risk-adjusted returns. Substantial private investment in
infrastructure cannot take place without adequate measures of expected risk and performance
-measures which the market has failed to supply.
If sustainable infrastructure is to become an asset class, relevant to the asset-allocation and
liability-management
of investors, then a change of focus is required from the governments, MDBs, sponsors and climate funds who provide institutional investors with access to sustainableinfrastructure assets. The focus should be on collecting project cash-flow data to help answer open questions about cash-flow performance and risks, a task that requires large scale collaboration.
Better information on cash-flow performance by contract-level variables enables benchmarking of infrastructure investments in a manner which can add value to strategic asset-allocation decisions. This focus on contracts-not concrete - offers great potential both to de-risk infrastructure investments and to influence up-stream project preparation in emerging markets. Thesis Supervisor: Juanjuan Zhang
Table of Contents
1. INTRODUCTION 10
1.1 THESIS QUESTIONS & HYPOTHESES 10
1.2 OVERVIEW OF THESIS 12
1.3 CONTRIBUTIONS TO KNOWLEDGE 12
1.4 A NOTE ON TERMINOLOGY 13
2. THE INFRASTRUCTURE INVESTMENT GAP IN EMDES 14
2.1 WHERE IS THE GAP? 14
2.2 PRIVATE FLOWS IN EMDE 17
2.3 THE ROLE OF GOVERNMENT 20
2.4 IT'S NOT ABOUT THE MONEY 21
2.5 THE PARADOX OF INFRASTRUCTURE 21
3. CHALLENGES IN EMDE INFRASTRUCTURE INVESTMENTS 22
3.1 INADEQUATE RISK-ADJUSTED RETURNS 22
3.2 LACK OF TRANSPARENT AND "BANKABLE" PIPELINES: 24
3.3 HIGH DEVELOPMENT AND TRANSACTION COSTS 26
3.4 A LACK OF VIABLE FUNDING MODELS 29
3.5 UNCERTAIN & UNFAVORABLE REGULATIONS AND POLICIES 31
4. PRIVATE INVESTORS 33
4.1 MOTIVATIONS AND INCENTIVES 33
4.2 CORPORATE INVESTORS 35
4.3 INSTITUTIONAL INVESTORS 37
4.4 THE IMPORTANCE OF DE-RISKING 39
5. STRATEGIC ASSET ALLOCATION 42
5.1 WHAT DOES "INFRASTRUCTURE INVESTING" MEAN? 42
5.2 BENCHMARKING Ex-ANTE RISK-ADJUSTED RETURNS 44
5.3 "SUSTAINABLE INFRASTRUCTURE" AS AN ASSET CLASS 48
5.4 CONTRACTS, NOT CONCRETE 50
5.5 HAZARD ANALYSIS 52 6. CLIMATE FINANCE 56 6.1 MDB CAPITAL STRUCTURE 57 7. FOUR POLICIES 61 61 64
7.1 INVESTMENT IN PROJECT PREPARATION AND PIPELINE DEVELOPMENT
7.3 USING GUARANTEES TO IMPROVE CAPITAL MARKETS 66
7.4 INCREASING LOAN SYNDICATION 69
8. CONCLUSION 74
List of Figures
Figure 1: Infrastructure Demand by Type of Country and Type of Infrastructure 2015-2030 ... 14
Figure 2: Annual EMDE Demand Forecast 2014-2020 ... 15
Figure 3: Annual EMDE Infrastructure Investment Requirements by Region in US$ billions 2014-2020...16
Figure 4: Volume of Private Investment in Infrastructure in EMDEs, US$ billions adjusted by US CPI...17
Figure 5: Private and PPP Infrastructure Financing Flows to Middle-Income Countries 2005-2014...19
Figure 6: R isk as V ariability in R eturn ... 22
Figure 7: Biggest Challenges Facing Unlisted Infrastructure Managers in 2016 ... 25
Figure 8: Typical Financing Structure, Cash Flow & Discount Rates over a Project Life-Cycle ... 27
Figure 9: Financial Losses on Foreign Private EMDE Investments 2010-2013...31
Figure 10: Theoretical Effects of Legal Protection on Required Returns for Private Investors in Infrastructure in E M D E s ... 3 2 Figure 11: Infrastructure Investment Strategies and Comparative Risk-Return Structuring...34
Figure 12: Average Current and Target Allocation by Investor Type...38
Figure 13: Project Risk T ransfers in PPP s... 40
Figure 14: Research Findings on Infrastructure Equity Performance ... 44
Figure 15: Listed and Unlisted Infrastructure, Rolling 12-month returns...45
Figure 16: Cumulative Default Rates for Global Project Finance Loans compared to Corporate Bonds...46
Figure 17: Cumulative Default Rates for Project Finance Loans in OECD and non-OECD countries...46
Figure 18: Impact of the Lack of Infrastructure Benchmark on Limited Partner Participation Decisions...47
Figure 19: Probability of Contract Breach by Contract Maturity...52
Figure 20: Proportion of Disputed Contracts by Country Income Level 1984-2011 ... 54
Figure 21: Probability of Project Survival over Time by Share of Private Ownership...54
Figure 22: Probability of Project Survival given International Financial Institution (IFI) Involvement...55
Figure 23: Total MDB Climate Finance in 2014 Split by Instrument...57
Figure 25: S&P Sovereign Ratings of Callable Capital for selected MDBs ... 59
Figure 26: Equity-to-Loan Ratios for Selected MDBs and Private Banks ... 60
Figure 27: Basic Stock and Flow Structure of Investments in a Project Pipeline ... 63
Figure 28: System Dynamics Model of Delays in Perceived Risk-Adjusted Returns from DFI Spending on Su stain ability P rem ium s...64
Figure 29: Non-Trade Guarantee Approval and Call Volume...67
Figure 30: System Dynamics Model of Effect of Path Dependency in the Attractiveness of Guarantees...68
Figure 30: Relation between Borrower, B-Loan Participants & A-Loan Holder ... 69
Figure 31: Loan Syndication Activity of Selected MDBs in 2012... 69
Figure 32: Syndication Time-Line of Typical Events that Precede a Loan Active Date... 70
Figure 33: Infrastructure-Related Syndicated Project Loans (US$ billions)...70
List of Selected Acronyms
ADB - Asian Development Bank
AfDB - African Development Bank
AUM - Assets Under Management
CFI - Climate Finance Institution
DFI - Development Finance Institution
EBRD - European Bank for Reconstruction and Development EMDEs - Emerging Markets and Developing Economies
GCF - The Green Climate Fund
GGGI - The Global Green Growth Institute
GHG - Greenhouse Gases
GIH - Global Infrastructure Hub
IFC - The International Financial Corporation
IRR - Internal Rate of Return
MDB - Multilateral Development Bank
MIGA - Multilateral Investment Guarantee Agency
NPV - Net Present Value
ODA - Overseas Development Assistance
PE Funds - Private Equity Funds
PIDG - Private Infrastructure Development Group
PPP - Public Private Partnership
REIPPP - Renewable Independent Power Producer Program RFP - Request for Proposals
SEC - Securities and Exchange Commission
SDGs - Sustainable Development Goals SPV - Special Purpose Vehicle
1. Introduction
1.1 Thesis Questions & Hypotheses
Sustainable infrastructure, by definition, is socially inclusive and environmentally sound. Because infrastructure projects require large up-front capital expenditures and last for decades, choices tend to be irreversible. It follows that building sustainable infrastructure offers potential to help meet or exceed the Sustainable Development Goals (SDGs), which aim to eradicate poverty by 2030. As such, matching long-term infrastructure demands in emerging markets with long-dated
capital supply - from pension funds, insurers or sovereign wealth funds - has never been so high on the policy agenda. With the right policies and incentives, so the argument goes, private investors can make a profit financing the infrastructure needed to make these goals a reality. Some argue
sustainable infrastructure offers a "triple-win"': reduced emissions and climate risk, better quality economic development, and increased returns for investors. These arguments are now extremely popular2, although they have also been made multiple times in the past' without any significant progress taking place.
It is true that "policy makers need to focus on and strongly influence how decisions are made to invest in long-lived infrastructure if global climate change goals are to be achieved"4. The literature is full of strongly-argued intervention ideas which target the sector-specific policies", institutions6 and capital markets7 that form the context in which private investors make their decisions.
However, most studies fail to focus on investment decisions themselves. How exactly are they made, who makes them, and on what basis? The "private sector" is sometimes referred to as though it were a monolith. Risk and return are routinely misunderstood. Multilateral Development
1 McKinsey 2016, p.6 2 de Boer 2015 3 Valahu 2007 4 OECD 2015 s WWF 2015, McKinsey 2013 6 de Boer 2015 7 McKinsey 2016
Banks (MDBs) and the Green Climate Fund (GCF) are both feted and vilified, and yet many commentators do not understand the constraints under which they operate. While infrastructure investment is 'not about the money', it is not clear that policy makers have the right focus to strongly influence investment decisions. On this basis, the hype about private investment therefore is not justified.
In order to look critically at policy ideas which aim to influence how decisions are made to invest in long-term infrastructure, it is important to ask: what constrains private capital allocations to infrastructure in general, and to sustainable infrastructure in EM7DEs in particular? It is said that there are three main challenges to financing sustainable infrastructure at the scale required to meet or exceed the Sustainable Development Goals.
1) There is not enough private capital allocated to infrastructure in general, despite the fact that investor demand currently exceeds the supply of investable opportunities.
2) Significant amounts of private finance and expertise must flow cross-border to EMDEs, the location of both the majority of future demand for infrastructure and the majority of future greenhouse gas (GHG) emissions.
3) Increasing the supply of private capital allocated for infrastructure does not, in itself, increase the proportion which is sustainable.
In examining the three challenges above, in relation to how private investors make asset-allocation decisions, this thesis proposes two hypotheses:
1. Neither increased loan syndication, nor increased use of guarantees or sustainability premiums are likely to close the infrastructure finance gap, because they have no effect on
ex-ante risk-adjusted returns, the primary driver of investment decisions.
2. An intense focus on sectoral policies and incentives obscures the importance of contracts and performance monitoring as determinants of private participation.
1.2 Overview of Thesis
This thesis first introduces the infrastructure finance gap in emerging markets and developing economies (EMDEs) to establish the context for a discussion of sustainable
infrastructure. Second, it presents the challenges of EMDE infrastructure investments in general, explaining five common barriers to private investment. Third, it focuses on private sector incentives and the characteristics of infrastructure as it pertains to investor asset allocation decisions. Fourth, it considers the role that MDBs play in this effort, noting their capital structure constraints and their climate finance record. Fifth, it explores the dynamics of four policies aimed to increase private participation: investments in pipeline development, guarantees, loan syndication and sustainability premiums
Based on an examination of supply constraints inherent in ideas to scale-up private finance for sustainable infrastructure, this thesis concludes that recent reports on infrastructure investment have reached a peak of hype which is not justified by the underlying constraints. Private finance, given the right policies and incentives, is unlikely to close the infrastructure gap over the next 15 years without significant new data on the performance of contracts and risk.
The risk is that over the next 15 years, the infrastructure gap will remain as large
proportionately as it is today, which would dramatically shape the trajectory of efforts to deal with climate change in EMDEs.
1.3 Contributions to Knowledge
Intense focus on sustainable economic development culminated last December in Paris with a strengthened international consensus and broad global agreement to reduce the level of
greenhouse gases. The Green Climate Fund (GCF) raised initial pledges of over $10 billion and each of the six major multilateral development banks conmitted to increasing their capital commitments to sustainable infrastructure by as much as two or three times the current level. They hope to mobilize 3 to 5 times as much capital through stimulating private participation.
This thesis - on derisking private finance for infrastructure in sustainable development -examines a key element of progress: on whether current multilateral policies on scaling-up private infrastructure finance in EMDEs actually addresses the decision criteria which determine private participation. It pays particular attention to recent excitement about the potential of private
investment to produce sustainable infrastructure. This excitement is unfounded and has produced a proliferation of important-sounding reports offering sweeping state-of-the-system conclusions' which fail to engage with perhaps the most important determinant of infrastructure project cash
flows: contracts.
By proposing some system dynamics models for further development, this thesis attempts to identify whether some popular multilateral intervention ideas are likely to increase flows of private
finance to sustainable infrastructure in EMDEs, as well as to identify sources of foreseeable policy resistance.
1.4 A Note on Terminology
The term 'infrastructure' has no clear accepted definition among private investors and there is no agreement on the role it plays within portfolios. Sustainable Infrastructure is defined as infrastructure that is socially inclusive, low carbon, and climate resilient, but it also lacks a clear definition from an investment and financial regulatory standpoint.
It is important to note, at this point, that this thesis does not focus on public-private
partnerships (PPPs). PPPs are a tool; they are not the end goal. Governments start with a problem in context, such as the need for energy assets, and then ask if PPPs fit. Not the other way around.
8 Rohde 2015, de Boer, Hulse and Kutner 2015, Mainelli and von Gunten 2015, Zuckerman,
Frejova, Granoff, and Nelson 2016
2. The Infrastructure Investment Gap in EMDEs
2.1 Where is the Gap?[he infras truc ure investment gap has been measured and documented elsewhere at global and regional levels, by academics, multilaterals, private investors, consultants, governments, and
think-tanks; it is not the focus of this study. Regardless of inethodology, all recent estimates of infrastructure requirements find that a signticant gap exists.
lIMDMIs account for 37% of world infrastructure spending, despite their high growth rates
and the fact that tieyi represent 73% of world population. It is not surprising therefore, that letween
201 5 and 0), the majority of the infrastructure gap -65% according to McKinsey (2016, p.9) is located in NlDs.
Infrastructuro domand by type of country, trifrastructure demand by type of infrastruulure
2015-30, S Vro imsant 2073> class, 2015-30, c20 C
Transpcrt 240 7 3
0
+1Water miarne miroFigxre 1: Infrastructitre Demnand by Tyrpe of Country and Type of Infrastructure 20.15-2030 MNcKinsey 201(i, p-.2-;
Taking the most conservative, recent estimates whJi om-it dleveloped-wvorld calculations, Ruiz-Nunez & WVei (201 i p.9) forecast total demand in MDsof $836 billion per yecar between 2014 and 202), 49%/, of which is capital expendituire requiLrements and 51%V of which is reqired for
to spend around 6 percent of GDP through 2020 to satisfy individual and enterprise demand for infrastructure services .
Figure 2: Animal EM DE Demand Forecast 2014-2020, Source: Ruiz-Nuflez and Wei (2015) p.10
B' income gyroup Low Income Lower Middle Income
Upper Middle Income
Capital L'S$Mn r 176,217 7 35,821 1 160,251 2 Mainten ,GDP USSMn .1% 172,089 '1% 72,063 4% 203,047 ance Total %/GDP US$Mn 6.9% 348,306 2.3% 107,884 26% 363,298
Dece oping countries by region
SAtR SSA EAP MENA LAC ECA
Developing countries by sector
Electricity Transport Telecoms W&S+ VW 159,074 28,946 115,897 14,826 65,828 24,178 152, 57 7 76,201 123,351 20160 _ 7.8% 3-2% 2 0% 11% 17% 0.8% 144,427 27,108 96,244 32,244 74,450 36,267 11% 167,754 0.6% 178,818 0.9% 63,755 0.1% 36873_ 7.1% 3.0% 1.7% 2.5% 1,9% 1,1% 1,2% 1.3% 0.5% 0.3% All developing countries High Income countries
World 303,501 56,054 212,140 47,070 140,277 60,445 14.9% 6.2% 3.7% 37% 3.6% 1.9% 320,331 2,4% 255,019 1.9% 187,105 1 4% 5 033 0, 4%_i 8 19488 6.0% 285,045 0 8% 104,3 2r.2
The same study" estimates that $58f) billion is spent in I Imerging Markets and Developing
Etconon'iies (NID ) each year, although data is scarce. China's infrastructure spending vastly outweighs its own projected needs, so it can be onitted from an analysis of the gap. Once Chinese data is removed actual spending in I NIDEs is only $259 billion per year. This leaves an annual infrastructure investment gap in INID)ls (minus China) of $452 bilion between 2014-2020.
The implication therefore, before we even consider sustainability, is that LMDIIs need to almost double their current annual infrastructure investments in order to meet demand and pursue prosperity. When we consider sustainability, then the up-front costs of building sustainable infrastructure is 6%1 higher or more for individual projects ". According to McKinsey, it is possible
I
QX4GDP 14.1% 3.4%
2.6%
Ruiz-Nunez and \Vei 2015, p.9 "'Ruiz-Nunez and Wei 2015, p.2 "iMcKinsey 2016, p.2
for the private sector to close around 1/3 of the gap w 1orldide thr( LI-h incremental spending",
providing the right incentives ire in place and there irt enough bankable projects. I lowever, "It is unlikely that private-sector money will be enough; development banks, miultilateral institutions, and otticial development assistance will aIso need to get involved."" Accrcding to the \Vorld Bank, for instance, in I NID[s "more than 7%( of the current infrastructure funds come from the public sector. the second largest source of financing comes from the private sector, roughly 20% of the
total funds. Ihe remaining is covered bv ODA" 4.
Figure 3: Annual EMDEI3 Infrastuncture Investment Requirements by Region in USS billions 2014-2020, Soitrce: Ruiz-Nunez and Wei (2015), p.1
EAP* SAR LAC SSA ECA MENA
I
Total? NlclKinsey 2016, p.7
Nlc1Linsev 2016, p.2 5
" Rtuiz-Nunez and \Vei 2015, 1.2
1China overspeneds so Chinese data is omitted fr m Vast-Asia Pacific (IPA* region.
Requirements 87 309 141 58 62 53 711
Actual 35 68 41 28 35 52 259
Gap 52 241 100 30 27 1 452
-2.2 Private Flows in EMDE
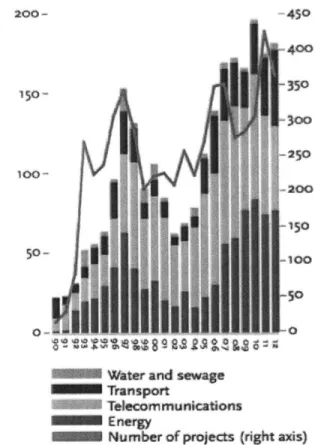
Since the early 1990s, the amount of private investment in I NIDi infrastructure has
experienced some growth (F igure 4). In addition, since the 2008 financial crisis, governments face fiscal constraints which means they can no longer be expected to finance needed infrastructure. Optimism about the potential for INIDE governments to finance infrastructure through capital markets is not new", "yet the volume of private participation in financing infriastructure projects in LMDIIs remains modest"'.
Figure 4: Volume of Private Investment in Infrastructure in EMDEs, USS billions adjusted by US CPI, Source: MIIGA (2013) p.4 3 200 45o 41X 44
N.
-250
200
Water and sewage Tuima
Tansport
Telecomrmunicatfons E nergy
at Nuber of projects (ight axis)
Valahu 2007
Schwartz, Ruiz- Nufiez and Chelsky 2014, p.1 4 1
17
Infrastructure investors the world over tend to invest in their home region". Since around
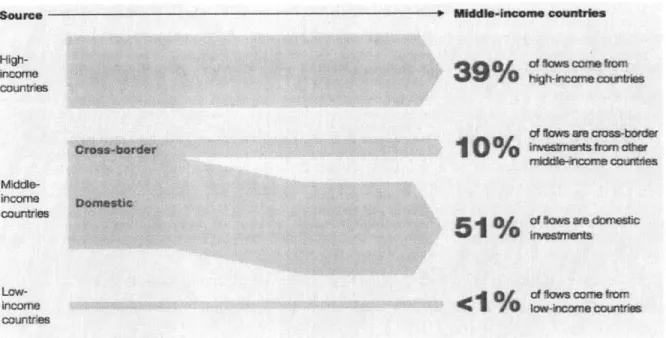
65% of demand for infrastructure between 2015-2030 is from emerging markets, this is noteworthy. When private and PPP infrastructure financing flows are combined, then 51% of infrastructure investment flows are domestic", perhaps reflecting the fact that domestic investors are more familiar with the local context, face lower transaction costs and do not bear the same currency risks as a foreign investor.
Although PPP finance accounts for only 22 percent of overall infrastructure flows in emerging markets20, according to the World Bank's PPP database, 60 percent of PPP finance to "middle income" emerging markets between 2005 and 2014 came from other "middle income" emerging markets. In public-sector parlance this is "South-South" finance, and it is important to recognize its role, because it provides a rebuttal to those who believe climate finance is akin to charity from developed to developing countries2.
That said, low-income countries do not exhibit the same promising domestic and regional private involvement. In those countries, according to McKinsey, only 8% of private finance comes from domestic sources. Nonetheless, 53% of private finance to low-income countries is from middle-income countries, with the balance coming from high-income countries2 2
, suggesting that closing the gap in low-income countries requires significantly different investments from sources such as the Green Climate Fund (GCF) until local capital markets improve through savings accumulation.
The bottom line is that private infrastructure investment tends to be sticky - that is investors tend to remain in their home region - and the majority of private finance in emerging markets is from a domestic region. Worldwide the theoretical market is huge, but on a regional level
the addressable one is much smaller-.
' McKinsey 2016,p.18
19 McKinsey 201 6
,p.20-21
20 McKinsey 201 6,p.22 2 Ha, Hale and Ogden 2016 22 McKinsey 2016, p.2 2
Figure 5: Private and PPP Infrastnucture Financing Flows to Middle-Income Countries 2005-2014, Source: McKinsey (2016)), p.22
Source - Middle-income countries
High-urr Mtddle-iflCUrnS c-ursrstmet rr i 1 e Al r fA "I W 0 wic re o nr c cntrile I 19 I1
2.3 The Role of Government
Infrastructure has strong public-good characteristics, is highly visible, highly sensitive to local politics, requires large capital expenditure, and is often a natural monopoly. For these reasons,
governments have played, and will always play, a leading role. In EMDEs government is the principal investor.
Problems plaguing public infrastructure in EMDEs are often obvious, but hard to resolve: tariffs are significantly below cost, bills are not collected, service quality is unreliable, losses and theft levels are high, labor productivity is poor and incentives for managers and workers are misaligned with social and productivity goals. There is a bias towards large capital projects rather than improving existing infrastructure or adopting reforms to manage demand. Some of these capital projects are white elephants, with negative social value and "the amount of innovation in the infrastructure area is "terrible' because the public sector has no incentive to innovate, there are below-cost tariffs, and there are subsidies to the owners of the existing system. When sustainability is added into the mix, governments assume that adding sustainability criteria to an infrastructure project will increase costs and construction time, while potentially excluding local suppliers who do not have the skills to meet the new criteria2 5
.
It is clear that governments may decide to enlist private sector finance and expertise. However, negotiating a PPP takes a lot of time and resources. Hence preparatory work prior to bidding or Requests For Proposals (RFPs) becomes important. If government wishes to pursue PPPs, it will need to establish the capacity to design them, identify and value the risks, and be able to ensure that a PPP provides value as compared with the traditional public provision of that service. As such, governments must make a serious assessment of the contract obligations they are entering into, because avoiding tough questions or issues in the hope that they will disappear has historically proven to be costly in the long run.2
6 Indeed, projects in emerging markets have significant political risks, usually calculated as a sovereign bond yield spread betveen host country yields and the risk-free US yield. Projects with strong economics that are also well structured in terms of risk can
24 H. Lee, Lecture 1/25/2016 25 McKinsey 2016, p.5 1
achieve investment-grade ratings, but the ratings of debt issued will be constrained by the credit-rating of the sovereign7.
2.4 It's Not About the Money
The infrastructure investment gap is large. Perhaps the private sector cannot afford to close it. Is that true? At the recent Global Infrastructure Summit, World Bank President Jim Kim said: "It's not about the money"2 a widely shared view among multilateral development banks29. For the
financial system, the challenge has little to do with the scale of the funds required. In addition, the number of private players offering debt increased after the financial crisis and the Basel III regulations, while more investors are looking to invest in infrastructure equity both directly and indirectly". Availability of debt and equity sources is no longer a significant concern".
2.5 The Paradox of Infrastructure
There is, in other words, a substantial investment opportunity for the private sector, and there is substantial capital available to be deployed. "The paradox of infrastructure is that there is huge interest, but it's taking a long time to happen."32
Why is that?
A detailed explanation can be found in the characteristics of specific projects, specific investor types, specific countries, specific sectors, decisions models, new technologies and empirical data. The interaction of these characteristics reveals barriers which inhibit investment in
infrastructure in general, as well as for sustainable infrastructure in particular. The next section explains five common barriers.
27 Fitch 2004, p. 12 28 WorldBank 2016 92 Valahu interview 3" Preqin 2016 3 McKinsey 2016, p.1 7-1 8 3 Authers 2015 21
3. Challenges in EMDE Infrastructure Investments
3.1 Inadequate Risk-Adjusted Returns
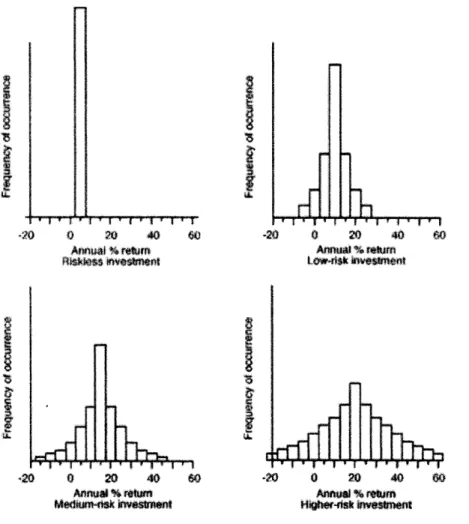
Risk-adjusted returns are a relative measure of return per unit of risk taken. They are the primary metric upon which portfolio managers are judged ex-post and they are the primary driver of strategic asset allocation decisions ex-ante among institutional investors. 3 3
An investment with returns which are not likely to deviate much from the expected return is considered low-risk. An investment with volatile returns from year to year is risky. Risk-adjusted returns, therefore, discount expected returns by volatility of returns (Figure 6). Figure 6: Risk as Variability in Return, Source: Mullins (1993) p.2
?0 0 20 40 60 Annu % return
n ~es
wenei Ijrrf{
0 20 40 Annual % r ttut Mediatask nvestmnr riPTb
0 20 4O W Annul %eturn ow-0$k IvMesment 40 0 20 40 00 Anous! % roeto Hqghefdsirws e 60t
I
LA. 13 McKinsey 2016, p.3 3 -1q.In a series of over 50 interviews with private investors, McKinsey (2016, p.3 3-3 4) noted that
inadequate risk-adjusted returns was the most-frequently cited reason for not investing in sustainable infrastructure. In particular, if the investment is related to a breakthrough technology, then private interest is likely to be lower, because investment decisions are made based on historic benchmark returns, which by definition are lacking for breakthrough technologies. Sustainability raises up-front costs for sustainable infrastructure, while future cash flows are more uncertain and there are significant risks in construction, operating and procurement. Investors can mitigate these through risk sharing or broader cost allocation within the project risk-allocation process, but when this doesn't happen "private investors will likeyfind theprojects
unattractive"3 4. It follows that only investors with high risk appetites are willing to consider such investments in
EMDEs without first seeing the technology proven over time in a less-volatile market.
It is important to note that private investors do not avoid sustainable infrastructure investments because the returns are not high enough. They avoid such investments because the risks are too high. The fundamental principle35 of sound project financing is that risks should be allocated to and borne by the party
which is best able to manage or control them. Wherever there is a risk which can be controlled by a contractual party, therefore, it should be allocated accordingly. If it is a market-wide risk, then government should bear the risk (Figure 7), and it is a project-specific risk, then the private partner is best placed to mitigate. Other risks which cannot be controlled can be mitigated through contracts or they can be hedged. However when this does not happen, risks are retained by the special purpose vehicle (SPV) and its investors and for this reason, private investors in EMDEs often "avoid infrastructure like the plague"36.
23 1 McKinsey 2016, p.3 4
35 Deep 2001, p.2 1 9 36 Source: survey response.
3.2 Lack of Transparent and "Bankable" Pipelines:
As we have seen above, the theoretical market for infrastructure is huge, but the addressable one is much smaller. Many EMDE infrastructure projects under consideration are not "bankable," in that they do not appear likely to deliver high enough risk-adjusted returns to attract private-sector equity or debt. Or "costs and risks may not appear to be allocated appropriately."" Asked about the infrastructure investment gap last year, Bertrand Badr6 of the World Bank told the Financial Times: "There are simply not enough viable projects out there"38. The onus is on governments to build pipelines because government, as noted above, takes the lead on infrastructure.
When governments fail to develop long-term plans, then the private sector has no reliable signal of expected needs and no justification to build expertise in new regions. Even when states do try to develop long-term plans, the credibility of such plans is often in question. For example, in East Asia, "Some national targets have been missed repeatedly (e.g., South Korea and Japan), some governments have been accused (mainly domestically) of lacking ambition in key sectors
Japan,
South Korea, Taiwan, Singapore), and some long-term plans have been frequently revised (e.g., Thailand has launched three long-term "alternative energy" strategies in just six years)."3
Given that few developed countries publish their project plan pipelines, it is not surprising that fewer still EMDEs either publish or communicate their own plans. Because certain risks, such as legal and political and currency risks, are more pronounced when foreign private investors are involved in emerging markets4 , it is fundamental that in order to assess these risks, investors should have a clear understanding of the historical and social environment of the host market in which the project will be located'.If a private investor is not sure how many projects will take place in a specific region or a specific sector, there is no rationale to develop costly regional expertise in due diligence and credit-evaluation, because the investor cannot hope to recoup these large fixed costs on the basis of one or two publicly available projects. It follows that the incentive to invest in local staff and partnerships is absent, and capital remains "sticky" or tied to its home region.
37 McKinsey 2016, p.3 0
" Authers 2015
3 REN21 2015, p.29
4 Deep 2001, p.2 2 2 4' Deep 2001, p.2 2 1
Governments, even in developed countries, are understaffed, lack incentives, are bad at IT, have other social concerns and exhibit fragmented accountability. Because bankable infrastructure investments require significant up-front investment in staff, money, and time, if a government wants to pursue private participation, it must be prepared, or somehow enabled, to make these
investments. Above and beyond the challenges faced by developed nations, IMI)Is lack project-development resources, are unable to afford funding commitments and often cannot offer credible and sufficient guarantees to offset perceived risks2.
Figure 7: Biggest Challenges Facing Unlisted InfrastructUre Managers in 2016, Source: Preqit (2016) p.4 A.Source W: PreNO(01 Fibjrng
ZeZivec
2t lo Pp"on M0% I0 2V1% 32% 4*%0
10 Hn ins t fO K U> nf,0When one considers sustainability, the challenges become even more complicated. Specihcally, a lack of defined standards, relating to resiliency and energy efficiency in particular, make project design awkward. Moreover, some types of sustainable infrastructure are distributed or being sold as "infrastructure-as-a-service" models, notably in the power sector". Traditionally dominated by large utilities, renewable power is increasingly off-grid and financed by smaller entities on the household and conmnunity-level. The I kC and other advisors have long tried to enjoin
environmental concerns into project development at an early stage. Iven it a government is committed to developing a long-term plan, there are technical obstacles to producing viable project design specifications, major hurdle to bankabitity which delays pipelines.
- NMc KIns ey 20 t6, p.3
McKinsey 2(.)16, P.3 2 ' McKinsey 2016, p.3 6
3.3 High Development and Transaction Costs
Investing in physical infrastructure is a textbook case of the hold-up problem": most capital investment must be made at the beginning of a project and returns accrue gradually, while assets are immobile and lack alternative uses (in other words they are relationship specific). According to Gavin Wilson, head of the IFC's Asset Management arm, "It's a critical difference with other businesses and services, and not like health or education. All the, money has to arrive before anything exists"
The outset of a project, when returns are highly uncertain, is the riskiest part of the life-cycle, although relative to the capital required for a whole project, the financial demand is only 1%-5% of total project costs. However, the experience of the IFC in financing greenfield projects
"demonstrates above all the importance of identifying risks at the outset of a project."48 If the average infrastructure project is $200 million, then this cost amounts to between $2 million and $10 million, not counting the cost of discontinued projects. The effects of this hold-up problem are particularly important for investors because "the availability of sufficient economic potential is primarily determined by the project selection"49. For a government, exploring different options rigorously to make an informed project selection is expensive and offers no direct return. The need to create unique financing structures for each project increases project preparation time and transaction costs, which are difficult to recoup since they are not capitalized50.
Even if a government expends the necessary capital, and decides that there are benefits to working With the private sector, over and above public provision of a service, then the issue is complicated by the fact that there is no standard PPP template, and particularly if project finance is utilized, every project must be carefully judged and every risk must be carefully weighed and allocated based on who is best able to bear each risk.
46 Blanc-Brude 2016
47 FT 2015
48 IFC 1999, p.3 8
4 Weber and Alfen 2010, p.14 5 5o McKinsey 2016, p.3 2
Figure 8: Typical Financing Structure, Kristinsd6ttir (2012) p.62
b R k it
y cay $
wyM
Cash Flow & Discount Rates over a Project Life-Cycle, Source:
Hst M06ag e r
fri N
to *d rt e Cada o
Teth.iuy \ ,g f
~
'-;
K~
(t na ee e4h I fl, y rr"m, r e 7err l IE'Afly engea e, Appt A 1% Of Idtal Pf Oject C06t ta t es i de ApMe 4% of Tota 9 ct -wt CO onvFicefnlt Approx 95% of Ttal Project C
The process of undertaking this painstaking analysis, therefore, depends upon the amount of funds available for early-stage project development. In this sense, this
barrier
is related to the abovebarrier:
a lack of bankable projects.Moreover, if the bidding or procurementt process is inefficient, then this will discourage private investment because costs vill be hgher. Transactions must be tailored to the specific project
27
rn
Higher Rik Lower Rsk Cash ROw Diwaunt Rate)1*
Ct ft -~ 4 r poll 00context, and technical standards can be both diverse and inconsistent. "Investors with limited resources, time, and expertise, such as pensions and insurance companies, can find it difficult to assess projects when standards are so fragmented.""1
If a project is to be a sustainable one, then transaction and development costs are likely to be even higher due to the greater rigor required in writing the output specification for a sustainable asset. Data on the financial and risk-performance of such assets is lacking, in part because they are so new, and this fact makes deal evaluation much more complicated. A track-record of observed long-term investment returns for sustainable infrastructure assets would help. The problem is that such a track record does not exist52
. Investors are less familiar with sustainable infrastructure technologies, and research indicates that they have difficulty incorporating returns from speculative benefits such as climate resiliency, into their existing risk-return models53. The fact that many sustainable assets are small scale and distributed assets complicates this matter as well.
s" McKinsey 2016, p.3 2-3 3 52 Blanc-Brude 2013 s3 McKinsey 2016, p.3 3
3.4 A Lack of Viable Funding Models
While sustainable infrastructure projects may offer savings in total cost of ownership (TCO) for a project, allowing a private investor to recoup costs plus an investment return, there are
currently few models designed to capture positive returns from speculative benefits, such as
resilience, less carbon emitted, or lower costs as compared to traditional infrastructure5". In addition, even when a sustainable project offers positive NPV over its lifetime, there may be a split incentives problem. For example, higher up-front costs will be paid by a constructor who makes an asset energy-efficient, while TCO savings from lower energy bills accrue to the operator or household owner. Attempting to re-allocate costs equitably between parties makes funding more complicated55. The bottom line is: "Capital costs on low-carbon infrastructure projects are often higher than for alternative investments, while future cash flows are more uncertain"'.
As a result many projects cannot deliver minimum 10-15% returns investors expect, in part because the public is unwilling or unable to pay high enough charges to allow for full cost-recovery plus a return57, and government knows this. Governments face a fundamental dilemma about working with the private sector - "charging the public for something they had previously
considered as free is unpopular"". As a result governments face substantial incentives to maintain tariffs below-cost, and regulators are least likely to raise tariffs when the economic imperative for doing so is greatest59 because for example, in times of high inflation, the economic value of the tariff deteriorates, yet it is these times when regulators are under most pressure not to raise tariffs. As the value of the tariff erodes, services decline, and the public become resistant to paying more for a
declining service. When inflation happens, government can't control some prices, such as food, but
it can control the price of infrastructure.
While the private sector has one principal set of stakeholders (i.e. shareholders), the public sector has a diverse range of stakeholders. The public sector has a fear of giving up control and exposing itself to criticism from one or more of its many stakeholders. By retaining control, it 54McKinsey 2016, p.3 3 ss McKinsey 2016, p.3 3 56 World Bank 2013, p.2 3 17 McKinsey 2016, p.3 3 58 Authers 2015 s G6mez-Ibfiez, 1997b 29
believes it reduces this vulnerability and can respond more quickly and with greater political
sensitivity than the private sector to any stakeholder discontent. The private sector has a very intense focus: the bottom line. There is a broader range of concerns for government, who are better at dealing with problems in that range. While it may express an intent to pursue a privately-financed project, the public sector will be pulled towards designing a process that is closer to a traditional cost-plus procurement than a partnership.
3.5 Uncertain & Unfavorable Regulations and Policies
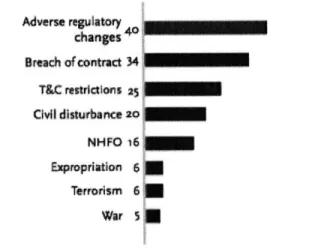
According to Infrastructure Investor (2016): "Regulatory instability perception is the largest barrier that prevents or limits investment into infrastructure and therefore hampers the maturity of
the asset class." Evidence from MIGA (2013) suggests that adverse regulatory changes and breach of contract are the leading causes of financial losses among foreign investors in emerging markets.
Figure 9: Financial Losses on Foreign Private EMDE Investments 2010-2013, Source: MIGA Political Risk Survey 2013 Adverse regulatory changes 40
Breach
of contract 34 ThC rtstr tionS 2t5 Civil disturbance 20 NHFO 16 Expropriation 6* Terrorism 6 War $aTiihe
lifetime of an infrastructure asset, at 20 to 50 years, xv~li be much longer than that of theaverage democratic government. The capacity of an individual government to influence infrastructure investment decisions through policy is thus limited by the fact that any promised action is likely to expire or be supplanted when another government With other policies takes over.
According to Amin Rajan 6 1, governments will make a "scout's honor" soft undertaking, which fals
to have the intended effect on the private sector. One of the main obstacles to turning demand into reality is thus the tendency of governments to "change goalposts all the time". As a result many private institutional investors "are not prepared to take on the complex political risks involved... if
they cannot get the necessary undertakings from governments".
What does it mean to get the necessary undertakings from governments? One fundamental misconception is that the private sector needs public financing in the form of incentives such as
tax-6" Authers 2015
6Authers 2015
I
I
incentives, feed-in tariffs, guarantees and 'innovative policies'. However, analysis from the OECD (2014) indicates that public financial support is not a relevant factors in asset allocation to
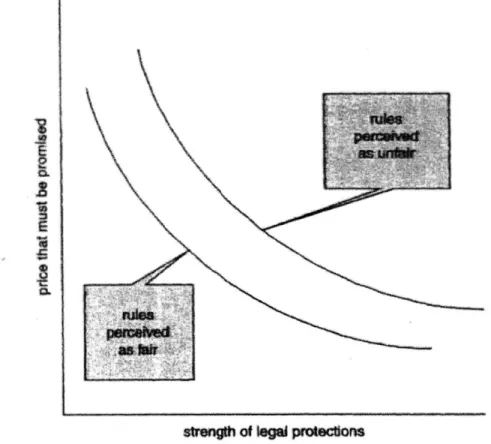
infrastructure decisions or country-allocation decisions. Far more important is a robust rule of law, the absence of political interference, clear institutional frameworks and consistent predictable regulation. In reality, "higherpublic intervention nith fnancaa/ suppoit 71//a' tritgers a higherprrobability o/ political
inter rence in pro/ect managetnent and o /contract renegotiation, somethin4 that pivate investoris ane not coniortable with."2
Figure 10: Theoretical Effects of Legal Protection on Required Returns for Private Investors in Infrastructure in FMDEs, Source: Irwin (2007) p.100
0
i
E
rulteu
W, fair
strength of legal pwtectons
Investor confidence takes a long time to build-up, and can be very quickly knocked down because "poor contract enforcement reduces investor confidence in long-term returns no matter hv attractive the economics appear"6 3
. The private sector is also very sensitive to where projects were successful in the past and as a result any first-of-type project in a new country is very hard to get private investment tor.
62 OECD 2014, p.41 3 NiclKinsey 2016, p.30
4. Private Investors
4,1 Motivations and InceTINVes
Now that we have established characteristics of the infrastructure investment gap and the common l)arriers to private investment, it is pertinent to examine the incentives and motivations of private investors, both corporate and institutional.
Tabic 1: Private Investor by AU M and Investment Strategy, Souce: fror interview and adapted from
Banks 40.2 Is"o mic Senior Debt
Investment 29.0 13.5% Appreciation Value Added
Companies lqit
Insurance 26.5 12% Income Senior Debt
Companies & Private Pension Funds
Public Pensions & 10.9 50 Income Senior Debt
Superannuation Schemes
Sovereign Wealth 6.3 3% Appreciation Value Added
Funds Equity
Infrastructure 3.4 .5% Appreciation Core IqtIity
Operators and Developers
Infrastructure & PE 2.7 1.2% Appreciation Opportunistic
Funds Iquitv
Endowments and 1.) 0.5% 2 Appreciation Value Added
Foundations I cuity
Infrastructure investments in theory offer improved diversification, improved liability-hedging and lower volatility than capital market assets, based upon the following assumptions:
1. Predictable free cash flow
2. Attractive risk-adjusted yield over the long-term
3. Low price-clasticity of demand & low correlation with business cycles 4. Inflation linked cash flows, hence an inflation hedge
5. The opportunity to invest in uniistcd assets
Different investors with heterogeneous risk-return preferences can offer different
combinations of capital structure that might match with project types and across project life-cVcles"t Boosting private participation in sustainable infrastructure finance in EMDlts will mean finding approaches tailored to each investor. UTnders tanding how institutional investors differ along risk
preferences, investment stratoies, time horizons, regulatory status, and other incentives, is an important step in recognizing and setting expectations about their potential to close the gap.
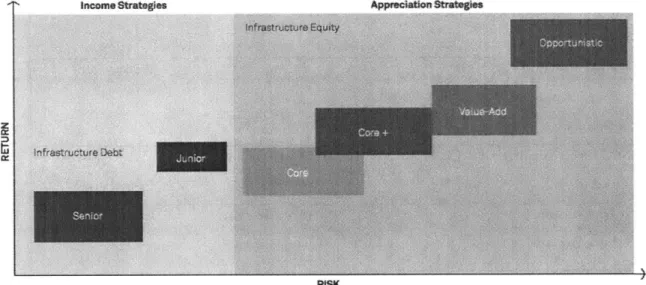
Figure 11: Infrastructure investment Strategies and Comparative Risk-Return Structturing, Source: BlackRock (2015) p.4
Income Strategies Appreciation Strategies
z
RISK
There are two basic types of strategy: income strategy or appreciation strategy. Since there are only two sources of returns for an investor, capital gains from asset appreciation or cash flow from dividends, there are two basic types of investment strategy: income strategy or appreciation strategy. The difference between the two comes down to whether and when the investor plans to
exit the investment. Investors who buy-and-hold are engaged in income strategy. Because they no plans to exit their position, their only source of returns is cash flow from dividends (or debt repayments). Investors who plan to exit the investment, on the other hand, are looking to realize a
capital gain, or an appreciation in the value of the asset. 4.2 Corporate Investors
Infrastructure owners and operators are traditionally the most heavily invested private players in EMDE infrastructure, providing scarce developer equity and often leading project consortia as general partner. They typically hold large portions of completion risk, demand risk and operational risk, and are the principal beneficiaries of lower operating costs65. Their influence begins "up-stream" and often lasts, in changed forms, for the entire length of the project. Operators and developers tend to be, by definition, large construction companies which enjoy economies of scale from a strong regional presence, or from complementary business lines. Mining companies, for instance, have often built complementary infrastructure such as roads or rail tracks necessary to get their products to market. Developers typically have the largest influence on timing and structure of capital expenditures because they assume construction risk and thus higher up-front capital costs. They also face greater complexity since they are involved in projects from conception, which makes
them well-placed to influence the sustainability of the asset.
While increasing corporate investment shares to sustainable infrastructure would be highly desirable, the problem is that corporate investors have similar perceptions about risks and returns that influence other investors, and they require risk-adjusted rates of return on invested capital (ROIC) of between 5% to 10% for new investments. Investment decisions rest on how well a project meets these requirements, as well as other company-specific strategic choices.
However, there are problems in estimating private rates of return, particularly among equity holders such as corporate investors, because "the required rate of return or discount rate for individual investors is fundamentally unobservable: it cannot be inferred from observable transaction prices because it is both a function of the characteristics of the asset (e.g. cash flow volatility) and individual investor preferences" 6. In addition, "using constant and deterministic
35
"' McKinsey 2016, p.1 4
discount rates is defective if projects have multiple phases and project risk changes over time as real-options are exercised by asset owners"".'
4.3 Institutional Investors
Attracting new types of investors, who may be unfamiliar with infrastructure but who have
significant assets is a necessity to close the infrastructure gap68. Chief among these new types are institutional
investors, which have had limited direct exposure to infrastructure finance, but which hold vast assets under management (AUM). Policy makers have made a priority of searching for new ways to finance sustainable long-term growth. Meanwhile, pensions funds and other institutional investors have recognized the need for long-term financial instruments to match their long-term commitments, in the form of pension or insurance payouts. Indirectly, institutional investors have invested in infrastructure as limited partners in unlisted private equity firms. However this role has left them with less leverage in shaping projects69 than corporations. They
have been able to negotiate a price for their capital, but for operational and project-design decisions which shape sustainability, they have in the past been too late. They have not had significant exposure to
infrastructure and as a result they are cautious7 0.
Survey data (Figure 14) shows that despite having similar strategies, types institutional investor are heterogeneous in their asset-allocation preferences regarding infrastructure. However one thing they have in common is that they are unable to meet their target allocation. This gap between target and current
allocations is, according to McKinsey, worth $120 billion per year between 2015 and 2030.
Banks hold by far the most AUM of all institutional investors, and they are the most important source of debt finance for infrastructure projects. In EMDEs, for instance, more than 80% of assets are owned by banks, pensions and insurance companies, suggesting that a tailored approach to these investors offers great potential to boost private participation. Banks can also take the lead on loan syndication, improving liquidity, or they can act as loan-takers for another arranging entity, such as an MDB. Domestic
EMDE private sector banks play a hugely important role because they have the best local knowledge, are
comfortable with 50-year long exposures to their domestic market, and they also offer the most astute understanding of local political risks, and they can lend in local currency - allowing projects to match revenue risks with debt service risks71.
68 McKinsey 2016, p.1 7 "9 McKinsey 2016, p.1 5-1 6
7 McKinsey 2016, p.5 71 McKinsey 2016, p.14
Figurc 12: Average Current and Target Allocation by Investor Type, Source: Pretlin (2016) p.3 6 7-I' a C ~ct *4 I S *j'j Si 4 4< N 45< V 1* I W "7 -N ~
In contrast to banks, 11ve strl mnt companies, insurance companies and pension funds are all alike in
risk preferences and tend to be subject to similar levels of regulation. Collectively, these three investor types represent 31"o of world AUM. Tihey are the classic "nid-stream" investors who in the past invested when assets wre operating and able to provide steady cash flows that allow these investors to meet ongoing
customer obligations.
A unique itixvestor type is the sovereign wealth fund. With around 3% of world AUM, these investors are not large, but they can afford to take longer-term views and demand less liquidity as part of their
investment strategy7" Other investors include P] K funds, which invest in unlisted equity (discussed below) and are atmong the most expensive sources of private capital-, which take 'opportunisitc' strategies with a focus
on exit value instead of capturing the full tenor of infrastructure investments.
M IcKinsey 2016, p.15 McKinsey 2016, p.1 6
4.4 The Importance of De-Risking
It is often suggested74 that to influence the actions of private investors, one can simply offer
increased returns. However, this is fundamentally a misunderstanding of risk-adjusted returns because a higher return alone has no impact on volatility. It may even raise the risk of expropriation.
The fundamental principle75 of sound project financing is that risks should be allocated to and borne
by the party which is best able to manage or control them. Wherever there is a risk which can be controlled by a contractual party, therefore, it should be allocated accordingly. If it is a market-wide risk, then
government should bear the risk (Figure 7), and it is a project-specific risk, then the private partner is best placed to mitigate. Other risks which cannot be controlled can be mitigated through contracts or they can be hedged. However when this does not happen, risks are retained by the SPV and its investors. By itself, therefore, a greater return does not provide a compelling reason to invest and for this reason, private investors in EMDEs often "avoid infrastructure like the plague"76. To some extent project finance invites
risk-taking which is sometimes "accepted with an aggressiveness towards a risk that is unsupported by the probabilities of the risk materializing"77. Accepting risk in this manner can come with a high price to the project, such as when a government loses control of an inflation risk it was not well placed to mitigate. However, even if the price is not high, misallocation of risks creates a situation in which "the party shortchanged is a primes candidate to trigger a project disaster."78
Increasing a return thus equates to asking an investor to hold a risk in exchange for a risk-premium,
instead of allocating the risk. It has no impact on the volatility of expected returns. An offer of increased returns alone is thus a red-flag representing a failure of project structuring. Such an approach is anathema to private infrastructure investors because "successfprlpjectfinance structuring rests on the strength of the project itsef. Ident/jdng the project's risks and then anaying, allocating, and mitigating them are the essentials ofprojectfinaning. 7
Increasing a return is a risk transfer to the private sector, rather than a risk mitigation. When the risk
transferred is something which the private partner cannot mitigate well, then the associated risk premium will be high, significantly increasing funding costs for the government or resulting in a total failure to attract an investor.
74 Zuckerman, Frejova, Granoff and Nelson 2016
75Deep 2001, p.2 1 9
76 Source: survey response. 77 Hoffman 2007 p.5 1
7 Hoffman 2007 p.51
79 IFC 1999, p.3 8
P1K firms with 'opportunistic' strategies or companies involved in the construction process are often
tile only investors willing to take on such risks as part of their equity stakes, bUt "I Iigoh-riss Cosvue i//fpromp/
/esm
A)
Setk Aiu/e/her re/lenliS /)I! char/ll'inl i>her otniSIf//OI or ;yaIn/eneance co/s." 0Figure 13: Project Risk Transfers in PPPs, Source: Ehlers (2014) p.9 High ability to control risks
I
\ N h J5t<4 uf3na<5'e &A *1-F-77 I7 I tTJ hV' acqu iilkmt wia 10mf f ate )rn ',Low ability to control risks
Indeed, increasing a return has no impact on the credit-rating of a project, which is a problem because projects in emerging markets have additional country risk, usually calculated as a sovereign bond yield spread between host country yields and the risk-free US yield. Projects with strolg economics that are also well structured in terms of risk can achieve investment-grade ratings, but the ratings of debt issued will be constrained by the credit-rating of the sovereign 1.
The ideal situation for a government hoping to enlist private finance for infrastructure projects is this: multiple credible low-cost bids from investors who are looking to hold the asset for its lifetimne.
icreasing returns provides the opposite situation: very few if any bids which are likely to be high-cost and from investor types whose strategies are predicated upon an exit. Increasing returns is unviable to attract the level of private investment needed to close the sustainable infrastructure gap.
" lers 2014, p.7 Slritch 2004, p. t2 40