HAL Id: hal-01780328
https://hal-amu.archives-ouvertes.fr/hal-01780328
Submitted on 4 May 2018
HAL is a multi-disciplinary open access
archive for the deposit and dissemination of
sci-entific research documents, whether they are
pub-lished or not. The documents may come from
teaching and research institutions in France or
abroad, or from public or private research centers.
L’archive ouverte pluridisciplinaire HAL, est
destinée au dépôt et à la diffusion de documents
scientifiques de niveau recherche, publiés ou non,
émanant des établissements d’enseignement et de
recherche français ou étrangers, des laboratoires
publics ou privés.
Nano-clustering of ligands on surrogate antigen
presenting cells modulates T cell membrane adhesion
and organization
Pierre Dillard, Fuwei Pi, Annemarie Lellouch, Laurent Limozin, Kheya
Sengupta
To cite this version:
Pierre Dillard, Fuwei Pi, Annemarie Lellouch, Laurent Limozin, Kheya Sengupta. Nano-clustering of
ligands on surrogate antigen presenting cells modulates T cell membrane adhesion and organization.
Integrative biology, Royal Society of Chemistry, 2016, 8 (3), pp.287 - 301. �10.1039/C5IB00293A�.
�hal-01780328�
Nano-clustering of ligands on surrogate Antigen
Pre-senting Cells modulates T cell membrane adhesion
and organization
Pierre Dillard∗§†, Fuwei Pi∗†‡, Annemarie C. Lellouch§, Laurent Limozin§k and Kheya
Sengupta∗k
We investigate adhesion and molecular organization of the plasma membrane of T lymphocytes interacting with a surrogate antigen presenting cell comprising glass supported ordered arrays of antibody (α-CD3) nano-dots dispersed in a non-adhesive matrix of polyethylene glycol (PEG). The local membrane adhesion and topography, as well as the distribution of the T cell receptors (TCRs) and the kinase ZAP-70, is influenced by dot-geometry, whereas cell spreading area is determined by the overall average density of the ligands rather than specific characteristics of the dots. TCR clusters are recruited preferentially to the nano-dots and the TCR cluster size distribution has a weak dot-size dependence. On the patterns, the clusters are larger, more numerous, and more enriched in TCR, as compared to the homogeneously distributed ligands at comparable concentrations. These observations support the idea that non-ligated TCR residing in the non-adhered parts of the proximal membrane are able to diffuse and enrich the existing clusters at the ligand dots. However, long distance transport is impaired and cluster centralization in form of a central Supramolecular cluster (cSMAC) is not observed. Time-lapse imaging of early cell-surface contacts indicates that the ZAP-70 microclusters are directly recruited to the site of the antibody dots and this process is concomitant with membrane adhesion. These results together point to a complex interplay of adhesion, molecular organization and activation in response to spatially modulated stimulation.
1
Introduction
Many cell membrane proteins are organized in the form of clus-ters on the membrane (see, for example, recent reviews1,2, and references therein). Their spatial arrangement and dynamic re-organization play a decisive role in cell adhesion and signaling. In the context of adhesion of tissue forming cells, focal adhesions exemplify the exquisite arrangement and hierarchical binding of proteins in the form of clusters that exhibit considerable dynam-ics3,4.
∗ Aix-Marseille Université, CNRS, CINaM-UMR 7325, Marseille, 13288, France. § Laboratoire Adhésion & Inflammation A ix-Marseille U niversité \ I nserm U 1067 \ CNRS-UMR7333, Marseille 13288, France.
† These authors contributed equally to this work.
k Corresponding authors: sengupta@cinam.univ-mrs.fr, laurent.limozin@inserm.fr
‡ Current Address: State Key Laboratory of Food Science and Technology, School of Food Science of Jiangnan University,Wuxi, Jiangsu 214122,China
Clustering and reorganization of membrane proteins seems to be ubiquitous2, and is particularly pertinent for lymphocytes in
close contact with antigen presenting cells during the initiation of immune recognition, and the formation of the immunological synapse5. In the early stages of T lymphocyte adhesion to an ac-tivating surface, T cell receptors (TCR), as well as the integrins αLβ2 (LFA-1), are known to form micro-clusters (µ-clusters) at
the adhesive interface1,6–10. Studies on hybrid T cell/supported lipid bilayer (SLB) systems, where the SLB acts as a surrogate antigen presenting cell (APC)11, have shown that these clus-ters are dragged centripetally in an actin dependent manner,7–9 and finally form the supramolecular activation clusters (SMACs), which themselves span several microns5,11. A host of signaling molecules, including the kinase zeta-chain-associated protein ki-nase 70 (ZAP-70) - one of the first molecules to be recruited to the TCR complex on activation - have been shown to also form µ -clusters8,12, which may colocalize with the TCR µ-clusters. Re-cently, the TCR has been shown to be pre-clustered on the mem-brane in the form of micron or nano scale aggregates13–15.
(pMHC), is itself clustered on the plasma membrane of antigen presenting cells, prior to contact with T cells16,17 . Therefore it is highly pertinent to explore the adhesion and spreading of T cells on chemically contrasted substrates presenting micron and sub-micron scale clusters of TCR ligands.
Ever since it was demonstrated that cell survival depends on the size of the adhesion footprint19, chemically structured sur-faces have been used extensively to examine spatial regulation in cell biology20,21. Micro-patterning has been used extensively to
study tissue cells such as fibroblasts and epithelial cells, with ex-periments ranging from manipulation of single focal adhesions, to confinement of cells for large throughput screening (see, for example, Piel et al.22 and references therein). The interaction of hematopoietic cells with patterned substrates have also been studied, though to a lesser extent. Micron scale patterning of TCR ligands has been shown to modulate the structure of the im-munological synapse, and the secretion of cytokines23. A similar approach used micro-patterning to segregate features containing antibodies against the TCR-complex (α-CD3) and the costimula-tory molecule CD28, and showed that optimal T cell activation depends on the specific geometry of the pattern and may depend on the mobility of the Src family kinase Lck within the cell mem-brane24. Patterning was also used for so-called “bait-prey" assays
where a micro-pattern of antibodies recruits a membrane protein - the bait (CD4) - which in turn allows the in situ study of the re-cruitment of a prey molecule Lck25. Recently, the complementary
role of TCR and LFA1 in organizing the actin cytoskeleton was probed by micro-patterning of α-CD3 and ICAM-1 molecules26.
A very different kind of patterning has been used to create so-called “spatial mutations" in T cells adhering to supported lipid bilayers spatially partitioned into corrals. These experiments have revealed a wealth of information, including the fact that the radial location of TCRs correlates with their signalling capacity27, and
that just two molecules of agonist TCR in a µ-cluster is sufficient to activate a T cell28.
In tissue cells, nano-patterning of molecules at a scale much smaller than individual focal adhesions has revealed that varia-tions in sub-micron/nano-scale organization impact adhesion and signaling29,30. The dependence of the adhesion response on pat-tern geometry has been related to the size of talin, a cytoplasmic protein that binds the intracellular portion of many integrins and stablises focal adhesions by linking the integrin to the cytoskele-ton31. The issue of relevant length scale is however still debated
for T cells interacting with either pMHC molecules or with α-CD332–34.
In the past few years, many different kinds of techniques have been proposed for bio-nanopatterning of surfaces for fundamen-tal studies in cell biology35. One of the earliest methods used
suc-cessfully was dip-pen lithography36but its use remains restricted due to the time-consuming nature arising from the need for fea-ture by feafea-ture printing that is not fully overcome even by mas-sive parallelization37. Creation of chemical contrast by e-beam
This is especially true for peptide-MHC class I. Much less is know about MHC class II18.
lithography, which is subsequently used to recruit the relevant proteins, is an option but is limited due to its high cost. A tech-nique that held a lot of promise was nano-contact printing, in imitation of the very popular and successful µ-contact printing, but scaling down is proving to be difficult due to deformation of the stamp. Use of di-block micelle assisted self-assembled gold nano-dots is currently the most successful strategy29,30. However, since gold interacts strongly with light, the applicability of gold-based substrates for certain kinds of imaging could, in principle, be restricted.
Colloidal bead lithography has been proposed as an alterna-tive, and has been used either with gold chemistry38or with an all-organic approach39. The latter metal-free approach is com-patible with TIRF and RICM imaging39,40, and is the technique of choice here. Our implementation has the additional advantage of offering variable pitch and dot-size.
An important aspect of such patterning, that has often been ignored, is the nature of the passive surface in-between the ad-hesive or activating features. PEG is often used as a repellent and can be thought of as a surrogate glycocalyx. The role of the glycocalyx in cell adhesion is a debated subject41, but it is clear that cells modulate their adhesive interactions by modulating the density and the thickness of the glycocalyx42–45. Here we create patterns of alternating activating and passive zones which can create spatial mutations on T cells at the nano-scale, which are reminiscent of those created with µ-barriers in supported lipid bi-layers27, at the same time allowing “bait-prey" type of assays, for example in the context of ZAP-70 recruitment.
The mechanism and consequence of receptor clustering is an important open question in cell biology in general46, and for T cell/APC interactions in particular1,14,47. While the attention was so far focused on the T cell side, with TCR µ-clusters that are now indisputably recognized as the primary functional signalling unit for T cells and are thought to be pre-clustered on the T cell sur-face, less attention has been paid to the emerging evidence that the TCR ligands, ie. pMHC molecules, are also pre-clustered on the APC side16,17,48. Here we engineer surfaces with controlled clusters of antibodies against the TCR complex, to mimic the pre-sentation of TCR ligands on APCs, and report the consequences for the T-cell arising from such nano-scaled patterning in ligand presentation.
2
Experimental Methods
2.1 Nano-patterning of substrates
A schematic for the entire fabrication process for making the nano-patterned substrates is given in the support information (SI Figure 1).
Ultra-hydrophilic glass coverslides (thickness = 170 ± 10 µm, Assistent, Karl Hecht KG, Germany) were obtained by cleaning with oxygen plasma (Nanoplas DSB3000-6000 equipped with a SEREN R301 RF power supply, SEREN IPS, USA) at room tem-perature for 15 min, or by ultrasonication in aqueous solution of a detergent (Hellmanex, Sigma, France), followed by thorough rinsing in ultrapure water (obtained by filtering and reverse os-mosis - Elga, UK). Silica colloidal beads with diameters of 4 µm,
2 µm, or 540 nm and typical poly-dispersity of 10 to 15 % (Poly-sciences, Inc., Germany) were washed 10 times with ultra-pure water before utilisation. A glass coverslide as prepared above was set at an angle and a pre-calibrated volume of the colloidal suspension was allowed to spread on the slide. Slow evaporation at ambient conditions coupled with strategic change of the an-gle results in uniform and large area coating with a monolayer of colloidal beads (see also Pi et al.39).
Thin films of aluminium (Al) were deposited on the glass cov-erslides through the colloidal bead mask using a radio-frequency (RF) magnetron sputtering system (modified SMC600 tool by AL-CATEL, France) from a mixed Al(99%):Si(1%) target (purity ≥ 99.99%, Kurt J. Lesker Company, USA). The geometry of the sput-tering system is off-axis and the mean free path is ∼10 mm in the operating pressure range. Samples were placed at a distance of 105 mm from the target, on a rotating table (3-5 rpm). Af-ter deposition of Al, the primary bead mask was rinsed away by ultra-sonication in ultra-pure water for several seconds, leaving the secondary metal mask (Al-mask) with an array of pits (see also Pi et al.40).
2.2 Functionalization
The Al-mask coated slides were placed in a chamber containing (3-Aminopropyl)triethoxysilane (APTES, Sigma, France) in va-por phase, at about 60◦C for one hour. Next, biotin conjugated Bovine Serum Albumin (bBSA, Sigma, France) at a concentration of 20 µg/ml in phosphate buffered saline (PBS, Sigma, France) was incubated on the samples for 30 min. Finally, to remove the sacrificial aluminium mask and reveal the bBSA dots, the cover-slide was placed in an alkaline medium at a pH = 11.4 for 2 h at room temperature. If required, the complete removal of Al was verified by optical microscopy. The aluminium free glass slides, containing bBSA dot arrays were thoroughly rinsed with neutral PBS buffer, pH = 7.2. Biotin retained its function in spite of ex-posure to high pH. At this stage the coverslide was covered with uniform nano-dots of functional bBSA, separated by an expanse of bare glass.
The bare glass separating the bBSA dots was back-filled with a diblock copolymer of poly-L-lysine and poly(ethylene glycol) (PLL-PEG), via incubation in PLL(20)-g(3.5)-PEG(5) copolymer (Susos, Switzerland) dissolved in PBS at a chosen concentration (100 µg/ml for dense layer and 10 µg/ml for sparse layer) for 30 min. The PLL moiety, being positively charged, readily binds to glass, which is negatively charged at neutral pH after cleaning. The PEG moiety remains unbound and discourages further pro-tein binding. The PLL-PEG does not significantly bind to the bBSA dots as verified by using fluorescent PLL-PEG (data not shown). For T-cell adhesion studies, substrates were further functional-ized by incubation with 2 µg/ml neutravidin (or neutravidin Tex-asRed, Invitrogen, USA) for 30 min, followed by incubation in α -CD3 at 2 µ g/ml (multibiotinylated UCHT1, Beckman Coulter, France, or for SI Figure 2, monobiotinylated fluorescent labeled OKT3) for 30 min.
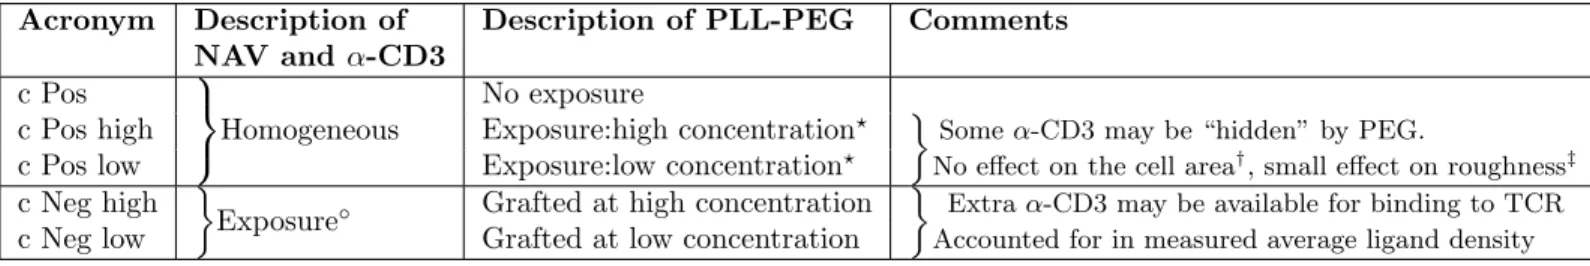
Positive controls (c Pos) were prepared as described previ-ously49, and were in certain cases exposed additionally to
appro-priate amounts of PLL-PEG (c Pos low and c Pos high). Negative controls were prepared by incubation of appropriate amounts of PLL-PEG on bare glass cleaned as above, and were exposed to ap-propriate amount of neutravidin and α-CD3 (c Neg low and c Neg high). The characteristics of the five controls are summarized in a table in supporting information. In addition, on negative controls (corresponding to c Neg high or low) with no exposure to α-CD3, cells do not adhere at all.
2.3 Cell culture, fixation and labeling
Jurkat T lymphocytes (Clone E6-1, ATCC, referred hence forth as WT) were cultivated in RPMI 1640 complete medium supple-mented with 10% Fetal Bovine Serum (Life Technologies,France) and with 25 mM GlutaMAX (Life Technologies). Cells were in ex-ponential growth phase at the time of activation. The functional-ized glass coverslides formed the bottom of a custom made cham-ber which was filled with HEPES-BSA buffer (20 mM HEPES, pH=7.2, 137 mM NaCl, 5 mM KCl, 0.7 mM Na2HPO4, 4 mM
D-glucose, 2 mM MgCl2, 1 mM CaCl2, 1% BSA). 250 µl of the
medium containing cells was added. The cells were allowed to sediment on to the substrate and were either observed live at 37
◦C, or were incubated for 30 min at 37◦C 5% CO
2. Cells were
then fixed by incubation in 2% pre-warmed paraformaldehyde for 15 min at 37◦C, followed by extensive rinsing with PBS. The cells
were blocked with 1 % BSA overnight and immunostained by in-cubation with 5 µg/ml of FITC labeled anti-vβ 8 (BD Biosciences, USA), which is directed against the beta chain of the T-cell recep-tor, and/or with Alexa-488 or Rhodamine conjugated phalloidin (Life Technologies, USA) to label filamentous actin, during 60 and 45 min. respectively. Samples were rinsed extensively be-fore imaging. In other experiments two variants of the WT Jurkat cells were employed which stably express either the protein tyro-sine kinase ZAP-70 in fusion with GFP (ZAP-GFP) or a membrane anchored GFP (Mem-GFP). ZAP-GFP has been described previ-ously50. Mem-GFP was created by amplifying the GFP coding sequencing using a coding primer that encodes the N-terminal 13 amino acids of the murine tyrosine kinase Lck. The amplified product was first captured in to pGEMTZ before cloning into the HindIII/EcoRI sites of pCDNA3.1. The resulting fusion protein, where the Lck sequence is fused to the N-terminus of the GFP, is directed to the cytoplasmic membrane via the myristylation and palmitoylation sites within Lck derived sequence. Wild type E6 Jurkat cell lines were nucleofected with the Amaxa electro-poration system using Solution V, program S-018 (Lonza, Basel, Switzerland). Stable transfectants were created by culturing the cells in the presence of 1.2 mg/mL G-418 (Gibco, Carlsbad CA, USA), sorting for GFP positive cells, and cloning by limiting di-lution. All clones were evaluated for TCR expression by flow cy-tometry before use (α-CD3 epsilon clone OKT3, BD Bioscience) and clones with TCR expression levels similar to the WT Jurkat parent line were selected for study.
2.4 Microscopy
Total internal reflection microscopy (TIRFM) and reflection in-terference contrast microscopy (RICM) were performed using an
inverted microscope (AxioObserver, Zeiss, Goettingen, Germany), equipped with an EM-CCD camera (iXon, Andor, Belfast, North-Ireland). Acquisition was performed using Andor iQ software, Micro-Manager51(ImageJ) or ZEN (Zeiss). TIRF and RICM im-ages were taken with a 100X 1.45 NA oil or a custom 100X 1.46 NA oil antiflex objective (Zeiss). For TIRF exposure time was 1 s and fluorescence filter set adapted to Alexa488 or Rhodamine was used. The Atto647 fluorophore was imaged in epifluores-cence illumination. To enlarge the field of view, RICM images and time sequences were taken also with a 63x 1.25 NA oil anti-flex objective (Zeiss). Exposure time was 100 to 300 ms. Confo-cal images were taken with a Leica confoConfo-cal microscope equipped with a 63X, NA 1.4 oil objective.
2.5 Image Analysis
Image analysis was performed using macros written in house in ImageJ/FIJI and IgorPro (Wavemetrics). The nano-dot arrays were analyzed in terms of lattice and motif characteristics. The corresponding patterns formed on the cell membrane were ana-lyzed by first determining the location of each cell as well as the coordinates of the underlying dots, and then using these values as the basis for a dot by dot analysis. The lattice: Fast Fourier Transform of the fluorescent image of the pattern in NAV chan-nel provided a qualitative assessment of the lattice ordering. The distribution of dot-pair distance was also calculated based on in-dividual dots position as described below. The location of the first peak of this distribution was taken as the pitch of the lattice. The
motifs: The dot-motif was assumed to be centro-symmetric and
characterized using an automated algorithm in terms of the con-trast and full-width at half maximum (FWHM) of the radial pro-file of fluorescence as performed on individual dots. For this, each dot was detected on the fluorescence image by simple thresh-olding of the intensity and its location estimated by the position of the center-of-mass of fluorescence intensity. A radial profile was calculated and used to estimate the contrast as defined by (Imax− IMin)/(Imax+ IMin) and FWHM. For a given experimental
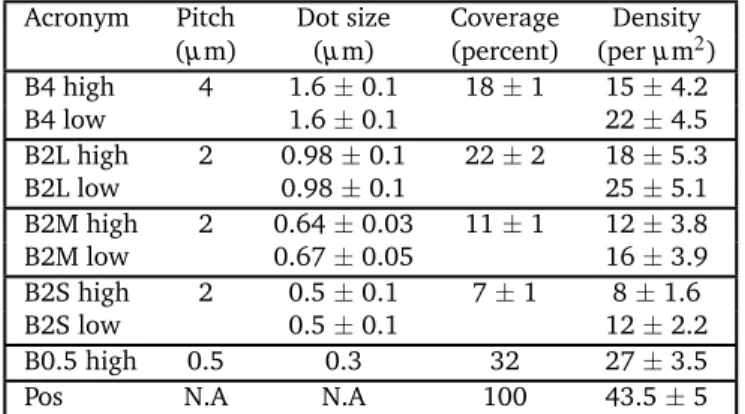
condition defining the patterns features, the parameters repre-sented in Figure 1 represent the median of the dot ensemble and the error bar is the median absolute deviation. The values re-ported in Table 1 are determined manually from intensity profiles of at least 30 dots . Percentage coverage quantifies the proportion of activating surface with respect to the total area, calculated by averaging over an area much larger than the dot-size. All error bars are standard deviations unless otherwise stated.
Cells were analyzed for both global and local properties.
Cell-scale: Cell adhesion was characterised globally based on the RICM
images in terms of adhesion area and membrane roughness. Cell contour was determined from RICM images using a spatial vari-ance filter (applied on a disk of radius 0.64 to 0.8 µm) and thresh-olding, providing an accurate measurement of the contact area, as previously described49. Dark area was determined by
inten-sity thresholding of the segmented RICM image. Additionally, the
Rasband, W.S., ImageJ, U. S. National Institutes of Health, Bethesda, Maryland, USA, http://imagej.nih.gov/ij/, 1997-2014.
average of the spatial standard deviation of the RICM intensity (normalized by the background intensity) was reported as a mea-surement of the membrane roughness. Dot-scale: When multidi-mensional images were available (RICM/dot pattern/fluorescent label of cell), we analyzed the fluorescent label of cell in rela-tion with the underlying dots on the substrate. The center of the dots of the array within the contour of the cell (defined as above from the RICM image), was determined by direct thresholding as above. The centre of each dot was taken as the origin to define a region of interest on the label image and a radial profile. The me-dian image of a dot was built pixel by pixel by taking the meme-dian value calculated on all individual dots at each pixel. Contrast and FWHM of the label motif was defined as above.
TCR-clusters: The fluorescent images of TCR were prepared in
ImageJ, by first a de-noising step (3X3 median filter), and then segmenting the cells using the corresponding RICM image as de-scribed above. An iterative intensity thresholding algorithm was used to segment the clusters. The realization of this algorithm as a plugin written for ImageJ was kindly provided by Dr. Ra-jat Varma13. The algorithm uses an initial intensity threshold
(here taken to be the mean intensity under the cell but outside the clusters), an upper cutoff for cluster size (here 4 pixels), a step value for convergence (0.05) and a cutoff value to deter-mine how much to trim each cluster (here 0.8). We verified that the output is robust against small variations in all these parame-ters. All the parameters were kept constant across samples, except the initial intensity threshold, which was set approximately to the background intensity (excluding TCR clusters) within the cell un-der consiun-deration. The algorithm outputs the size of the clusters, the number of clusters per cell, and the average intensity in each cluster. This information was directly used to construct the size histograms. The cluster density was calculated by dividing the number of clusters in a cell by the area of the cell as determined from segmentation of RICM image. The average cluster intensity was normalized by the average intensity under the cell to com-pensate for possible differences in the level of immunostaining. To quantify the centralization of TCR, we defined a cSMAC num-ber as the ratio of the total intensity in the cell and the intensity within a circle of 2 µm centered on the centroid of the intensity distribution (see Dillard et al.49for details).
Statistical tests and errors The Student T univariate bilateral
test, implemented in R (http://www.r-project.org/) was used to determine significance levels. Throughout, *** signifies P < 0.001, ** signifies P < 0.005. Error bars are standard deviations unless stated otherwise.
3
Results and Discussion
3.1 Characterisation of the nano-dot array
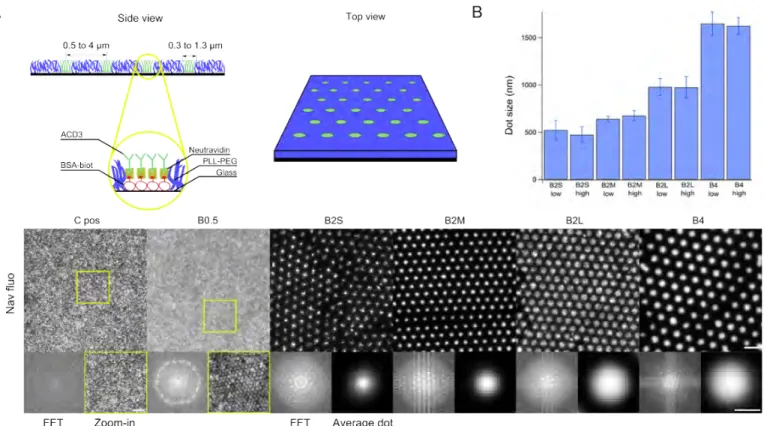
The protein pattern was created using Nano-sphere Lithography (NL), combined with metal sputtering, followed by sequential functionalization with bio-molecules. The resultant patterns are in the form of antibody nano-dots arranged in a hexagonal array. The distance between the dots (pitch) can be varied by choosing different bead-sizes for the NL and the dot size can be changed by exploiting shadow effects during metal deposition40. The dots
comprise a first layer of BSA-biotin to which fluorescent labeled neutravidin (NAV) is bound, which in turn acts as a linker to bind the biotinylated antibody α-CD3ε (Figure 1A). The antibody is expected to bind strongly and uniformly to the neutravidin, and we ascertained that indeed it is patterned similarly to the underly-ing neutravidin dots (SI Figure 2). These composite protein dots are subsequently referred to here simply as dots. The dots are separated by a co-polymer of poly-L-lysine and poly ethylene gly-col (PLL-PEG, for simplicity here called the PEG layer). The PLL is bound to the negatively charged glass, and the hydrophilic and uncharged PEG side chains extend into the aqueous phase52,53.
The dots are imaged in epi-fluorescence (Figure 1) and charac-terized at the lattice as well as motif level. Table 1 summarizes the various types of patterns, which are named according to their characteristics. B0.5, B2 and B4 signifying pitch of 0.5, 2 and 4 µ m respectively, and L, M or S signifying large, medium or small sized dots with 2 µm pitch. The labels "high" or "low" refer to the surface density of PEG.
The regularity of the lattice, which reflects the global arrange-ment of the dots, can be inferred from the Fourier transform (FFT) of images of the dot-fields. As shown in Figure 1, the FFTs of the dots typically exhibit several diffraction orders showing that spa-tial ordering is long range. The only exception is B0.5, where the broken ring indicates good positional order but limited orienta-tional order. The dots are further characterized locally by anal-ysis of epi-fluorescence images. To illustrate a "typical" dot, we construct a median image as explained in Methods section. The dot-size expressed as the full width at half maximum (FWHM) does not depend on the surface density of PEG but depends on the parameters set by the fabrication process (Figure 1 and table 1).
Imaging with an atomic force microscope revealed a small dif-ference in layer thickness (about 5 nm) between the two surface concentrations of PLL-PEG (SI Figure 3).
Since the area covered in α-CD3 depends on the dot size and spacing, the overall average ligand-density also varies according to the dot characteristics. For each case, the average ligand-density is slightly lower for high PEG. The ligand-ligand-density outside the dots is weakly influenced by the PEG (about 10 /µm2on
av-erage). The ligand-density inside the dots is more strongly influ-enced by the PEG, and varies between about 40 and 60 /µm2for
low and between 20 and 45 for high (SI Figure 4).
3.2 Quantification of global cell spreading
Cells from the Jurkat T cell line were allowed to interact with the substrate for thirty minutes, and were then fixed, labeled appro-priately, and observed. Due to the slower dynamics of spread-ing on the patterns, as compared to homogeneously coated sub-strates49, the cell is at its peak spread area at thirty minutes. The
region of contact between the proximal surface of the cell and the patterned substrate was imaged with reflection interference
B0.5 is an exception because the dots are too closely spaced for characterization of size with optical microscopy due to the diffraction limit. In this case, the size was measured by atomic force microscopy imaging, as reported in Pi et al.40.
contrast microscopy (RICM). For the settings used, RICM images those parts of the membrane that are at a distance of at most 2 µ m from the surface54. This region of proximal cell surface to substrate contact is called the contact zone and the area of this zone, called the contact area, is a measure of cell spreading. Note that in the contact zone the membrane may not be tightly adhered everywhere, but it is in close proximity to the substrate and can potentially interact with it.
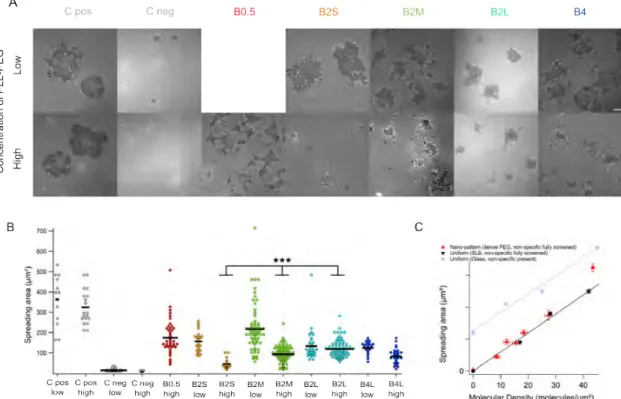
The contact area is strongly influenced by the quality of the underlying polymer cushion (Figure 2A). On the layers with low PEG density, the cells consistently spread better than high PEG density case and are more circular. On high PEG density, the cells often exhibit a complex shape. In particular, on the smallest dots (B0.5) the cells spread relatively well but exhibit a very irregular boundary. For the case of 2µm spacing, the cells adhere more as the dot size increases, but the shape remains irregular. Finally, for B4, the contour of the contact area seems to follow the shape of the underlying dots - again resulting in an irregular boundary.
Quantification of the contact area confirms that for each kind of underlying dot-pattern, cells on low PEG density have a larger contact area than those on the layer with high PEG density. Con-trol experiments on surfaces coated with PLL-PEG alone show the same trend (2A, cell area 32 ± 10 µm2 for low, compared to 12
± 5 µm2for high - note that the latter value is exaggerated
be-cause many non-adherent cells, with very low area, are washed away during fixation and are not counted in the average). For both cases, the adhesion is significantly lower than on any of the patterns (Figure 2B). For surfaces uniformly coated with the lig-and lig-and exposed to the two different PLL-PEG concentrations at the appropriate step during functionalization, the cell adhesion is not appreciably different for the two cases (positive controls in Figure 2).
In case of high PEG surface density, the average molecular density of the ligands on the substrate determines the contact area, which increases monotonically with increasing ligand den-sity (Figure 2C). The average ligand denden-sity is primarily deter-mined by the surface coverage and secondarily by the density of the ligands inside the dots (SI Figure 4). The contact area uniquely depends on this average molecular density but does not depend separately on the dot-size or spacing (as also indicated by calculation of Pearson correlation coefficients, SI Figure 5). To verify this hypothesis, we compared the contact area on patterned substrates with control substrates exhibiting an equivalent aver-age molecular density of the ligands, but where molecules are uniformly distributed. Two cases were studied – in the first, the ligands are grafted on a supported lipid bilayer but are immobile; this is expected to fully screen all non-specific interactions. In the second, the ligands are grafted on glass via linkers; a residual adhesion (non-zero contact area) in absence of any α-CD3 point to the presence of non-specific interactions49. The comparison
presented in Figure 2C shows that the average ligand-density is in fact the control parameter, when the non-specific interaction is correctly blocked, either by using a supported lipid bilayer, or in the case of patterned substrates, with dense PEG. For sparse PEG, were the non-specific interaction is not fully screened, the cor-relation between cell spreading and ligand-density is not evident
(SI Figure 6).
We show above that when the non-specific attraction is fully screened, the extent of spreading is determined by the
aver-age number of activating molecules per unit area, irrespective of
whether they are presented as clusters or are homogeneously dis-tributed. Interestingly, using a combination of pMHC nano and micronanopatterns, it was shown by Deeg et al.32 and Matic et
al.33 that the total number of ligands encountered by the cell, rather that a local peak ligand-density, determines the propor-tion of spreading and activating cells, seemingly contradicting previous experiments with corralled SLBs with mobile ligands by Manz et al.28, which showed that the minimal number of
MHC available per TCR, rather than the total amount seen by the cell, determines cell activation. However, contrary to Manz et al., the present study (or that of Deeg/Matic et al.) does not use LFA-1/ICAM-1 bonds to ensure cell adhesion. Instead, the α-CD3 molecules take on a dual adhesive and activating role6,49,55.
On immobilized ligands the extent of T cell spreading has been shown to be a good indicator of cell activation and prolifera-tion56, but this is not the case for mobile ligands. The contact area is in fact lowered without affecting the level of activation49, perhaps since the ligands can gather under the cell, increasing their density locally. Thus our observations confirm the results of Deeg et al32that the extent of T-cell activation, here evidenced
by its spreading, is determined by average ligand-density when mediated by immobilized ligands.
3.3 Local organization of the membrane
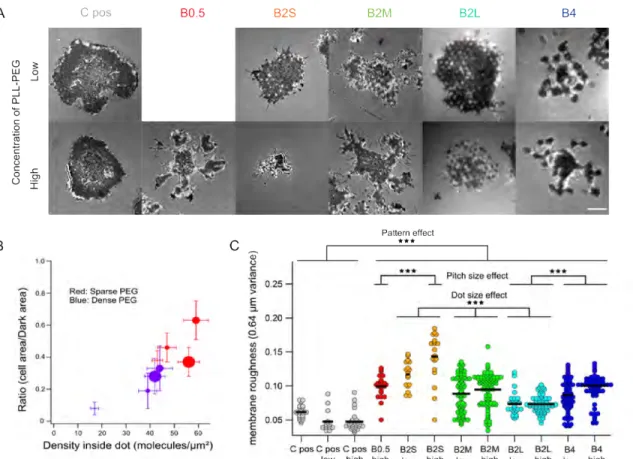
In addition to determining the contact area as above, RICM im-ages also reflect the topography of the proximal membrane since the level of gray in the RICM image is determined by the local distance between the membrane and the surface, typically go-ing from dark to bright and dark again as the distance changes from nearly zero to about hundred nanometer and beyond54. In general, darker pixels correspond to tightly adhered membrane. Here, the proximal membrane topography, i.e. the membrane to surface distance, is modulated locally by the dots (Figure 3A). Since the absolute value of the tight adhesion area is influenced by the overall contact area, we normalize the dark area in RICM by the contact area in order to access membrane adhesion in-dependent of cell spreading. This dark area ratio is strongly di-minished on high PEG surfaces (SI Figure 7). Overall, for the high PEG surfaces, the ratio shows a clear correlation with the average molecular density of the ligands, but does not show any overall clear dependence on the average ligand-density when the low PEG data are included (SI Figure 8). However, when the low and high PEG data are considered together, a strong correlation between the dark area ratio and the molecular density of the lig-ands inside the dots is found (see Pearson coefficients in SI Figure 5). The dark area ratio is plotted in Figure 3B as a function of the inside-density and shows a clear dependence. We conclude that the local membrane tight adhesion is determined by the local lig-and density.
Another way to quantify the variations in membrane adhesion is through the analysis of membrane roughness, which is an
in-dicator of variations in distance between the T cell membrane and the substrate. The roughness can be considered to be a more robust indicator than calculation of the dark area of tight adhe-sion since it circumvents possible problems arising from image thresholding54,57. We find that the membrane roughness is in-versely correlated with ligand-density inside the dots as well as average ligand-density and coverage (Figure 3). The roughness on patterned substrates is always significantly different from the positive controls (P < 0.001), as well as between different pitch or dot sizes, and within each type of dot, the roughness depends weakly on the PEG density (Figure 3C). While it is difficult to re-late the roughness directly to the properties of the dots, it is clear that for both sparse and dense PEG, the patterns have the ability to modulate the membrane in a specific and pattern dependent manner.
3.4 Local and cell-scale organization of TCR
The distribution of TCR was imaged in TIRF-M (Figure 4) by stain-ing after fixation with an antibody against the β chain of the TCR molecules (anti-Vβ 8). Historically, TCR µ-clusters were first iden-tified in live T cells labelled with anti-Vβ 8 and interacting with α-CD3 immobilized on glass, as features enriched in TCR molecules which function as signalling assemblies6(see also SI Figure 9 and corresponding discussion). Later, using glass supported bilayers carrying mobile ligands, they were shown to undergo actin de-pendent translocation on the cell membrane without losing their structural cohesion10and to eventually centralize to form the
cS-MAC with the size of several microns11. On immobilized ligands (corresponding to our positive control) however, only small clus-ters are observed even at late times (30 minutes in the present case). In the following discussion, we assume that a local enrich-ment of TCR, detectable in TIRF microscopy, represents a TCR cluster. It will be seen that on the patterns, in addition to µ-clusters, larger µ-clusters, with size comparable to the cSMAC are also detected.
The cluster characteristics were quantified using an algorithm that identifies them based on an initial intensity threshold fol-lowed by iterative segmentation13. We report the cluster size dis-tribution, cluster intensity normalized by the average fluorescent intensity under the cell, and cluster density, ie. number per unit area (Figure 4). Visual inspection of the images (Figure 4 and SI Figure 10), show that as expected, Pos has a small population of sub-micron clusters . On B0.5, where the dot size is considerably smaller than the typical TCR µ-cluster size of 1µm13reported for
mobile TCR-ligands, the TCR cluster distribution is random but larger clusters may be seen. On B2M the TCR-microclusters co-localize with the underlying dots have roughly the same size (see section 3.6 for further size analysis for B2M). The TCR clusters follow the underlying dots so well that the FFT of their images show the underlying hexagonal symmetry (Figure 4A, B2M). In-terestingly, in this case, comparison with RICM images show that the TCR clusters are also present in the finger-like structures
em-The α-CD3 present on the pattern targets the ε chain of the CD3 associated with the TCR complex and therefore the two antibodies do not interfere.
anating from the cells. On B4, in addition to sub-micron clusters, very large clusters comparable in size to the underlying dots, and having complex internal organization, are often detected. The TCR clusters are partly localized within the area defined by the underlying dots.
Quantification shows that the number density of clusters (Fig-ure 4B), the maximum cluster size (grey arrow, Fig(Fig-ure 4C) and the average intensity within a cluster (Figure 4D) are all greater on the patterns as compared to C Pos, but do not depend on the specific pattern characteristics. Note that the average density of ligands on c Pos (about 40/µm2) is much higher than the
aver-age on the patterns and is comparable to the surface density of ligands inside the dots (about 20-40 /µm2, see section 3.1).
Closer inspection of the histogram of size distribution, normal-ized by cell area and thus representing the density of clusters of each size-bin (SI Figure 10B) shows that the density of all sizes of clusters is least for Pos and highest for B4. Furthermore, the size distribution histogram normalized by the total number of clusters for each case (Figure 4C and SI Figure 10B), shows an increased fraction of clusters in the size range of about 0.6 to 1 µm2in 2BM
(green arrow) and in the range 3.5 to 4.5 µm2 for B4 (blue
ar-row). Few clusters of size 5 to 6 µm2is seen on all the patterns
but not on c Pos. To summarize, as compared to Pos, on the pat-tern the clusters are more numerous, larger and the TCR is more concentrated within the clusters; the cluster size weakly depends on the pattern size. These observation can be understood if we recognize that the TCR molecules in the non-adherent parts of the membrane can in fact diffuse around, just like ligated TCRs do on supported lipid bilayers, and eventually enrich existing TCR clusters at the dots. However, we see no evidence that the TCR µ -clusters are gathered into a cSMAC (SI Figure 12). The non-ligated TCR can cluster by diffusion but even after thirty minutes of engagement, we detect no sign of centralization and infer that the non-ligated TCRs are not transported by actin at the cell scale.
3.5 Early dynamics of the cell membrane and ZAP-70 clus-ters
To compare the results obtained above from cells fixed 30 minutes after engagement with behavior at early times, we followed the spreading dynamics of ZAP-70-GFP and Mem-GFP (a membrane-labeled cell-line) cells while they interacted with surfaces exhibit-ing B2M dots at low PEG surface density. The cells were allowed to sediment on to the substrate and were imaged in TIRFM. The first contact was visible as punctate structures which form pref-erentially at the site of the dots. In case of ZAP-70-GFP cells, the puncta mature to ZAP-70 clusters, which are visible at very early times - within about a minute after touch down (Figure 5A and SI movie 1). A maximal projection of a two minutes long sequence (each pixel contains the maximum intensity that it had in the course of the entire sequence) shows that many but not all the dots harbor a ZAP-70 cluster. A closer look at the individ-ual frames reveals that some clusters also disappear within the 2 min observation time. To compare this early localization with the effects arising purely from membrane dynamics, we look at the Mem-GFP cells (Figure 5B and SI movie 2). On B2M with low
PEG density, the minimum projection (each pixel contains the minimum intensity that it had in the entire sequence) shows a one-to-one correspondence between the dots and the Mem-GFP. This modulation in the intensity arises because the membrane makes stable contact with the substrate only at the site of the dots - elsewhere, the membrane makes large excursions that take it out of the zone of TIRF illumination, that is more than 200 nm above the substrate. This behaviour is also revealed by the maximal projection and the map of the intensity standard devi-ation. The fluctuation dynamics of the membrane is even more pronounced in the case of high PEG surface density.
3.6 Dot based analysis of signaling clusters
Having established that the TCR-complex co-localizes with the pattern of its ligands, we looked into the organization of the 70 kD Zeta Associated Protein kinase (ZAP-70) which is one of the first molecules to be recruited by the TCR-complex following ac-tivation. Cells expressing ZAP-70-GFP were allowed to spread on B2M, in the same way as the wild type cells above, and were fixed and observed in TIRFM. The co-localization of ZAP-GFP with the dots is less marked than the case of TCR but nevertheless the FFTs show that there is indeed some order induced in the ZAP-70 distribution (Figure 6). Interestingly, the composite image su-perposing the dots and the ZAP-70 clusters indicates only limited co-localization. This is in fact consistent with the observation in the live imaging that the ZAP-70 clusters engage and dis-engage, because ZAP-70 recruitment to the TCR is a dynamic process.
A quantitative comparison of the TCR and ZAP-70 clusters, in terms of localization of the labeled proteins with the dots, and the cluster size, is presented in Figure 7. The samples were imaged in three channels - the NAV channel to image the dots, the protein label channel to image the TCR/ZAP-70 clusters and the RICM channel to segment the cell. The image of the dots was used to find the coordinates of the antibody nano-dots. The image of the label was first segmented according to the RICM image and then the area under the cell was divided into adjacent non-overlapping square tiles centered on the antibody nano-dots. The tiles are presented in the form of an array (last column in Figure 7). This array representation provides a simple way to assess whether or not a given dot recruits a protein cluster. We used the Mem-GFP cells as control, in order to account for possible bias in TIRFM imaging arising from membrane topography. Adhered Mem-GFP cells, as observed in TIRFM, exhibit large but poorly contrasted patches which are seen to co-localize with the α-CD3 dots (last row in Figure 7A). This effect arises because the membrane ex-hibits a distinct topography, often adhering closely to the dots but being further from the substrate in the non-adhesive zones, as was already seen from RICM images and in the dynamic data.
In all three cases, there is co-localization of the label (immunos-tained TCR, ZAP-70-GFP or Mem-GFP) with the underlying dots (Figure 7A). Strikingly there is no apparent correlation between dot intensity and label intensity (SI Figure 13). There is also no obvious influence of the quality of the polymer cushion. The Mem-GFP dots, as well as the ZAP-70 dots are poorly contrasted whereas both the TCR clusters achieve at least 40% contrast
(Fig-ure 7B). The Mem-GFP dots are however, marginally larger in size than the TCR and the ZAP-70 clusters (Figure 7C), but all of these are smaller than the expected size of the dots, which is about 700 nm. A cumulative histogram of the contrast (Figure 7D) shows that while the contrast for the case of ZAP-70 with high PEG density is indistinguishable from the contrast of Mem-GFP, and is hence likely to arise from the combination of topog-raphy and TIRF effect as discussed above, the contrast for ZAP-70 with low PEG density, as well as both TCR cases, is distinct from that of the Mem-GFP and points to real clustering.
4
Conclusion
Here we showed that the cells are able to sense a chemical con-trast on the substrate, presented in the form of dots with ele-vated levels of α-CD3 inside and PEG polymer chains outside. This sensing is at a local level – the cells reorganize the molecular distribution of TCR and ZAP-70 as well as the topography of their membrane in response. Interestingly, the cell spreading response, at the global cell scale, depends not on the local α-CD3 distribu-tion but on the overall ligand density - the cells integrate the sub-micron signal and respond to the average. We established that the repulsive polymer layer not only prevents non-specific adhe-sive interaction of the cell membrane with the glass but also acts as a reservoir for unligated diffusive TCR, with the consequence that on the patterned substrates the TCR clusters are brighter and more numerous. The diffusive TCR is however not coupled to the actin retrograde flow, evidenced by the lack of centralization seen with mobile ligands on supported lipid bilayers49. Interestingly, while the spreading response is strongly dependent on the quality of the PEG layer - cell spread more on less dense PEG layer and also fail to show any correspondence between ligand density and area - the membrane organization, both in terms of area of tight contact and assembly of TCR, is independent of PEG density.
We used novel substrates exhibiting chemically contrasted nano-dot patterns to probe T cell adhesion. A crucial improve-ment here with respect to previous work is the diminution of pitch and dot size. Since the typical size of a spread T cell49 is about 300 µm2, it is essential to use sub-micron scale patterns in order
to get a reasonable number of dots under a cell. In contrast to pre-vious work where large micrometric size severely limited certain applications (e.g. large surrogate transfected cells rather than real T cells were used25), sub-micron scales could be achieved here. At nano-scale32–34 the emphasis previously was on achiev-ing sachiev-ingle-molecule islands, necessitatachiev-ing the use of gold nano-particles that scatter light and limit surface sensitive advanced imaging. The novel substrates used here, being fully compatible with RICM and TIRFM, allowed us to develop non-standard, and automated analysis protocols. These include exploitation of FFTs to infer ordering in a quick and robust manner, and quantification of localization on a dot-by-dot basis leading to fast accumulation of data for hundreds of dots.
During cell adhesion, the proximal membrane flattens and forms a more-or-less homogeneous contact with the substrate.
cited values are for Jurkat cell line used here, primary T cells are even smaller.
This zone of contact is however not perfectly flat (see for exam-ple electron microscopy image of T cell/APC interface58) since regions of close contact coexist with zones with a distinct gap between the membranes. One of the consequences is that small, but not large molecules can pass in and out of the contact zone59. Our patterning technology has permitted us to mimic such a par-tial adhesion scenario, and has shed light on the different roles that glycocalyx rich zones may play in T cell/APC interactions. On one hand, the presence of glycocalyx can modulate adhesion (Figure 2), perhaps in analogy with model membranes60,61, and on the other hand glycocalyx rich non-adhered patches act as reservoir for non-ligated TCR which seem to have a weakened or non-existent coupling to actin (Figure 4 and SI Figure 12).
The membrane topography, generated here with the help of the repulsive zones, may be particularly important in T cells since it may play a role in regulating T-cell activation, as hypothesized in the kinetic-segregation model, where CD45 or CD148 phos-phatases with long extracellular domains are excluded from zones of close T cell - APC membrane apposition mediated by the short and clustered TCR-MHC bonds42,62. Whether initially the cluster-ing occurs due to lateral interactions or an active mechanism63is
debatable but our experiments show that clustering of pMHC on the APC surface is likely to influence segregation on the T cell sur-face. It can be speculated that in analogy with the case of mucins around focal adhesions45, the presence of long molecules may improve TCR signaling.
The formation of inhomogeneous membrane topography is closely linked to TCR clustering, which is believed to be crucial for T cell signaling1,8. Recent work indicates that TCR are pre-clustered as nano or micro domains which mature upon ligation of TCR13–15,64. The focus in the literature has been on the case where the ligands (pMHC or α-CD3) are mobile. However, µ-clusters may also form on immobilized ligands6,12. In both cases,
on substrates with homogeneous distribution of ligands, the TCR µ -clusters are randomly distributed6,10,13, as is reproduced in our positive controls. The substrates used here present a third possi-bility - on the dots, the TCR is expected to be immobilized upon ligation, whereas on the passive PEG covered zones, the TCRs, presumably unligated and present either as monomers or in pre-clustered form, should be fully mobile. This allows freely diffus-ing, unligated TCRs to diffuse onto the activating dots and to rein-force the clusters already immobilized at these sites. In contrast, on fixed ligands, all the TCR are bound and immobilized soon after cell spreading, thus preventing maturation of TCR clusters (Figure 4). A typical size of about 1µm has been reported for TCR µ-clusters formed on mobile ligands13. Interestingly, using gold nano particle arrays as a sieve65, it was shown that the size of TCR µ-clusters probably reduce with ligand-density, reaching down to 80 nm for an effective agonist peptide average density of 4/µm2. Here, working with a range of average ligand density of
about 10 to 30 /µm2, we did not detect any size dependence on
density or a favoured size, instead the cluster size weakly reflects the dot-size (Figure 4). This should be interpreted in the light of the fact that here the ligated TCRs are not mobile, where as in the sieve experiment, they remain mobile on ligation. The scenario
Table 1 Characteristics of the patterned protein nano-dot arrays.
Acronym Pitch Dot size Coverage Density (µm) (µm) (percent) (per µm2) B4 high 4 1.6 ± 0.1 18 ± 1 15 ± 4.2 B4 low 1.6 ± 0.1 22 ± 4.5 B2L high 2 0.98 ± 0.1 22 ± 2 18 ± 5.3 B2L low 0.98 ± 0.1 25 ± 5.1 B2M high 2 0.64 ± 0.03 11 ± 1 12 ± 3.8 B2M low 0.67 ± 0.05 16 ± 3.9 B2S high 2 0.5 ± 0.1 7 ± 1 8 ± 1.6 B2S low 0.5 ± 0.1 12 ± 2.2 B0.5 high 0.5 0.3 32 27 ± 3.5 Pos N.A N.A 100 43.5 ± 5
The patterns are named according to their characteristics. B0.5, B2 and B4 signifying pitch (spacing) of 0.5, 2 and 4 µm respectively. B2L, B2M and B2S refer to large, medium and small sized dots with spacing of 2 µ m. The labels "high" or "low" refer to the surface density of PEG. Pos is positive control with uniform protein distribution. The dot size reported are full width at half maximum (FWHM) measured from three to ten frames of epi-fluoresce images, each containing hundreds of dots. The percentage coverage quantifies the proportion of activating surface with respect to the total area. The ligand density (averaged over an area much larger than the dot-size) is determined from quantification of images with fluorescent neutravidin. Errors are standard deviations.
presented here is consistent with the idea of TCR pre-clustering. Note that it is difficult to observe pre-clustering directly in TIRF-M since adhesion66or mechanical stimulations67can cause the cell
to be activated and therefore start forming clusters.
The late time centralization of TCR into the central supramolec-ular activation cluster (cSMAC) is actin driven10,68, and it has
been hypothesized that the TCRs (and integrins) are connected to actin through a frictional coupling49,69. Based on the fact that
we see no centralization of the free TCR (SI Figure 12), we pre-dict that this frictional coupling to actin is different for ligated or non-ligated TCR, an effect that was already predicted for LFA-149.
ZAP-70 is one of the first molecules to be recruited to the TCR complex upon ligation, and its recruitment has been taken as an indicator of TCR triggering70. Here, early contacts show frequent ZAP-70 clusters on top of the dots, supporting the idea of pre-formed TCR-CD3-ZAP70 complexes71 (Figure 5). However, at later times, colocalization of ZAP-70 with dots is poor. This is compatible with a rapid recruitment of ZAP-70 by CD3, followed by a release of the kinase by the receptor complex70. Intriguingly, a FFT signal is still measurable at late times (Figure 7), indicating that ZAP-70 conserves a global organization imposed by the dots. This points to complex dynamics between the TCR-CD3 complex and ZAP-7047, which may involve both the kinase activity and the
adaptator protein function of ZAP-7072.
The above discussion shows that at a local scale, the presenta-tion of the ligands as nano-clusters has an impact on organizapresenta-tion of the cell surface molecules and membrane configuration. At the scale of the cell however, the response, as measured from cell spreading, is independent of the specific nature of clustering and depends only on the average density of ligands. Using gold nano-dots as support, and different measures of activation like IL2
pro-duction or proliferation, both Matic et al.33and Deeg et al32also
concluded that overall activation depends on average, rather than local, densities. However, in their case, the local impact could not be probed due to the small size of the gold nano-dots.
We clearly demonstrate a dual scale of T cell response to sub-cellular patterns — locally, the cell responds at the nano-scale and restructures its molecular distribution; globally, it integrates the signal and responds to an average dose. The results presented here emphasize the need to integrate a hitherto overlooked aspect of APC membranes, namely presentation of ligands in the form of clusters, in design of surrogate APCs.
Acknowledgements
We thank Pierre-Henri Puech, Anne Pierres, Pierre Bongrand and Rajat Varma for insightful discussions, Rajat Varma for sharing analysis code and kind gift of labelled α-CD3, and for critical reading of the manuscript. KS and FP thank Anne Charrier for expert guidance with AFM, and Igor Ozerov for help with sput-tering. Nanofabrication was done at PLANETE clean-room facility. LL thanks the Labex Inform for providing a stimulating discussion forum. This work was partially funded by ANR-09-JCJC-0091 Dis-secTion and by European Research Council via grant no. 307104 FP/2007-2013/ERC-Stg SYNINTER.
References
1 M. Dustin and J. Groves, Annual Review of Biophysics, 2012,
41, 543–556.
2 C. Schuberth and R. Wedlich-Soeldner, Biochimica et
Biophys-ica Acta-Molecular Cell Research, 2015,1853, 767–774.
3 A. Bershadsky, M. Kozlov and B. Geiger, Current Opinion in
Cell Biology, 2006,18, 472–481.
4 C.-h. Yu, N. Rafiq, A. Krishnasamy, K. Hartman, G. Jones, A. Bershadsky and M. Sheetz, Cell Reports, 2013, 5, 1456–
1468.
5 C. R. Monks, B. A. Freiberg, H. Kupfer, N. Sciaky and A. Kupfer, Nature, 1998,395, 82–86.
6 S. C. Bunnell, D. I. Hong, J. R. Kardon, T. Yamazaki, C. J. McGlade, V. A. Barr and L. E. Samelson, J Cell Biol, 2002,
158, 1263–1275.
7 G. Campi, R. Varma, and M. L. Dustin, The Journal of
Experi-mental Medicine, 2005,202, 1031–1036.
8 T. Yokosuka, K. Sakata-Sogawa, W. Kobayashi, M. Hiroshima, A. Hashimoto-Tane, M. Tokunaga, M. L. Dustin and T. Saito,
Nat Immunol, 2005,6, 1253–1262.
9 R. Varma, G. Campi, T. Yokosuka, T. Saito and D. M.L.,
Immu-nity, 2006,25, 117–127.
10 Y. Kaizuka, A. D. Douglass, R. Varma, D. M.L. and R. D. Vale,
Proc Natl Acad Sci U S A, 2007,104, 2029620301.
11 A. Grakoui, S. K. Bromley, C. Sumen, M. M. Davis, A. S. Shaw, P. M. Allen and D. M.L., Science, 1999,285, 221227.
12 S. C. Bunnell, Immunological Synapse, Springer, 2010, pp. 123–154.
13 T. J. Crites, K. Padhan, J. Muller, M. Krogsgaard, P. R. Gudla, S. J. Lockett and R. Varma, J Immunol, 2014,193, 56–67.
Sez-gin, I. Levental, B. Alarcon and W. W. A. Schamel, Biochimica
et Biophysica Acta-Molecular Cell Research, 2015,1853, 802–
809.
15 K.-H. Roh, B. F. Lillemeier, F. Wang and M. M. Davis,
Proceed-ings of the National Academy of Sciences of the United States of America, 2015,112, E1604–E1613.
16 X. Lu, J. S. Gibbs, H. D. Hickman, A. David, B. P. Dolan, Y. Jin, D. M. Kranz, J. R. Bennink, J. W. Yewdell and R. Varma, Proc
Natl Acad Sci U S A, 2012,109, 15407–15412.
17 M. Ferez, M. Castro, B. Alarcon and H. M. van Santen, The
Journal of Immunology, 2014,192, 52–58.
18 D. R. Fooksman, Frontiers in Immunology, 2014,5, 158.
19 C. Chen, M. Mrksich, S. Huang, G. Whitesides and D. Ingber,
Science, 1997,276, 1425–1428.
20 M. Wu, D. Holowka, H. Craighead and B. Baird, Proc Natl
Acad Sci U S A, 2004,101, 13798–13803.
21 A. Singhai, D. Wakefield, K. Bryant, S. Hammes, D. Holowka and B. Baird, Biophys. J., 2014,107, 2639–2651.
22 M. Piel and M. Thery, Micropatterning in cell biology, Part B, Elsevier Academic Press Inc, San Diego, USA, 2014, vol. 120, pp. XV–XVI.
23 J. Doh and D. J. Irvine, Proc Natl Acad Sci U S A, 2006,103,
5700–5705.
24 K. Shen, V. K. Thomas, M. L. Dustin and L. C. Kam, Proc Natl
Acad Sci U S A, 2008,105, 7791–7796.
25 M. Schwarzenbacher, M. Kaltenbrunner, M. Brameshuber, C. Hesch, W. Paster, J. Weghuber, B. Heise, A. Sonnleitner, H. Stockinger and G. J. Schütz, Nat Methods, 2008,5, 1053–
1060.
26 E. Tabdanov, S. Gondarenko, S. Kumari, A. Liapis, M. L. Dustin, M. P. Sheetz, L. C. Kam and T. Iskratsch, Integr Biol
(Camb), 2015,7, 1272–1284.
27 K. D. Mossman, G. Campi, J. T. Groves and M. L. Dustin,
Sci-ence, 2005,310, 1191–1193.
28 B. N. Manz, B. L. Jackson, R. S. Petit, M. L. Dustin and J. Groves, Proc Natl Acad Sci U S A, 2011,108, 9089–9094.
29 J. P. Spatz and B. Geiger, Methods Cell Biol, 2007,83, 89–111.
30 J. Huang, S. V. Grater, F. Corbellini, S. Rinck, E. Bock, R. Kemkemer, H. Kessler, J. Ding and J. P. Spatz, Nano Lett, 2009,9, 1111–1116.
31 M. Schvartzman, M. Palma, J. Sable, J. Abramson, X. Hu, M. P. Sheetz and S. J. Wind, Nano Lett, 2011,11, 1306–1312.
32 J. Deeg, M. Axmann, J. Matic, A. Liapis, D. Depoil, J. Afrose, S. Curado, M. L. Dustin and J. P. Spatz, Nano Lett, 2013,13,
5619–5626.
33 J. Matic, J. Deeg, A. Scheffold, I. Goldstein and J. P. Spatz,
Nano Lett, 2013,13, 5090–5097.
34 D. Delcassian, D. Depoil, D. Rudnicka, M. Liu, D. M. Davis, M. L. Dustin and I. E. Dunlop, Nano Lett, 2013, 13, 5608–
5614.
35 S. T. Kim, M. Touma, K. Takeuchi, Z.-Y. J. Sun, V. P. Dave, D. J. Kappes, G. Wagner and E. L. Reinherz, J Immunol, 2010,185,
2951–2959.
36 Piner, Zhu, Xu, Hong and Mirkin, Science, 1999,283, 661–
663.
37 K. Salaita, Y. Wang, J. Fragala, R. A. Vega, C. Liu and C. A. Mirkin, Angew Chem Int Ed Engl, 2006,45, 7220–7223.
38 S. H. Kristensen, G. A. Pedersen, L. N. Nejsum and D. S. Sutherland, Nano Lett, 2012,12, 2129–2133.
39 F. Pi, P. Dillard, L. Limozin, A. Charrier and K. Sengupta, Nano
Lett, 2013,13, 3372–3378.
40 F. Pi, P. Dillard, R. Alameddine, E. Benard, A. Wahl, I. Ozerov, A. Charrier, L. Limozin and K. Sengupta, Nano letters, 2015,
15, 5178–5184.
41 P. Robert, L. Limozin, A.-M. Benoliel, A. Pierres and P. Bon-grand, in Principles of cellular engineering: Understanding the
biomolecular interface, ed. M. King, Elsevier Academic Press,
2006, ch. Glycocalyx regulation of cell adhesion, pp. 143– 169.
42 K. Choudhuri, D. Wiseman, M. H. Brown, K. Gould and P. A. van der Merwe, Nature, 2005,436, 578–582.
43 S. Sabri, M. Soler, C. Foa, A. Pierres, A. Benoliel and P. Bon-grand, J Cell Sci, 2000,113 ( Pt 9), 1589–1600.
44 K. D. Patel, M. U. Nollert and R. P. McEver, J Cell Biol, 1995,
131, 1893–1902.
45 M. J. Paszek, C. C. DuFort, O. Rossier, R. Bainer, J. K. Mouw, K. Godula, J. E. Hudak, J. N. Lakins, A. C. Wijekoon, L. Cassereau, M. G. Rubashkin, M. J. Magbanua, K. S. Thorn, M. W. Davidson, H. S. Rugo, J. W. Park, D. A. Hammer, G. Gi-annone, C. R. Bertozzi and V. M. Weaver, Nature, 2014,511,
319–325.
46 B. Alarcon, M. Reth and W. Schamel, Biochimica et Biophysica
Acta (BBA) - Molecular Cell Research, 2015,1853, 765 – 766.
47 Y. Neve-Oz, Y. Razvag, J. Sajman and E. Sherman, Biochim
Biophys Acta, 2015,1853, 810–821.
48 B. Bosch, E. L. Heipertz, J. R. Drake and P. A. Roche, Journal
of Biological Chemistry, 2013,288, 13236–13242.
49 P. Dillard, R. Varma, K. Sengupta and L. Limozin, Biophys J, 2014,107, 2629–2638.
50 R. Evans, A. C. Lellouch, L. Svensson, A. McDowall and N. Hogg, Blood, 2011,117, 3331–3342.
51 A. Edelstein, N. Amodaj, K. Hoover, R. Vale and N. Stuurman,
Current protocols in molecular biology, 2010, 14–20.
52 D. L. Elbert and J. A. Hubbell, Chemistry & biology, 1998,5,
177–183.
53 G. L. Kenausis, J. Vörös, D. L. Elbert, N. Huang, R. Hofer, L. Ruiz-Taylor, M. Textor, J. A. Hubbell and N. D. Spencer, The
Journal of Physical Chemistry B, 2000,104, 3298–3309.
54 L. Limozin and K. Sengupta, Chemphyschem, 2009,10, 2752–
2768.
55 C.-J. Hsu, W.-T. Hsieh, A. Waldman, F. Clarke, E. S. Huseby, J. K. Burkhardt and T. Baumgart, PloS one, 2012,7, e32398.
56 E. Cretel, D. Touchard, P. Bongrand and A. Pierres, J Immunol
Methods, 2011,364, 33–39.
57 K. Sengupta, H. Aranda-Espinoza, L. Smith, P. Janmey and D. Hammer, Biophysical Journal, 2006,91, 4638–4648.
58 K. Choudhuri, J. Llodrá, E. W. Roth, J. Tsai, S. Gordo, K. W. Wucherpfennig, L. C. Kam, D. L. Stokes and M. L. Dustin,
Nature, 2014,507, 118–123.
59 A. N. R. Cartwright, J. Griggs and D. M. Davis, Nat Commun, 2014,5, 5479.
60 L. Limozin and K. Sengupta, Biophys J, 2007,93, 3300–3313.
61 K. Sengupta and L. Limozin, Phys Rev Lett, 2010, 104,
088101.
62 S.-P. Cordoba, K. Choudhuri, H. Zhang, M. Bridge, A. B. Basat, M. L. Dustin and P. A. van der Merwe, Blood, 2013, 121,
4295–4302.
63 F. Baumgart and G. J. Schütz, Biochim Biophys Acta, 2015,
1853, 791–801.
64 W. W. A. Schamel and B. Alarcón, Immunol Rev, 2013,251,
13–20.
65 N. G. Caculitan, H. Kai, E. Y. Liu, N. Fay, Y. Yu, T. LohmuÌ´Lller, G. P. Oâ˘A´ZDonoghue and J. T. Groves, Nano letters, 2014,14,
2293–2298.
66 R. A. Fernandes, J. Huo, Y. Lui, J. H. Felce and S. J. Davis,
Frontiers in immunology, 2012,3, 1–4.
67 S. Cazaux, A. Sadoun, M. Pélicot-Biarnes, M. Martinez, S. Obeid, P. Bongrand, L. Limozin and P.-H. Puech,
Ultrami-croscopy, 2016,160, 168–181.
68 P. Beemiller, J. Jacobelli and M. F. Krummel, Nature
immunol-ogy, 2012,13, 787–795.
69 N. C. Hartman, J. A. Nyeb and J. T. Groves, Proceedings of the
National Academy of Sciences of the United States of America,
2009,106, 12729–12734.
70 G. P. ODonoghue, R. M. Pielak, A. A. Smoligovets, J. J. Lin and J. T. Groves, Elife, 2013,2, e00778.
71 B. Malissen and P. Bongrand, Annu Rev Immunol, 2015,33,
539–561.
72 M. R. Jenkins, J. C. Stinchcombe, B. B. Au-Yeung, Y. Asano, A. T. Ritter, A. Weiss and G. M. Griffiths, Elife, 2014, 3,
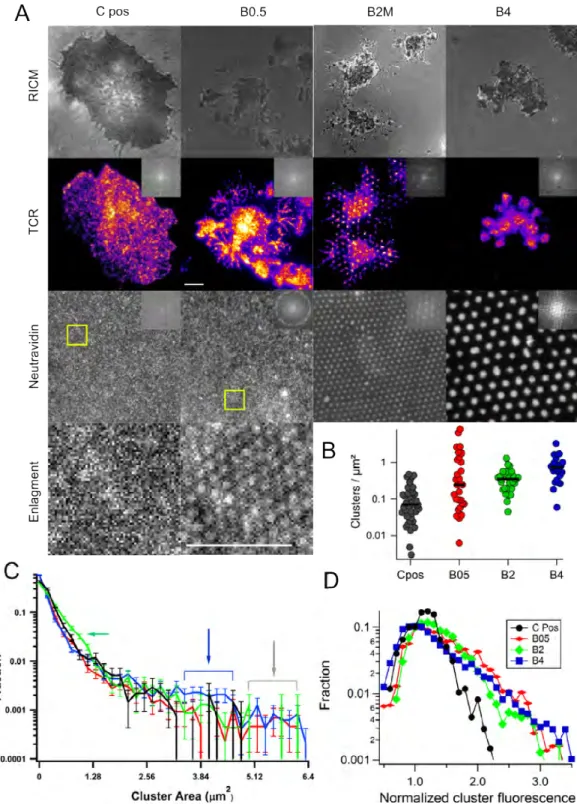
Fig. 1 The substrates. (A) A schematic representation of the patterned substrate (not to scale). (B) Quantification of the size of the antibody
nano-dots from fluorescence images of the underling neutravidin. The full width at half maximum (FWHM) of a median dot is reported. A “median dot" is created for each image field, typically containing hundreds of dots and its FWHM is determined. The FWHM is then averaged for at least ten fields for a given case. The error-bars are median absolute deviation. B2S, B2M, B2L and B4 refer respectively to dots with 2 or 4 µm spacing and small, medium or large size; high or low refers to PEG surface density. The dot-size does not depend on PEG density but is set by the choice of parameters during the fabrication process. (C) Epi-fluorescence images of the dots corresponding to each spacing and size, shown for the case of high PEG surface density. The data for low PEG density is equivalent. Scale bars: upper row: 5 µm; lower row: 1µm.
Fig. 2 The cell-surface contact area as determined from segmentation of Reflection Interference Contrast Microscopy (RICM) images. (A) Examples
of RICM of cells on the different substrates after 30 minutes of spreading. C Pos are positive controls with uniformly coated α-CD3 exposed further to PLL-PEG, C Neg are negative controls, where in case of high PEG surface density, the non-specific interaction with glass is fully screened and the cells do not adhere at all, whereas for layers with low PEG density, there is residual adhesion. On patterned substrate, the contact area depends on the PEG surface density such that cells spread more on low PEG density surfaces. On C Pos, the PEG density does not significantly impact the cell surface contact. Scale bar 5 µm. (B) Scatter-dot plot of contact area calculated from RICM images; At least 20 cells in each case. Bar = median value. *** : P < 0.001. (C) The contact area as a function of average molecular density of the ligands for the patterned substrates (red data) in case of high PEG coverage, and for supported lipid bilayer homogeneously covered surface with immobilized α-CD3 (black data and linear fit). The unspecific interaction is screened in both cases and the cell area is determined only by the average molecular densities. Control substrates with α-CD3 immobilized on glass show similar trend but have an additional contribution from non-specific interactions (blue-gray data and linear fit). Error bars are standard errors.
Fig. 3 Membrane topography from RICM images of cells on different patterns. (A) Selected examples that clearly exhibit modulation in RICM signal
under the cell indicating that the membrane topography is spatially modulated. Scale bar 5 µm. (B) The ratio of the contact area to tight adhesion area, plotted against the average ligand-density inside the dots for the different patterns, both high and low PEG cases follow a trend. The symbol size reflects the dots size (from large to small: 4B,2BL,2BM and 2BS). Error bars are standard deviations. (C) Scatter dot plots of membrane roughness parameter calculated from the RICM images (at least 20 cells each). For all the patterns, the roughness is substantially higher than on the positive controls (C pos, C pos low and C pos high), corresponding to uniformly coated α-CD3 that is either used as is or after exposure to conditions corresponding to low or high PEG density. On the pattern, for a given dot characteristic, the roughness is usually higher on the high PEG density case. For a given PEG density, the roughness is statistically different for the different dot characteristics. *** : P < 0.001.
Fig. 4 Distribution of T cell receptors (TCR). Cells were allowed to interact with dots (size as indicated, high PEG density), were fixed and labeled with
a fluorescent antibody against the TCR. (A) Top row: RICM images, middle row: TIRFM images of the marked cells in pseudo-colour to emphasise the differences in local concentration of the TCR, bottom row: underlying antibody dots, the fluorescent neutravidin is imaged. Column 1: positive control with randomly distributed TCR clusters. Column 2: On B0.5 cells exhibit many peripheral projections, clearly visible in the TCR channel but the TCR clusters are not visibly different from pos. Column 3: On B2M, the TCR clusters are clearly visible and are usually well localized on the site of the underlying antibody dots as evidenced by FFT in inset. Column 4. On B4, the TCR clusters are usually localized on the dots but a closer inspection shows that each dot often recruits several clusters. Insets show FFT which reflects the ordering (or not) of the TCR clusters. Scale bar 5 µm. (B) Scatter dot plot of the number of clusters per µm2. Densities are lower for C Pos (black) and comparable for the three patterned substrates (B0.5
red,B2M green,B4 blue). (C) Histogram of apparent area of clusters normalized by the total number of clusters. Clusters of certain size are enriched for B2M (green arrow) and B4 (blue arrow). All the patterns have a small population of very large clusters that do not appear on Pos (grey arrow). (D) Histogram of cluster mean fluorescence (normalized by average intensity under a cell). Intensities (and hence TCR concentration) are lower for C Pos and comparable for the three patterned substrates. Note that the average ligand concentration for C Pos is much higher than the average for the patterned substrates and is in fact comparable to the density inside the dots.
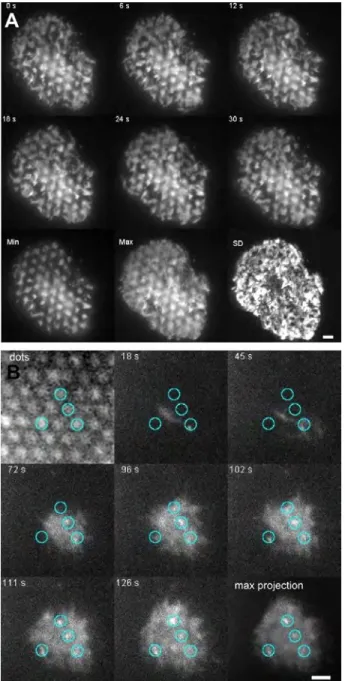
Fig. 5 Live-cell imaging with ZAP-70-GFP and Mem-GFP cells. Zap-70-GFP or Mem-GFP cells were deposited on patterned substrates (B2M, low
PEG) and were observed in time-lapse TIRFM. (A) Mem-GFP cells, observed after ca. 5 min., the dynamics of adhesion is described by the time projection (pixel by pixel statistics as a function of time) of a 1 min sequence recorded at 6s frame interval. The membrane topography clearly reflects the underlying α-CD3 adhesive patches (Minimal Time Projection, Min). However, the cell membrane exhibits strong protrusion activity as seen in the Maximal Time Projection (Max) and Standard Deviation (SD). (B) ZAP-70-GFP cells establish contact with the substrate through puncta (blue circles) which preferentially target the zones with underlying patterned α-CD3. In these zones, Zap-70 is clustered after further spreading (maximal
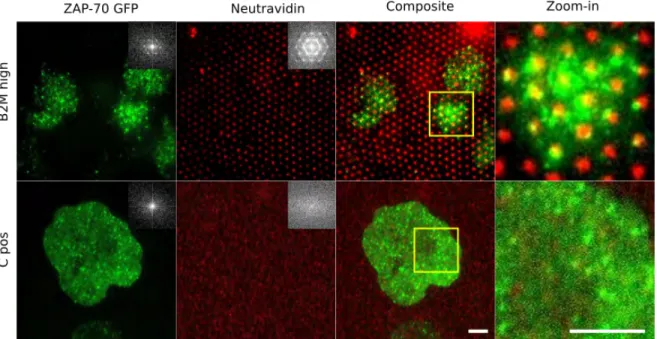
Fig. 6 Distribution of ZAP-70. Jurkat cells expressing ZAP-70-GFP were allowed to interact with B2M dots with high PEG density and were fixed
before observation. The bottom row shows the corresponding positive control. Column 1: The ZAP-70 clusters are randomly distributed on the positive control but are partially ordered on the pattern. The corresponding FFTs in the inset confirm this. Column 2: the underlying fluorescent dots (or uniformly distributed NAV). Column 3: a superposition of the ZAP-70 channel and the NAV channel (Column 4: zoom-in) shows that the overlap is imperfect. Scale bar 3 µm.
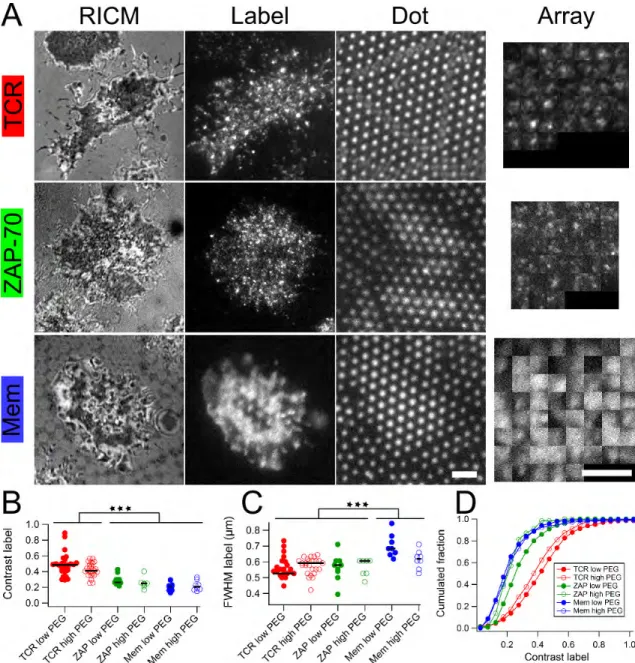
Fig. 7 Dot-scale analysis of the effect of patterned α-CD3 on TCR and ZAP-70 recruitment. Cells were engaged during 30 min on substrates
patterned with α-CD3 dots (B2M low: pitch 2 µm and dot size 0.7µm with low PEG density between the dots or B2M high, same with high PEG density). (A) Cells on B2M low were fluorescently labeled for TCR, ZAP-70 or Membrane. In each case, a cell showing median values for the cluster size and contrast parameters was randomly chosen for illustration. From left to right, RICM, TIRFM image of the label and epi-fluorescence image of the dots are shown. The last column is an array representation of the label clusters and shows the fluorescence of the label in square regions centered on each underlying dot. Scale bar: 2µm. (B-C) Scatter dot plot of label contrast and full width at half maximum. Each dot represents the median value for all dots under one given cell. Black bar represents the median of the dots. *** : P < 0.001. (D) Cumulated fraction of contrast calculated on dots for all cells in a given condition.