HAL Id: inserm-01762378
https://www.hal.inserm.fr/inserm-01762378
Submitted on 25 Oct 2019
HAL is a multi-disciplinary open access
archive for the deposit and dissemination of
sci-entific research documents, whether they are
pub-lished or not. The documents may come from
teaching and research institutions in France or
abroad, or from public or private research centers.
L’archive ouverte pluridisciplinaire HAL, est
destinée au dépôt et à la diffusion de documents
scientifiques de niveau recherche, publiés ou non,
émanant des établissements d’enseignement et de
recherche français ou étrangers, des laboratoires
publics ou privés.
Distributed under a Creative Commons Attribution| 4.0 International License
insulin receptor in the liver
Paul Meakin, Anna Mezzapesa, Eva Benabou, Mary Haas, Bernadette
Bonardo, Michel Grino, Jean-Michel Brunel, Christele Desbois-Mouthon,
Sudha Biddinger, Roland Govers, et al.
To cite this version:
Paul Meakin, Anna Mezzapesa, Eva Benabou, Mary Haas, Bernadette Bonardo, et al.. The beta
secretase BACE1 regulates the expression of insulin receptor in the liver. Nature Communications,
Nature Publishing Group, 2018, 9 (1), �10.1038/s41467-018-03755-2�. �inserm-01762378�
The beta secretase BACE1 regulates the expression
of insulin receptor in the liver
Paul J. Meakin
1
, Anna Mezzapesa
2
, Eva Benabou
3
, Mary E. Haas
4
, Bernadette Bonardo
2
, Michel Grino
2
,
Jean-Michel Brunel
5
, Christèle Desbois-Mouthon
3
, Sudha B. Biddinger
4
, Roland Govers
2
,
Michael L.J. Ashford
1
& Franck Peiretti
2
Insulin receptor (IR) plays a key role in the control of glucose homeostasis; however, the
regulation of its cellular expression remains poorly understood. Here we show that the
amount of biologically active IR is regulated by the cleavage of its ectodomain, by the
β-site
amyloid precursor protein cleaving enzyme 1 (BACE1), in a glucose concentration-dependent
manner. In vivo studies demonstrate that BACE1 regulates the amount of IR and insulin
signaling in the liver. During diabetes, BACE1-dependent cleavage of IR is increased and the
amount of IR in the liver is reduced, whereas infusion of a BACE1 inhibitor partially restores
liver IR. We suggest the potential use of BACE1 inhibitors to enhance insulin signaling during
diabetes. Additionally, we show that plasma levels of cleaved IR re
flect IR isoform A
expression levels in liver tumors, which prompts us to propose that the measurement of
circulating cleaved IR may assist hepatic cancer detection and management.
DOI: 10.1038/s41467-018-03755-2
OPEN
1Division of Molecular & Clinical Medicine, Ninewells Hospital & Medical School, Dundee DD19SY, UK.2Aix Marseille Univ, INSERM, INRA, C2VN, 13385
Marseille, France.3Sorbonne Universités, UPMC Univ Paris 06, INSERM, Saint-Antoine Research Center, F-75012 Paris, France.4Division of Endocrinology,
Boston Children’s Hospital, Boston, MA 02115, USA.5Aix Marseille Univ, INSERM, CNRS, CRCM, Institut Paoli Calmettes, Marseille 13385, France.
Correspondence and requests for materials should be addressed to F.P. (email:franck.peiretti@univ-amu.fr)
123456789
I
nsulin receptor (IR) is a tetrameric protein composed of two
extracellular ligand-binding
α-subunits and two
transmem-brane tyrosine kinase active
β-subunits
1. IR exists as two
isoforms, IRA and IRB, derived from the alternative splicing of
exon 11 in the primary transcript
2. IRA lacks and IRB contains a
12-amino acid segment located in the carboxyl terminus of the
α-subunit. Both isoforms have similar affinity for insulin, but IRA
also binds IGF2 with high affinity
3–6. The relative abundance of
the two variants is regulated in a tissue-specific manner
7. IRA is
ubiquitously expressed and is preponderant in fetal and cancer
tissues as well as brain, whereas IRB is predominantly expressed
in tissues associated with insulin-dependent metabolic effects
(liver, muscle, and adipose tissue).
Mutations in IR gene, which reduce the number of cell-surface
receptors, have been identified in patients with genetic syndromes
of extreme insulin resistance (Donohue syndrome)
8, suggesting
that regulation of cell-surface IR levels contribute to the altered
insulin signaling. Besides these rare genetic cases, IR cell-surface
expression is also reduced in insulin-resistant states
9,10, possibly
consequential to its increased degradation
11,12. IR overexpression
with higher IRA levels are common features of most
malig-nancies
7,13that may favor resistance to conventional and targeted
therapies by various mechanisms
7.
The presence of a soluble form of IR (full-length or truncated)
in the conditioned media (CM) of several human cell lines and in
human plasma was previously reported
14–18. A landmark study
19demonstrated that a soluble truncated IR (IRsol), composed of
the
α-subunits attached to part of the extracellular region of
β-subunits, was present at higher levels in the plasma of patients
with diabetes than in control groups, a
finding since been
con-firmed
20. However, the molecular mechanisms responsible for
IRsol generation remain unclear, and it is not known whether IR
cleavage actively participates in the etiology of diabetes, and if
diabetes is the only pathological situation in which IRsol is
increased.
β-site amyloid precursor protein cleaving enzyme 1 (BACE1) is
the transmembrane aspartyl protease required for the production
of the neurotoxic
β-amyloid peptide, considered crucial in the
etiology of Alzheimer’s disease
21. The propeptide of BACE1 is
cleaved in the trans-Golgi network (TGN) by proprotein
con-vertases, although immature BACE1 is active in the early
bio-synthetic compartments
22. BACE1 is optimally active at acidic
pH and is located in the TGN, plasma membrane, and early
endosomes
23–25. BACE1 has a loose substrate specificity
26, and
the use of published in vitro subsite specificity data, for a
bioinformatics-based search of the human proteome, identified
numerous putative BACE1 substrates
27, including IR. Thus
BACE1 may contribute to the regulation of insulin signaling.
Importantly, BACE1 activity has been implicated in the
regula-tion of whole-body glucose and energy homeostasis
28–30.
We demonstrate that the IR ectodomain is cleaved by BACE1,
that this cleavage occurs in the liver and increased during
dia-betes, thus decreasing the amount of mature IR. BACE1
inhibi-tion restores funcinhibi-tional cell-surface IR and increases insulin
signaling, supporting the use of BACE1 inhibitors to improve
liver insulin signaling during diabetes. Furthermore, IRsol plasma
levels positively correlate with IRA expression in hepatic tumors,
suggesting IRsol as a novel biomarker for cancer diagnosis,
pro-gression, and therapeutic efficacy.
Results
Identi
fication of IR fragments. We validated various antibodies
(Fig.
1a) to detect overexpressed wild type and truncated forms of
IR in HEK 293 cells that express low levels of endogenous IR
(Supplementary Fig.
1a, b). Throughout the overexpressed IR is
isoform A (IRA; unless IRB specified).
The ectodomain cleavage of IR should generate a
transmem-brane C-terminal and a soluble fragment (IRctf and IRsol,
respectively). IRctf is a substrate for presenilin-1-dependent
activity of
γ-secretase activity
31,32, thus
γ-secretase inhibition
improves its detection. IRctf was detected with antibodies
recognizing either the N or C-terminal intracellular domain of
IR
β-subunit (IRβ) (C-4 and C-19, respectively) at ≈50 kDa
(Fig.
1b) in lysates of cells overexpressing IR and treated with the
γ-secretase inhibitor (DAPT). The amount of IR precursor
(proIR; an internal control of IR overexpression levels) and IRβ
were not modified, indicating that HEK 293 cells express the
enzyme that cleaves IR, and that IRctf contains the entire IR
intracellular region. The transmembrane nature of IRctf was
demonstrated by its detection in membrane-enriched fractions
(Supplementary Fig.
2a) and in cell surface protein-enriched
fractions (Supplementary Fig.
2b), implying that IRctf is
generated by cleavage of the IRβ extracellular region, and that
an ectodomain fragment of IR, containing
α-subunit and a
N-terminal
β-subunit extracellular fragment is released into the
extracellular media.
The IR
α-subunit-specific antibody (H-78) detected a protein
of
≈130 kDa in the CM of cells overexpressing IR that migrated
slower in reducing SDS-PAGE than the cell lysate IR
α-subunit
(Fig.
1c, d, upper panel). The difference in migration distance
persisted after the in vitro removal of N-linked oligosaccharides
by Peptide-N-Glycosidase F (PNGaseF) treatment (Fig.
1d upper
panel), suggesting it is not related to the N-glycosylation status.
The detection of CM IR
α-subunit was improved after
deglycosylation, and this protein was not detected by the
C-terminal IRβ-specific antibody (C-19) (Fig.
1d, lower panel). This
protein was immunoprecipitated from CM by the IR
α-subunit
antibody (H-78) and the mouse monoclonal antibody 18-44
33that binds close to the
β-subunit extracellular N-terminus (amino
acids 792–797 from P06213), but not by the β-subunit
intracellular C-terminal antibody (C-19) (Fig.
1e, upper panel).
As expected, all antibodies immunoprecipitated IR from cell
lysates (Fig.
1e, lower panel). Therefore, the protein detected by
the IR
α-subunit antibody (H-78) in CM is IRsol composed of the
α-subunit and a β-subunit N-terminal fragment.
BACE1 is responsible for cleavage of the IR ectodomain. We
developed a bioluminescent reporter to monitor the cleavage of
the extracellular region of IRβ consisting of Gaussia Luciferase
fused to the N-terminus of IRβ (IRLuc), thus releasing Luciferase
into the cell culture medium when cleaved (Supplementary
Fig.
3a–c). IRLuc was used to screen for protease inhibitors that
reduce the cleavage of the IRβ. Inhibitors of metalloproteases
(GM6001) and ADAM17/MMP (TMI1) reduced Luciferase
release (Supplementary Fig.
3d). BACE1 is not inhibited by
pepstatin
34, but treatment with its specific inhibitor (C3) reduced
Luciferase release. None of these inhibitors modified the cellular
amount of IRLuc (Supplementary Fig.
3d).
An ELISA, allowing measurement of human and mouse IRsol,
was developed (Supplementary Fig.
4), and the three inhibitors
that reduced IRLuc cleavage were studied. Overexpression of IR
increased the amount of IRsol detected in CM (Fig.
2a) and IRsol
accumulation was not altered by GM6001 or TMI1, but reduced
by C3 (−30%) (Fig.
2b) and by two shRNAs specific for BACE1
(−50%) (Fig.
2c). The shRNAs efficiency to reduce BACE1
expression, and the lack of effect of the treatments on IR
expression were verified (Supplementary Fig.
5a). The
accumula-tion of IRsol in CM was increased by overexpression of BACE1,
but not by an inactive form of BACE1 (BACE1i, a D
289A mutant
that is less well-expressed than the wild-type form), BACE2,
ADAM10, or ADAM17 (Fig.
2d). The activity of overexpressed
ADAM10 and ADAM17 was confirmed by increased cleavage of
TNFα (Supplementary Fig.
5b)
35,36. These results demonstrate
that BACE1 activity selectively cleaves the IRβ ectodomain,
releasing IRsol extracellularly.
The BACE1-dependent cleavage of IR was also analyzed in cell
lysates. BACE1 overexpression reduced the amount of mature IR
(Fig.
2e, left), decreasing the IR/proIR ratio (Fig.
2e, right), and
increasing the amount of detectable IRctf even in the absence of
DAPT (Fig.
2e, left). The increase in IRctf, by BACE1
overexpression, was reduced by C3 and the inactive form of
BACE1 was unable to raise IRctf levels (Fig.
2f). Clearly,
treatment of cells with C3 does not abolish BACE1 activity, in
accordance with the modest effect of C3 on IRsol accumulation
(Fig.
2b).
IR cleavage by BACE1 implies that the proteins interact.
Immunoprecipitation (IP) of overexpressed BACE1 mainly pulled
down the proIR and poorly its mature form (Fig.
2g). However,
the amount of mature IR that co-immunoprecipitated with
BACE1 increased when cells were incubated with C3 (Fig.
2g).
Furthermore, more mature IR was co-immunoprecipitated with
inactive BACE1 than wild-type BACE1, despite lower inactive
BACE1 expression. These results favor a transient interaction
between IR and BACE1 that is prolonged when BACE1 activity is
reduced. BACE1 in cell lysates appeared as a poorly defined broad
band in immunoblots, whereas two distinct bands were detected
after BACE1 IP (Fig.
2g). Furthermore, IR IP only pulled down
the fast migrating form of BACE1 (Fig.
2h), which corresponds to
immature BACE1 (with its propeptide), as its amount was
increased by protein convertases inhibition and decreased by
furin overexpression (Fig.
2i). Consequently, as previously
shown
23, the slow migrating form of BACE1 is mature BACE1
(without its propeptide).
The interaction of IR with immature BACE1 suggests that IR
cleavage occurs in the early secretory pathway. This notion is
supported by the fact that BACE1, IR, and IRctf co-purify in
Golgi/TGN-enriched fractions, and that IRsol is detected in cell
lysates (Supplementary Fig.
6).
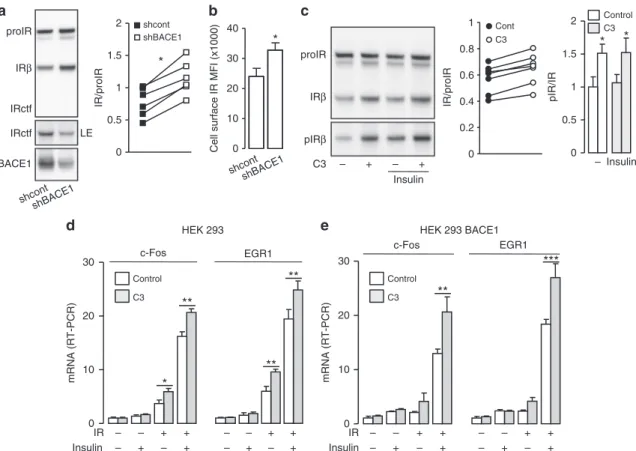
BACE1 regulates cell surface IR amount and insulin signaling.
In BACE1 overexpressing cells, BACE1 knockdown (Fig.
3a)
reduced the amount of IRctf, but increased mature IR levels
(increased IR/proIR ratio;
+54%) and cell surface IR (+40%)
(Fig.
3b). Similarly, treatment of cells with C3 (Fig.
3c)
repro-ducibly increased mature IR levels (increased IR/proIR ratio;
+14
± 4%). Furthermore, basal and insulin-stimulated IR
phosphor-ylation (Tyr
1162/1163) increased proportionally to the amount of
IR with pIR/IR ratios unaltered by BACE1 inhibition. Thus
BACE1-dependent IR cleavage modulates the amount of
biolo-gically active IR at the cell surface. Importantly,
BACE1-dependent IR cleavage was confirmed in human hepatoma
HepG2 cells, which express substantial endogenous IR
(Supple-mentary Fig.
7), showing that it is not restricted to cells
ectopi-cally overexpressing IR and/or BACE1.
IR – + CM 200- 100-kDa
c
L CM L CM pGNAseF proIR IRα proIR IRα proIR IRβ proIR IRβd
Conditioned media Cell lysates – + – + – + IP: H-78 18-44 C-19 proIR IRα IRαe
IR C-19 C-4 H-78 IRα IRβ N C N Lumen Cytosol C IR 18-44a
C-19 C-4 DAPT – + – + proIR IRβ IRctf IRctfb
LE -200 -100 -50 kDaFig. 1 Detection and characterization of IR fragments. a Schematic representation of IR showing the position of the peptides used as antigens to produce antibodies C-19, C-4, H-78, and that of the epitope recognized by antibody 18-44 (blue rectangles). N and C-terminal extremities andα and β subunits are localized. The membrane is represented by the light gray rectangles.b HEK 293 cells were transfected with IR expression vector and treated overnight with theγ-secretase inhibitor (DAPT; 5 μM). IR was detected by immunoblot, using the indicated IR β-subunit (IRβ) specific antibodies (LE indicates a long exposure of the immunoblot). Positions of IR precursor (proIR), IRβ, and C-terminal fragment of IR (IRctf) are indicated. c Immunoblot analysis using the H-78 antibody of 24 h serum-free conditioned media (CM) from cells transfected with an empty plasmid (−) or with a plasmid encoding human IR (+). d Lysates (L) and CM from IR overexpressing cells were collected and where indicated in vitro, deglycosylated by PGNaseF. IR was detected by immunoblot, using H-78 antibody (upper panel) or C-19 antibody (lower panel).e CM and cell lysates from IR overexpressing cells (+) or cells transfected with an empty plasmid (−) were collected and subjected to immunoprecipitation (IP), using the indicated antibodies. IR was detected by immunoblot using H-78 antibody. IRα indicates the position of IR α-subunit
In HEK 293 cells, insulin-induced expression of
immediate-early genes (c-Fos and EGR-1) was proportional to the amount of
overexpressed kinase-competent IR and involved the Erk1/
2 signaling pathway (Supplementary Fig.
8). Inhibition of BACE1
increased insulin-stimulated c-Fos and EGR-1 expression only in
cells expressing IR and was enhanced in cells overexpressing
BACE1 (Fig.
3d, e). These results illustrate that the increase in IR
amount triggered by BACE1 inhibition enhances insulin action.
Identification of IR cleavage region. The IRβ contains four
N-glycosylation sites (Fig.
4a)
37. In vitro enzymatic
N-deglycosyla-tion of cell lysates increased the migraN-deglycosyla-tion distance of the IRβ, but
not IRctf, in SDS-PAGE (Fig.
4b), showing that the IRctf
extra-cellular region is not N-glycosylated. For confirmation, CHO cells
were transfected with vectors coding for wild-type IR or modified
IR, in which the four N-glycosylatable asparagine residues in the
IRβ were replaced by alanine. CHO cells express substantial levels
of endogenous mature IR; however overexpressed IR was readily
detectable (Fig.
4c). Abrogation of the IRβ glycosylation increased
its migration distance in SDS-PAGE with IRctf unchanged
(Fig.
4c). Asparagine in position 933 is the most membrane
proximal N-glycosylation site in IRβ, and mutation to alanine
modestly increased the migration distance of IRβ but not IRctf
(Fig.
4d). These results indicate that IRβ cleavage occurs in its
membrane proximal stalk, between asparagine 933 and lysine 956
(Supplementary Table
1). The calculated molecular weight of the
IRβ C-terminal fragment generated by cleavage in this region lies
between 48.1 and 50.7 kDa, which is compatible with the mass of
IRctf deduced from SDS-PAGE migration (49–51 kDa).
A BACE1 target motif was predicted
27within the IR region we
have identified (Supplementary Table
1). A peptide encompassing
part of this motif was in vitro cleaved by recombinant soluble
BACE1, generating fragments with RP-HPLC elution profiles
compatible with cleavage at the predicted scissible bond
(Supplementary Fig.
9), indicating direct cleavage of IR by
BACE1.
Amino acid substitutions were performed (Supplementary
Table
1) to identify the crucial residues for cleavage. The scissible
BACE1f
proIR IRβ IRctf BACE1 +C3 BACE1i BACE1 BACE1 C3 BACE1i – + Lysate IP:HA proIR IRβ BACE1 – + BACE1 BACE1ig
Ig Lysate Flag HA IP Lysate IP:C-19 BACE1i – + – + – + – + IRFlag + IR proIR IRβ BACE1h
Ig Ig imm mat 0 10 50 RVKR (μM)i
– fur Ig imm mat IP:HA IB:BACE1 BACE1 proIR IRβ IRctf DAPT IR BACE1 – – – + + + + – + + IRctf 0 0.5 1 1.5 IR IR + BACE1 IR/proIRe
LE*
IB:HA 0 1 2 3 4 IRsol (AU)d
***
0 0.5 1 IRsol (AU)a
***
EV IR Cont Cont Cont GM6001TMI1 C3 shcontshBACE1ashBACE1b BACE1i
BACE1i BACE1
BACE1 ContBACE1BACE2 BACE2ADAM10ADAM17
**
0 0.5 1 IRsol (AU)b
***
***
0 0.5 1 IRsol (AU)c
60- 50-kDaFig. 2 BACE1 is involved in IR cleavage. IRsol was measured by ELISA in 24 h conditioned media of a HEK 293 cells transfected with an empty vector (EV) or overexpressing IR. The mean IRsol values from IR overexpressing cells were arbitrarily set at 1.b Cells overexpressing IR and untreated (Cont) or treated with the indicated protease inhibitors (10μM, 24 h). c Cells overexpressing IR together with BACE1 specific shRNA (shBACE1a, shBACE1b) or a control shRNA (shcont).d Cells transfected with the IR expression vector together with an empty plasmid (Cont), BACE1, inactive BACE1 (BACE1i), BACE2, ADAM10, or ADAM17. Expression of BACE1 and BACE2 were confirmed by immunoblot, using HA antibody (lower panel). e Cells transfected with combinations of IR and BACE1 expression vectors were treated or not with DAPT, then IR and BACE1 were detected by immunoblot. LE indicates a long exposure of the immunoblot. The graph shows the ratios IR/proIR obtained from the quantification of six independent experiments; data from the same experiment are connected by a line.f Cells overexpressing IR and BACE1 or inactive BACE1 (BACE1i) were treated with the BACE1 inhibitor (C3) then IR and BACE1 were detected by immunoblot.g Cells were treated as f, then BACE1 was immunoprecipitated (IP) with anti HA antibody and IR, and BACE1 were detected by immunoblot in cell lysates and immunoprecipitated fractions.h Cells were transfected with the indicated combinations of IR, IRFlag, and BACE1i expression vectors, then overexpressed proteins were immunoprecipitated using C-19, FlagM2 (Flag) and HA antibodies, respectively, and detected by immunoblots.i BACE1 overexpressing cells treated with proprotein convertase inhibitor dec-RVKR-cmk (RVKR; 24 h; upper panel) or cells
overexpressing BACE1 without (−) of with furin (fur; lower panel) were lyzed then BACE1 was immunoprecipitated and detected by immunoblot. Positions of the heavy chain of the precipitating antibody (Ig), immature (imm) and mature (mat) BACE1 are indicated. Data are means ± s.d. Statistical analyses were made using unpaired t-test (a, e) or ANOVA followed by Dunnett’s test (b–d); **p < 0.01; ***p < 0.001
bond amino acids were substituted (FY to KK) to generate the IR
mutant F
942K/Y
943K expected to be resistant to BACE1
cleavage
38. The preferred amino acid for BACE1-dependent
cleavage, in the P
7position (tryptophan), was substituted by the
unfavorable amino acid (histidine)
39to generate the IR mutant
W
936H with reduced cleavage efficiency expected. The P
6threonine was changed to methionine to generate the IR mutant
T
937M, reported in two cases of Donohue syndrome
40,41.
The amount of IRsol generated from each mutant was lower
than that from wild type (Fig.
4e). However, these mutants were
mainly expressed as precursors (Fig.
4e, inset), suggesting an
impairment in their cellular trafficking. Mutant F
942K/Y
943K was
almost exclusively expressed as a precursor and generated minute
amounts of IRsol, which underscores a major alteration of its
cellular trafficking and therefore was not studied further.
Compared with the IR mutant W
936H, T
937M generated more
IRsol (Fig.
4e), its mature form was less abundant (Fig.
4e, inset),
and it was less well-expressed at the cell surface (Fig.
4f). These
results suggest that cleavage of T
937M is more efficient than that
of W
936H. As for wild-type IR (Fig.
3c), BACE1 inhibition
reproducibly increased mature IR T
937M levels (IR/proIR;
+17 ±
7%) and that of its phosphorylated form in response to insulin
stimulation (Fig.
4g).
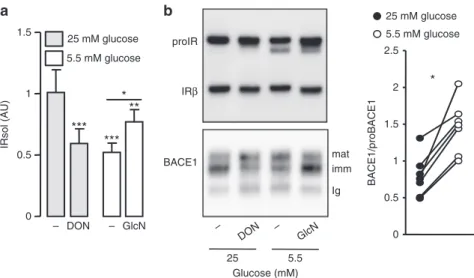
Regulation of BACE1-dependent IR cleavage by glucose.
Reducing the glucose concentration of HEK 293 cells culture
media from 25 to 5.5 mM reduced IRsol accumulation (Fig.
5a)
and the cleavage of the IR cleavage reporter system (decreased
accumulation of Luciferase in culture media and increased
cel-lular Luciferase) (Supplementary Fig.
10a). Addition of
glucosa-mine (GlcN) (a hexose substrate specifically metabolized through
the hexosamine biosynthesis pathway and O-GlcNAcylation
candidate) mitigated the low glucose-dependent reduction of
IRsol accumulation (Fig.
5a). Conversely, in a high glucose
con-centration, global inhibition of O-GlcNacylation by
deox-ynorleucine (glucose:fructose amidotransferase inhibitor) reduced
IRsol accumulation (Fig.
5a). These treatments modified overall
cellular O-GlcNacylation (Supplementary Fig.
10b), but not the
amount of mature IR (Fig.
5b, upper panel), suggesting that IR
cleavage
regulation
by
glucose
involves
O-GlcNacylation
processes.
Low glucose concentration reduced the expression level of
immature BACE1 (the form that interacts with IR) and increased
that of mature BACE1, resulting in an increased BACE1/
proBACE1 ratio (Fig.
5b). Similar effects were triggered by
inhibition of O-GlcNacylation, while addition of GlcN abolished
the effects of low glucose (Fig.
5b and Supplementary Fig.
10c).
0 10 20 30 c-Fos EGR1 Control C3 0 10 20 30 c-Fos EGR1 Control C3HEK 293 HEK 293 BACE1
**
***
Insulin IR – – + –*
– +**
+ +**
**
e
d
– – + – – + + + Insulin IR – – + – – + + + – – + – – + + + mRNA (RT-PCR) mRNA (RT-PCR)b
0 10 20 30 40Cell surface IR MFI (x1000)
*
Insulin – + – +c
proIR IRβ pIRβ C3 0 0.2 0.4 0.6 0.8 1 Cont C3 IR/proIR pIR/IR Control C3 Insulin –*
*
0 0.5 1 1.5 2a
proIR IRβ BACE1 IRctf IRctf LE IR/proIR 0 shcont shBACE1 shcont shBACE1 0.5 1 1.5 2 shcont shBACE1*
Fig. 3 BACE1 regulates the amount of cell surface IR. a HEK 293 cells, stably expressing BACE1, were co-transfected with IR expression vector and control shRNA (shcont) or BACE1 specific shRNA (shBACE1) then IR and BACE1 were analyzed by immunoblot. LE indicates a long exposure of the immunoblot. The graph shows the ratio IR/proIR obtained from the quantification of six independent experiments; data from the same experiment are connected by a line.b IR expression was measured byflow cytometry at the surface of cells, stably expressing BACE1 and co-transfected with the IR expression vector associated with control shRNA (shcont) or BACE1 specific shRNA (shBACE1). The median fluorescence intensity (MFI) corrected for the value obtained with cells transfected with the empty vector is shown.c Cells expressing BACE1 were transfected with IR expression vector and treated overnight with the BACE1 inhibitor (C3; 20μM) in the absence of serum, then stimulated with insulin (5 nM, 5 min) and IR, and phospho IR (pIRβ) were analyzed by immunoblot. The graphs show the ratios IR/proIR and pIR/IR obtained from the quantification of seven and six independent experiments, respectively. Native HEK 293 cells (d) or HEK 293 cells expressing BACE1 (e) were transfected with IR coding vector (+) or with empty vector (−), treated with BACE1 inhibitor (C3; 20μM; gray columns), serum deprived for 20 h and stimulated with insulin (5 nM, 45 min; +). Levels of c-Fos and Egr1 mRNA were measured by RT-PCR and expressed as fold over the situation without IR overexpression nor insulin stimulation. Data are means ± s.d. Statistical analyses were made using unpaired t-test (a–c) and ANOVA followed by Bonferroni’s test (e); *p < 0.05; **p < 0.01
However, proprotein convertase activity was not altered by low
glucose (Supplementary Fig.
10d). These results suggest that
immature BACE1 is responsible for IR cleavage and that glucose
regulates the amount of BACE1 that is matured by proprotein
convertases.
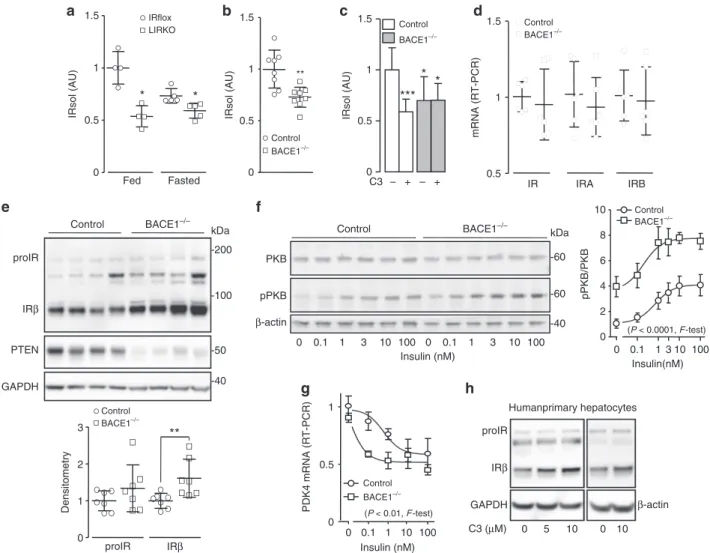
In vivo cleavage of IR by BACE1. Significantly less IRsol was
measured in the plasma of liver-specific IR knockout mice than
their
floxed-controls (Fig.
6a), suggesting that a substantial
amount of plasma IRsol is produced by the liver. Interestingly,
fasting reduced IRsol plasma levels only in wild-type mice
(Fig.
6a). Plasma from BACE1
−/−mice contained less IRsol
(−30%) than the plasma from wild-type littermates (Fig.
6b),
confirming the involvement of BACE1 in the cleavage of IR
in vivo. Furthermore, liver explants from BACE1
−/−mice
released less IRsol than liver explants from wild-type mice
(Fig.
6c), and C3 reduced the IRsol release only in wild-type liver
explants, corroborating hepatic BACE1-dependent IR cleavage.
Total IR, IRA, and IRB mRNA levels were similar in livers from
wild-type and BACE1
−/−mice (Fig.
6d). However, BACE1
−/−mouse livers contained more (+60%) mature IR (Fig.
6e and
Supplementary Fig.
11a). Protein levels of the PKB negative
regulator PTEN are reduced by IR overexpression
42, and in
accordance we detected low PTEN levels in BACE1
−/−livers
(Fig.
6e and Supplementary Fig.
11a). In primary hepatocytes,
BACE1 deficiency increased total IR and phosphorylated IR levels
(basal and insulin stimulated) (Supplementary Fig.
12a) without
altering mRNA (Supplementary Fig.
12b). In contrast to the other
BACE1 reduction models used in this study, the proform of IR
was increased in BACE1
−/−primary hepatocytes (Supplementary
Fig.
12a). Basal and insulin-stimulated phosphorylation of PKB
were increased in BACE1
−/−hepatocytes (Supplementary
Fig.
12a), with insulin concentration–response curve for PKB
phosphorylation shifted upward, with an increased maximal
response (Fig.
6f). Furthermore, repression of PDK4 occurred
with lower concentrations of insulin in BACE1
−/−than control
hepatocytes (leftward shift in insulin concentration–response
curve) (Fig.
6g), while the insulin repression of PEPCK, G6Pase,
and PGC1a expression were unchanged (Supplementary Fig.
12c).
These results show that BACE1 deficiency in primary hepatocytes
improves some insulin effects. Importantly, BACE1-dependent
cleavage of IR occurs in primary human hepatocytes, as the
treatment with C3 increased the amount of mature IR (Fig.
6h).
A restricted analysis of expression of genes, involved in glucose
and lipid metabolism (Supplementary Fig.
12b), revealed that
basal glucokinase (GCK) mRNA was higher in BACE1
−/−than
control primary hepatocytes (Fig.
7a). A luciferase reporter gene
expression system was used to evaluate whether GCK promoter
activity was depended on IR expression levels. Human GCK
promoter activity was increased in IR overexpressing cells and
insulin-stimulated promoter activity only in these cells (Fig.
7b).
In BACE1 overexpressing cells, both IR overexpression and
insulin stimulation were required to increase GCK promoter
activity, which was further enhanced by BACE1 inhibition
Cont WT 4NA Cont WT 4NA
DAPT GAPDH proIR IRβ IRβ IRctf
c
WT N933 A N933 A WT DAPTd
proIR IRctf IRctf LE 920 933 782769 IRα IRβ IRβ Lumen Cytosola
DAPT – + – + PGNAseF proIR IRctf IRctfb
LECell surface IR MFI (x1000)
0 10 20 30
**
***
f
Cont C3 IR/proIR 0 0.05 0.10 0.15 0.20 0.25 proIR IRβ IRβ pIRβ C3 – + – + Insulin LEg
e
0 0.5Wild typeW936 Wild type H T937 M W936 H T937 M F942 K/Y943 K 1 1.5 IRsol (AU)
***
***
***
*
proIR IRβ T937MFig. 4 Identification of the IR cleavage region. a Schematic representation of IR positioning the N-glycosylation sites in the β-subunit. b HEK 293 cells were transfected and treated as described in Fig.1b. Where indicated cell lysates were in vitro deglycosylated by PGNaseF.c CHO cells were transfected with an empty plasmid (Cont), an IR expression vector (WT) or with a plasmid expressing a mutated form of IR that cannot be glycosylated on itsβ-subunit (4NA), then treated with DAPT.d HEK 293 cells were transfected with an IR expression vector (WT) or with a plasmid expressing a mutated form of IR that cannot be glycosylated on the position 933 (N933A), then treated with DAPT. HEK 293 cells expressing BACE1 were transfected with wild-type IR or the
indicated mutated forms of IR, then the IRsol accumulated in the conditioned media was measured by ELISA, and cellular expression of IR was analyzed by immunoblot (e), cell surface expression of IR was measured byflow cytometry (f). g Cells were treated as in Fig.3c then IR and phospho IR (pIRβ) were detected by immunoblot. LE indicates a long exposure of the immunoblot. The graph shows the ratios IR/proIR obtained from the quantification of six independent experiments. Data are means ± s.d. Statistical analyses were made using ANOVA, followed by Bonferonni’s test (e, f) or unpaired t-test (g). *p < 0.05; **p < 0.01; ***p < 0.001
(Fig.
7c). This result shows that BACE1-dependent cleavage of IR
is involved in the regulation of GCK expression.
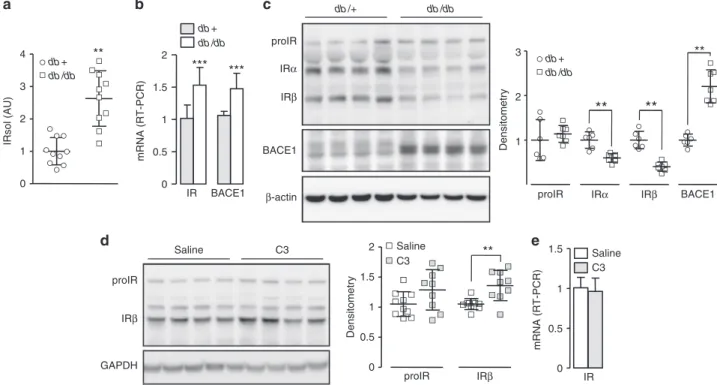
Cleavage of IR in diabetic mice. We detected more IRsol in the
plasma of a model of type 2 diabetes (db/db mice, Supplementary
Fig.
13a) than in plasma from the control (db/+) (Fig.
8a). As the
liver contributes to BACE1-dependent IRsol generation, BACE1
and IR expression were analyzed in this organ. BACE1 mRNA
and protein levels were increased in db/db mouse livers (Fig.
8b, c
and Supplementary Fig.
11b), suggesting increased BACE1
activity. Interestingly, IR mRNA levels were increased (Fig.
8b),
whereas the amount of mature IR was reduced (Fig.
8c and
Supplementary
Fig.
11b),
implying
that
transcription-independent mechanisms are involved in the regulation of
mature IR expression. Similar regulation of plasma IRsol levels,
liver IR and BACE1 mRNA levels, and protein amounts was
observed in high-fat diet (HFD) fed mice with impaired glucose
tolerance, compared with normal-fat diet fed mice
(Supplemen-tary Fig.
13a–d). For comparison, IR and BACE1 mRNA levels
were not increased in the epididymal fat of db/db and HFD fed
mice (Supplementary Fig.
13e).
Treatment of db/db mice with C3 increased the amount of
hepatic mature IR (+35%) (Fig.
8d and Supplementary Fig.
11c)
without altering IR mRNA levels (Fig.
8e). These results support
the notion that BACE1-dependent cleavage of IR contributes to
the reduced liver IR expression in db/db mice. However, C3
treatment had no impact on plasma IRsol levels (control
= 1 ±
0.29 AU (arbitrary units); BACE1 inhibitor
= 0.88 ± 0.42 AU) or
on blood glucose (control
= 18.2 ± 1.2 mmol/L; BACE1 inhibitor
= 17.8 ± 1.3 mmol/L).
Cleavage of IR in tumors. We compared cleavage efficiencies of
the two IR isoforms. Similar amounts of IRA and IRB were
over-expressed in HEK 293 cells (Fig.
9a), but the amount of IRsol in CM
of cells overexpressing IRA was approximately twice that in CM of
cells overexpressing IRB (Fig.
9b). Treatment of CM with PGNaseF
improved the detection of IRsol by immunoblot and showed that
IRB migrates slower than IRA, which was expected since the
α-subunit of IRB is 12-amino acids longer than that of IRA.
Overexpression of BACE1 increased shedding of IRA and IRB
by three- and twofold, respectively (Fig.
9c). In BACE1
overexpressing cells, the amounts of mature IRA and IRB were
similar; however, more IRctf was detected in IRA than IRB
overexpressing cells, and IRB was more highly expressed at the
cell surface than IRA (Fig.
9d). Furthermore, mature IRB was less
efficiently immunoprecipitated with inactive BACE1 than IRA
(Fig.
9e). These results show that BACE1-dependent cleavage of
IRA is more efficient than that of IRB.
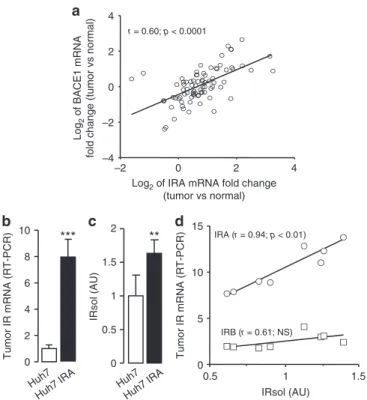
As overexpression of IR, with higher levels of IRA, are
frequently observed in malignant tumors, we determined whether
facilitated cleavage of IRA was observed in this context. We
first
examined expression levels of IR and BACE1 in 85 hepatocellular
carcinomas and paired the surrounding non-tumor liver tissues.
The majority of tumors (80%) had increased IRA mRNA, and
changes in tumor IRA expression were positively correlated with
BACE1 expression, suggesting that these tumors efficiently cleave
IRA and produce IRsol (Fig.
10a).
To highlight a potential relationship between tumor IRA
expression and IRsol generation, we xenotransplanted the
human hepatocarcinoma cell line Huh7 (native and
over-expressing IRA) in nude mice; and after tumor development,
tumor IR expression and plasma IRsol levels were measured.
Plasma
from
mice-bearing
IRA-overexpressing
tumors
(Fig.
10b) contained more IRsol than plasma from
mice-bearing tumors from native cells (Fig.
10c), while there was no
difference in mice body weight (23.3 ± 2.9 g vs 22.2 ± 1.6 g),
tumor volumes (1.23 ± 0.43 cm
3vs 1.26 ± 0.16 cm
3), and
BACE1 mRNA levels (1.0 ± 0.16 vs 1.05 ± 0.31). In tumors
originating from native Huh7 cells, IRA mRNA levels
accounted for 76 ± 6% of the total IR mRNA and correlated
with IRsol plasma levels (Fig.
10d). No association was observed
between IRB mRNA and IRsol plasma levels. These results
indicate that IRA expressed in a tumor is primarily responsible
for the production of IRsol detectable in plasma.
Discussion
Our results demonstrate that the protease BACE1 cleaves the
ectodomain of IR, thereby regulating its cell surface expression.
0 0.5 1 1.5 IRsol (AU)***
DON GlcN 25 mM glucose 5.5 mM glucose***
**
*
– – BACE1 25 5.5 Glucose (mM) GlcN – – DON Ig imm mat proIR IRβb
a
25 mM glucose 5.5 mM glucose 0 0.5 1 1.5 2 2.5 BACE1/proBACE1*
Fig. 5 Effect of glucose on IR cleavage and BACE1 expression. HEK 293 cells expressing IR and BACE1 were incubated for 24 h in media containing the indicated glucose concentrations, in the absence (−) or presence of deoxynorleucine (DON; 5 mM) or glucosamine (GlcN; 1 mM) then: a IRsol accumulated in the media was measured by ELISA;b IR and BACE1 were analyzed by immunoblot in total cell lysate or after BACE1 immunoprecipitation, respectively. Positions of the heavy chain of the precipitating antibody (Ig), immature (imm), and mature (mat) BACE1 are indicated. The graph shows the ratios BACE1/proBACE1 obtained from the quantification of seven different experiments; data from the same experiment are connected by a line. Data are means ± s.d. Statistical analyses were made using ANOVA, followed by Bonferonni’s test (a) and unpaired t-test (b). *p < 0.05; ***p < 0.001
This regulation occurs in vivo, with a significant contribution
from the liver and is particularly altered during diabetes.
We confirmed, as previously proposed, that IR undergoes
proteolysis that generates a soluble fragment (IRsol) composed of
its
α-subunits attached to portions of its extracellular β-subunits
20and a transmembrane fragment of its
β-subunits (IRctf), the
latter being fully degraded by the successive activities of
γ-secretase and proteasome
19,32. A screening of protease inhibitors
suggested that BACE1 is involved in IR cleavage. The selective
cleavage of IR by BACE1 was further confirmed by showing that
knockdown and overexpression of BACE1 reduced and increased
IR cleavage, respectively, whereas overexpression of BACE2 (a
close homolog of BACE1), ADAM10 or ADAM17 did not
increase IR cleavage. The involvement of BACE1 in IR cleavage is
further supported by the detection of a transient interaction
between the two proteins that necessarily precedes IR cleavage.
This interaction involves immature BACE1, which possesses
enzymatic activity
22. BACE1, IR and IRctf co-purify in Golgi/
TGN-enriched fractions. In addition IRsol is detectable in cell
lysates. Taken together, these
findings suggest that
BACE1-dependent IR cleavage occurs in the lumen of the Golgi/TGN,
thereby rationalizing detection of the interaction between the
proIR and immature BACE1. We hypothesize that these BACE1
and IR forms interact in the early secretory pathway before the
action of proprotein convertase in the TGN
22,43. Interestingly,
IRctf cleavage by
secretase also occurs in the TGN and, when
γ-secretase is inhibited, a fraction of the IRctf reaches the cell
surface. We show that reducing the glucose concentration
decreases IR cleavage, which is congruent with previous data
showing that BACE1 activity
44and IR shedding
45are stimulated
by high glucose levels. As previously described
45, we show that
regulation of IR cleavage by glucose involves O-GlcNacylation.
-50 -40 -200 -100 kDab
** Control BACE1–/– Control BACE1–/– Control BACE1–/– 0 1 2 3 Control BACE1–/– Control BACE1–/– proIR IRβ**
Densitometrya
IRsol (AU) Fed Fasted 0 0.5 1 1.5 IRsol (AU) 0 0.5 1 1.5 IRsol (AU) 0 0.5 1 1.5*
*
IRflox LIRKOc
– + – + C3***
*
*
pPKB/PKB Insulin(nM) 0 0.1 0 2 4 6 8 10 1 3 10 100 0 0.1 1 3 10 100 0 0.1 1 3 10 100 Control BACE1–/– (P < 0.0001, F-test)g
0.1 1 10 0 0.5 1 0 100 PDK4 mRNA (RT-PCR) Insulin (nM) (P < 0.01, F-test) IRβ proIR C3 (μM) 0 5 10 0 10 Humanprimary hepatocytesh
GAPDH β-actin IR 0.5 1 1.5 IRA IRB mRNA (RT-PCR)d
e
GAPDH proIR IRβControl BACE1–/– Control
BACE1–/– PTEN PKB β-actin pPKB Insulin (nM)
f
-40 kDa -60 -60Fig. 6 In vivo cleavage of IR by BACE1. IRsol was measured in the plasma from a liver-specific IR knockout mice (LIRKO; fed n = 4; fasted n = 5)and their floxed control (IRflox; fed n = 4; fasted n = 5), b BACE1−/−mice (n = 8) and their control littermates (n = 8). c IRsol was measured in the conditioned
media from control and BACE1−/−liver explants treated or not with the BACE1 inhibitor (C3).d Levels of IR, IRA, and IRB mRNA were measured by RT-PCR in control and BACE1−/−livers.e Levels of IR, PTEN, and GAPDH (loading control) were analyzed by immunoblot in control and BACE1−/−livers, a densitometric analysis of the proIR and IRβ bands normalized to GAPDH was performed (below the blot), values are expressed as fold over the means of the wild-type mice.f Primary hepatocytes isolated form control (n = 4) and BACE1−/−(n = 3) mice were stimulated for 10 min with the indicated concentration of insulin. A representative immunoblot of insulin-stimulated phosphorylation of PKB at Ser473is shown. The curves on the right of the
immunoblot are the normalized means ± s.e.m of the immunoblots (both curves differed significantly, p < 0.0001, F-test). g mRNA levels of PDK4 were measured by RT-PCR in control and BACE1−/−primary hepatocytes stimulated for 6 h with the indicated concentrations of insulin (both curves differed significantly, p < 0.01, F-test). h Human primary hepatocytes (two different preparations) were incubated for 40 h in the presence of the indicated concentrations of BACE1 inhibitor (C3), then IR and GAPDH or actin (taken as loading controls) were analyzed by immunoblot. Data are means ± s.d. Statistical analyses was made using Mann–Withney (a), unpaired t-test (b, d, e), ANOVA followed by Dunnett’s test (c) or F-test (f, g) *p < 0.05; **p < 0.01; ***p < 0.001
Furthermore, reducing glucose concentration decreases the
amount of immature BACE1, while increasing the mature form in
an O-GlcNacylation-dependent manner. Our interpretation is
that immature BACE1 cleaves IR and that high glucose triggers
the O-GlcNacylation processes that reduce the amount of BACE1
matured by proprotein convertases (without interfering with
proprotein convertase activity), thereby increasing IR cleavage
(Supplementary Fig.
14). Identification of the O-GlcNacylation
0 1 2 3 Gck mRNA (RT-PCR)**
a
0 0.5 1 1.5 2 2.5 Control Insulin EV Cont BACE1 –/– IR EV IR EV IR HEK 293**
**
b
Gck promoter activity Gck promoter activity
0 0.5 1 1.5 C3 Control HEK 293 BACE1
*
*
+ insulinc
Fig. 7 Regulation of glucokinase expression by IR amount. a Levels of GCK mRNA were measured by RT-PCR in control and BACE1−/−primary hepatocytes. Native HEK 293 cells (b) or HEK 293 cells overexpressing BACE1 (c) were transfected with empty vector (EV) or with IR coding vector together with human GCK promoter-driven Firefly luciferase and SV40-driven Renilla luciferase coding vectors where indicated, serum-deprived cells were treated with the BACE1 inhibitor (C3; 20μM) and then stimulated with insulin (2 nM, 7 h). Firefly and Renilla luciferase were measured in cell lysates, and GCK promoter activity was calculated as the ratio of Firefly/Renilla luciferase and expressed as fold over the situation without IR overexpression nor insulin stimulation. Data are means ± s.d. Statistical analyses were made using unpaired t-test (a) or ANOVA, followed by Bonferonni’s test (b, c). *p < 0.05; **p < 0.01 proIR IRβ GAPDH Saline C3 0 0.5 1 1.5 2
**
proIR IRβ Saline C3 Densitometryd
Saline 0 0.5 1 1.5 C3 mRNA (RT-PCR) IRe
0 0.5 1 1.5 2 IR BACE1 db + db /db***
***
b
mRNA (RT-PCR) 0 1 2 3 4 db + db /db**
IRsol (AU)a
db /+ db /db proIRc
BACE1 1 2 3 db + db /db proIR IRβ**
IRα**
BACE1**
Densitometry β-actin IRβ IRαFig. 8 IR cleavage in a mouse model of diabetes. a IRsol was measured in the plasma from db/db mice (n = 10) and from their control littermate (db/+; n = 10).b mRNA levels of IR and BACE1 were measured by RT-PCR in the liver. c Liver expression of IR, BACE1, andβ-actin (loading control) were analyzed by immunoblot; a densitometric analysis of the proIR, IRα, IRβ, and BACE1 bands was performed (right), values are expressed as fold over the means of the wild-type mice.d db/db mice were treated with saline or with BACE1 inhibitor (C3, 4 weeks), then liver expression of IR and GAPDH (loading control) were analyzed by immunoblot; a densitometric analysis of the proIR and IRβ bands was performed (right). e mRNA levels of IR were measured by RT-PCR in the liver of db/db mice treated with saline or with the BACE1 inhibitor (C3). Data are means ± s.d. Statistical analyses were made using unpaired t-test. **p < 0.01; ***p < 0.001
processes responsible for this regulation is beyond the scope of
the current work.
BACE1 interacts more with IRA than IRB, with IRA more
readily cleaved than IRB. The exon 11-encoded 12-amino acid
peptide in IRB may be responsible for the decreased interaction
between IRB and BACE1. Alternatively, the favored interaction
between BACE1 and IRA may be due to their coincident presence
in particular sub-membrane domains. Indeed, BACE1 and IR
were reported to be in lipid rafts
46–48and localization of IR
isoforms in separate lipid raft microdomains has been
documented
49,50.
The BACE1-dependent increased IR cleavage is associated with
decreased amounts of its mature form. Conversely, BACE1
reduction increases IR cell surface expression, resulting in an
insulin-dependent increased IR phosphorylation and enhanced
insulin signaling effectiveness as denoted by higher expression of
the insulin-stimulated immediate-early genes c-Fos and EGR-1.
These results are consistent with recent data that emphasize the
importance of the amount of cell surface IR in the control of IR
signaling
11,51,52.
We have demonstrated that IR is cleaved in the extracellular
region of its
β-subunits (between amino acids 933 and 956), a
region containing a predicted BACE1 target motif
27, and that a
peptide containing part of this sequence is cleaved in vitro by
recombinant soluble BACE1. However, amino acid substitutions
in this region of IR disrupt its intracellular trafficking, which
prevents the exact molecular identification of the BACE1
cleavage sequence but reveals the importance of the integrity of
this region in IR biology. Interestingly, despite its reduced
intracellular trafficking the IR mutant T
937M, reported in two
cases of Donohue syndrome
40,41, is efficiently cleaved by
BACE1. Consequently, inhibition of BACE1 increases the amount
of its mature form, which is phosphorylated upon insulin
stimulation.
The low levels of plasma IRsol of BACE1
−/−and of
liver-specific IR knockout mice validate the role of BACE1 in the
cleavage of IR in vivo and indicate that the liver contributes
significantly to IRsol plasma levels. Furthermore, IRsol release
from liver explants is reduced by deficiency or inhibition of
BACE1, confirming BACE1-dependent IR cleavage in the liver
and suggesting that this cleavage can be drug targeted. As
expected, more mature IR is detected in the liver of BACE1
−/−mice than in control mice. In addition, expression of the PKB
negative regulator PTEN is reduced in BACE1
−/−livers and since
high levels of IR decrease PTEN expression
42, it is conceivable
that the increased expression of IR in BACE1
−/−livers is partly
responsible for the low PTEN levels. Consequently, we suggest
that the increased insulin-dependent phosphorylation of PKB in
the liver of BACE1
−/−mice, that we have previously described
28,
involves both increased IR levels and derepression of PKB
phosphorylation. A higher level of IR is also observed in primary
BACE1
−/−hepatocytes with evidence of some enhanced insulin
signaling processes (raised PKB phosphorylation, repression of
PDK4 expression). BACE1
−/−hepatocytes also display increased
levels of GCK mRNA and we show that GCK promoter activity
depends on regulation of IR by BACE1 activity. Thus
BACE1-dependent regulation of liver IR levels may alter insulin
effec-tiveness. As we used primary hepatocytes that show normal
insulin sensitivity, some of the insulin effects may already be
optimal (repression of PEPCK, G6pase, and PGC1α) and not
improved by BACE1 deficiency. It is likely that diminished PTEN
levels underlying the derepression of PKB phosphorylation
con-tribute in increased basal levels of IR and PKB phosphorylation in
BACE1
−/−hepatocytes. However, despite the high basal PKB
proIR IRctf IRctfd
IRβ LE 0 10 20 30 40Cell surface IR MFI (x1000)
*
Lysate IP:HA proIR IRβ BACE1e
mat imm IRα PGNAseF IRα 0 0.5 1 1.5 IRsol (AU)b
***
proIR IRβa
GAPDHCont IRA IRB
IRA IRB IRA IRB IRA IRB IRA IRB
Cont IRA IRB Cont IRA IRB
IRA IRB
c
***
BACE1 0 1 2 3 4 IRsol (AU) IRA IRB BACE1i***
Fig. 9 BACE1-dependent cleavage of IRA and IRB. a HEK 293 cells were transfected with an empty vector (Cont) or with IRA or IRB expression vector, then IR and endogenous GAPDH expression were detected by immunoblot.b IRsol was measured in conditioned media of cell expressing IRA or IRB by ELISA (left) and by immunobloting of the conditioned media untreated or treated with PGNaseF.c Cells were transfected with the indicated combinations of IRA, IRB and BACE1, and inactive BACE1 (BACE1i) expression vectors; then IRsol was measured by ELISA in conditioned media.d BACE1 overexpressing cells were transfected with IRA or IRB expression vector and IR was detected by immunoblot (left) or at the cell surface byflow cytometry (right). LE indicates a long exposure of the immunoblot.e Inactive BACE1 was co-immunoprecipitated with IRA or IRB as described in Fig.2g. Immature (imm) and mature (mat) BACE1 are indicated. Data are means ± s.d. Statistical analyses were made using unpaired t-test. *p < 0.05; ***p < 0.001
phosphorylation, insulin-stimulated phosphorylation amplitude
is conserved, raising the total level of phosphorylated PKB.
Importantly, we show that BACE1-dependent IR cleavage also
occurs in human primary hepatocytes.
Mouse models of diabetes (db/db) and impaired glucose
tol-erance (HFD fed mice) have increased plasma levels of IRsol,
consistent with observations made in patients with diabetes
19,20.
BACE1 expression is increased in the livers of these mice, in
agreement with increased liver BACE1 activity in mice with
impaired glucose tolerance
28, and the amount of mature IR is
post-transcriptionally reduced. Treatment of db/db mice with C3
increases hepatic levels of the mature form of IR, while remaining
below (approximately half) of those of the control mice,
indi-cating that BACE1 activity is involved in the reduction of liver IR
expression that occurs during diabetes. Pharmacological
inhibi-tion of BACE1 is relatively ineffective in db/db mice as denoted by
no decrease in IRsol plasma levels, and lack of improvement in
glucose homeostasis, suggesting a role for leptin signaling
53.
However, whole-body deletion or inhibition of BACE1 improves
the insulin sensitivity of HFD fed mice
28,29. A neuron-specific
human BACE1 knockin mouse model provides evidence that
increased neuronal BACE1 expression is sufficient to cause
sys-temic diabetic complications
54. Therefore, peripheral metabolic
disturbances caused by increased BACE1 levels and activity may
be, at least in part, secondary to central impairment. Nevertheless,
during diabetes the BACE1-dependent cleavage of liver IR, by
reducing hepatic insulin sensitivity, may also contribute to
per-ipheral metabolic disorder. Taken together, our results support
the repurposing of BACE1 inhibitors, currently in clinical trials
for Alzheimer’s disease, to recover some active IR in the liver of
patients with diabetes, thus reducing hepatic insulin resistance.
A short period of fasting reduces IRsol plasma levels in wild
type but not in liver-specific IR knockout mice, suggesting that
IRsol plasma levels are regulated by the nutritional status and this
regulation predominantly involves BACE1-dependent cleavage of
liver IR. The hexosamine biosynthetic pathway responsible for
protein O-GlcNacylation plays a central role in sensing the
nutritional status of the cell
55and high global O-GlcNacylation
levels were reported in the liver of db/db and HFD fed mice
56.
Therefore, as shown in our cellular model herein, we propose that
in mice, O-GlcNacylation processes are the basis of regulation of
IR cleavage in the liver.
We and others have reported that tumors from different tissue
origin have increased expression of IRA
7,13, which may favor
resistance to conventional and targeted therapies by a variety of
mechanisms
7. We show that in human hepatocellular
carcino-mas, changes in IRA expression are positively correlated with
those of BACE1, implying that these tumors are competent to
cleave IR. In addition, xenograft experiments show that IRsol
plasma levels mainly depend on the expression levels of IRA in
the tumor. Taken together, our results may explain why IRsol
plasma levels are increased in patients with cancers (published in
patent WO 2004/097414) and suggest IRsol as a useful biomarker
for tumor IRA expression levels that could help diagnose and
monitor cancer evolution and even guide therapy.
In summary, our data demonstrate for the
first time that IR is a
novel substrate for BACE1 and that therapies targeting BACE1
inhibition could be an innovative treatment for diabetes and
other diseases characterized by insulin resistance. Moreover, IRsol
may also be considered a cancer biomarker and assist rational
decisions making in cancer disease management.
Methods
Reagents. Inhibitors of BACE1 (C3), presenilin (DAPT) and proprotein con-vertases (dec-RVKR-cmk) were purchased from Merck (Nottingham, UK). TMI1 was synthesized (Supplementary Methods). 6-diazo-5 oxo-L-Norleucine and GlcN
were from Sigma Aldrich. All other inhibitors, IR antibodies C-19, C-4, H-78 and phosphospecific (Tyr1162/11636), PTEN (A2B1), HA-probe (Y-11) and O-GlcNac
(CTD110.6) antibodies were from Santa Cruz Biotechnology (Santa Cruz, CA, USA). IR antibodies 18-44 and 83-7 (biotin labeled) were from Thermo Fisher Scientific. Antibodies specific for Golgin 97 (CDF4), PKB (C67E7), pPKB (193H12), Erk1/2 (9102), pErk1/2 (9101), Presenilin-1 (D39D1), Nicastrin (D38F9),β-actin (13E5), and GAPDH (D4C6R) were from Cell Signaling Tech-nology (Danvers, MA, USA). Anti-GFP (mixture of clones 7.1 and 13.1) was from Roche. Anti-BACE1 (B0681) and Anti-FlagM2 were from Sigma Aldrich. Expression vectors. The expression vectors for IRA, IRB, non-glycosylatable form of IRA, GFP-tagged IRβ, HA-tagged BACE1 and BACE2, ADAM17, ADAM10, TNF-α and the vectors containing human BACE1 shRNA were described else-where35,37,49,57–59. The intracellular fragment of IR was generated by PCR amplification and cloned into pcDNA3 expression vector. Mutated forms of IR (N933A, W936H, T937M, F942K/Y943K and A946-949), inactive form of BACE1
(D289A)47and mutated form of BACE1 (T47A) were created using the GeneArt
site-directed mutagenesis system (Thermo Fisher). Expression vector for IRβ N-terminally fused to Gaussia Luciferase was generated by homologous recombina-tion using the In-fusion cloning system (Clontech).
Cell culture and transfection. HEK 293 cells (Griptite 293 MSR) were from Thermo Fisher Scientific. CHO, HepG2 and Huh7 cell lines were from ATCC. The cells were maintained in culture as described by the manufacturers. No myco-plasma contamination was detected in any of the cultures. Transient and stable cell transfection were performed with PolyJet reagent (SignaGen Laboratories, Rock-ville, MD, USA) and Lipofectamine 3000 (Thermo Fisher), respectively, as specified by the manufacturers.
Mouse studies. Liver-specific insulin receptor knockout mice (LIRKO; Alb-Cre
+/−, IR lox/lox) mice and their littermateflox controls (IRflox; Cre−/−, IR lox/lox)
r = 0.60; p < 0.0001 –2 0 2 4 –4 –2 0 2 4
Log2 of IRA mRNA fold change (tumor vs normal)
Log
2
of BACE1 mRNA
fold change (tumor vs normal)
a
b
Tumor IR mRNA (RT-PCR)***
0 2 4 6 8 10c
**
IRsol (AU) 0 0.5 1 1.5 2 0.5 Huh7 Huh7 IRA Huh7 Huh7 IRA 1 1.5 0 5 10 15 IRsol (AU) Tumor IR mRNA (RT-PCR) IRA (r = 0.94; p < 0.01) IRB (r = 0.61; NS)d
Fig. 10 IR cleavage in tumors. a Pearson’s correlation of the changes in IRA mRNA levels in hepatocellular carcinoma vs. normal tissue with those of BACE1 (values are expressed in Log2). Pearson’s correlation coefficient (r)
and p-value are reported. b IR mRNA levels were measured by RT-PCR in tumors from native Huh7 cells and from Huh7 cells overexpressing IRA (Huh7 IRA).c IRsol was measured in the plasma of mice-bearing tumors from native Huh7 cells and from Huh7 cells overexpressing IRA (Huh7 IRA). Data are means ± s.d. **p < 0.01; ***p < 0.001. d Correlation of IRA (circles) and IRB (squares) mRNA levels in tumors from native Huh7 cells with IRsol plasma levels (IRsol values are expressed as fold over the mean). Pearson’s correlation coefficient (r) and p-value are reported (NS, no significant correlation)
were maintained on a mixed genetic background as previously described60,61, and housed with a 07:00–19:00 lights-on light cycle. Blood was collected at 14:00 from 2–3-month-old male mice in either the non-fasted state or after a 5 h fast and plasma was prepared. Animal experiments were performed with the approval of the Institutional Animal Care and Research Advisory Committee at Children’s Hos-pital Boston (USA).
BACE1−/−mice were previously described28. Blood was collected from overnight fasted mice by cardiac puncture then plasma was prepared. Liver was removed and pieces were snap frozen for ulterior analysis of IR expression level. The rest of the liver was minced into 2 mm per piece. Fifteen to twenty pieces of liver explants were incubated in DMEM with or without C3 (1μM) for 24 h in a humidified incubator at 37 °C. Medium was replaced and incubated for a further 24 h. Liver explants were collected, drained, and weighed; CM was collected and analyzed for IRsol content. Primary hepatocytes were isolated from adult mice using a collagenase method62. The cells were plated in M199 medium supplemented with 100μg/mL penicillin–streptomycin, 0.1% bovine serum albumin, 10% FBS, 200 nM dexamethasone, 100 nM triiodothyronine, 10 nM insulin, at a density of 2.5 × 10⁵cells/well in six-well plates. After attachment (3–4 h), hepatocytes were maintained in M199 medium with antibiotics and 100 nM dexamethasone for 16 h before use.
Experiments were performed at the University of Dundee (UK) in accordance to the Animal Scientific Procedures Act (1986), with approval of Universities of Dundee Ethic Committee.
Male db/db (BKS.Cg-m+/+Leprdb/J) and db/+(BKS.Cg-m+/−Leprdb/J) mice (Charles River Laboratories; Saint Germain Nuelles, France) were 10 weeks old at the time of killing. For in vivo BACE1 inhibition experiment, 8 weeks old db/db mice were randomly implanted with osmotic minipumps (Alzet; model 2004) containing C3 (10 mg/kg/day) or vehicle (50:50 DMSO/PBS) then killed 28 days later. Ten weeks old male C57Bl/6 mice (Charles River Laboratories; Saint Germain Nuelles, France) were randomly fed either a standard-fat diet (70% kcal carbohydrate, 10% kcal fat, 20% kcal protein, 3.68 kcal g−1, Special Diet Services, Witham, UK) or a HFD (20% kcal carbohydrate, 60% kcal fat, 20% kcal protein, 5.13 kcal g−1) for 16 weeks before killing. Blood and tissues were collected as described above. Experiments were performed at Aix Marseille University (France) in accordance to the European directive 2010/63/EU on the protection of animals used for scientific purposes and approved by the “Comité d'éthique en expérimentation animale de Marseille.”
Six-weeks old female (Hsd: athymic Nude-Foxn1nu) mice (Envigo) were inoculated s.c. in theflank with 2 × 10⁶Huh7 cells suspended in 50% Matrigel (BD Biosciences, San Jose, CA). After tumor development, mice were anesthetized by isoflurane inhalation, blood was collected by cardiac puncture and plasma was prepared. Tumors were removed, weighted, and snap frozen for ulterior analysis of IR expression level. Xenograft experiments were performed at Paris-Sorbonne University (France) in accordance to the European directive 2010/63/EU on the protection of animals used for scientific purposes and approved by the “Direction départementale des services vétérinaires de Paris.”
Human liver tissue specimens. Eighty-five hepatocellular carcinoma and paired adjacent non-tumor liver tissues were collected with informed consent from patients undergoing curative liver resection at the Saint-Antoine Hospital and stored in a tumor biobank (Pathology department, Saint-Antoine hospital) in accordance to the French laws and regulations (Commission Nationale de l’In-formatique et des Libertés no. 1913901 v0). Clinicopathologic characteristics of the 85 patients have been published previously63.
Enzymatic deglycosylation. N-linked carbohydrate residues were removed by incubating cell lysates or serum-free CM for 2 h at 37 °C with 1000 units of PNGaseF as described by the manufacturer (New England Biolabs, Beverly, MA, USA). ELISA. TNFα was measured in CM as described by the manufacturers (R&D Systems).
For the detection of IRsol, plasma or conditioned culture media were centrifuged to remove cells and cell debris thenfiltered through 0.2 μM nylon membrane (Ceveron MFU 500filter plate; Technoclone) to remove microparticles. ELISA plate (SpectraPlate-HB; Perkin Elmer) was coated with the monoclonal antibody 18-4464specific for the extracellular portion of the IRβ (2 μg/mL in Coating Buffer pH 7.4; Candor-Bioscience) overnight at 4 °C. The plate was washed twice with dilution buffer (Super Block Blocking buffer from Thermo Fisher Scientific + Tween 20 0.05%) then incubated 0.5 h at room temperature in dilution buffer. Diluted samples were incubated in wells overnight at 4 °C. After several washes, the biotinylated monoclonal antibody 83-764specific for the extracellular IRα-subunit (1/750 in dilution buffer) was incubated for 2 h at room temperature. After several washes, HRP-labeled streptavidin in dilution buffer was added and incubated 0.5 h. After several washes, a tyramide signal amplification protocol (Elast ELISA Perkin Elmer) was applied as described by the manufacturer. HRP substrate (TMB Super Sensitive One Component from SurModics) was added to the wells and OD was monitored at 650 nm until the high inter assay control reach a value of 0.5, then the reaction was stopped by adding equal volume 0.6 N sulfuric acid and OD was measured at 450 nm. Changes in OD 450 nm values were
expressed relative to the mean of reference values, which was set to 1. IRsol in the figures is thus expressed as AU.
Immunoblot. Identical volumes of microparticle-free CM (serum free) and plasma or identical amounts of total protein were heat-denatured and reduced (70 °C; 10 min) then submitted to SDS-PAGE separation on 4–12% gradient NuPAGE gels (Life Technologies, Saint Aubin, France) and transferred to polyvinylidenefluoride membranes. Membranes were blocked for 1 h in 5% BSA solution and incubated with the appropriate primary and HRP-conjugated secondary antibodies (1:1000 and 1:10,000 dilution, respectively). Immunodetections were performed using ECL reagent and image acquisition was performed by using a chemiluminescent CCD imager ImageQuant LAS 4000 (GE Healthcare, Velizy-Villacoublay, France). Densitometric analysis of the bands was performed with the ImageQuant TL software (GE Healthcare, Velizy-Villacoublay, France).
Flow cytometry. Cell surface expression of overexpressed IR was analyzed byflow cytometry (Accury C5) using the biotinylated anti IRα-subunit antibody (83-7) and streptavidin Alexafluor 488 (Thermo Fisher Scientific). Cells were gated on forward and side scatter to exclude dead cells, debris and aggregates.
Real-time PCR analysis. Total RNA was extracted using Nucleospin RNA Kit (Macherey-Nagel, Hoerdt, France), cDNA was synthesized from 0.5 µg of RNA using M-MLV reverse transcriptase (Life Technologies, Saint Aubin, France) and used for PCR amplification. RT-PCR were performed on the LightCycler 480 instrument (Roche Applied Science, Meylan, France) using the Eva Green MasterMix (Euro-medex, Souffelweyersheim, France). The comparative Ct method (2−(ΔΔCT)) was used to calculate the relative differences in mRNA expression. The acidic ribosomal phosphoprotein P0 or the hypoxanthine-guanine phosphoribosyltransferase was used as housekeeping gene. Primers sequences are available upon request. Changes were normalized to the mean of control values, which were set to 1.
Statistical analyses. All data were analyzed with GraphPad Prism software and individual statistical two-sided tests used are identified in the figure legends. P-values≤ 0.05 were considered statistically significant. Mice experiments were exploratory; there was no estimation to base the effective sample size. Data availability. The data supporting thefindings of this study are available within the article andSupplementary File, or available from the corresponding author on reasonable request.
Received: 28 July 2017 Accepted: 8 March 2018
References
1. Hubbard, S. R. The insulin receptor: both a prototypical and atypical receptor tyrosine kinase. Cold Spring Harb. Perspect. Biol. 5, a008946 (2013). 2. Seino, S. & Bell, G. I. Alternative splicing of human insulin receptor messenger
RNA. Biochem. Biophys. Res. Commun. 159, 312–316 (1989).
3. Frasca, F. et al. Insulin receptor isoform A, a newly recognized, high-affinity insulin-like growth factor II receptor in fetal and cancer cells. Mol. Cell. Biol. 19, 3278–3288 (1999).
4. McClain, D. A. Different ligand affinities of the two human insulin receptor splice variants are reflected in parallel changes in sensitivity for insulin action. Mol. Endocrinol. 5, 734–739 (1991).
5. Yamaguchi, Y. et al. Functional properties of two naturally occurring isoforms of the human insulin receptor in Chinese hamster ovary cells. Endocrinology 129, 2058–2066 (1991).
6. Denley, A. et al. Structural determinants for high-affinity binding of insulin-like growth factor II to insulin receptor (IR)-A, the exon 11 minus isoform of the IR. Mol. Endocrinol. 18, 2502–2512 (2004).
7. Belfiore, A. et al. Insulin receptor isoforms in physiology and disease: an updated view. Endocr. Rev. 38, 379–431 (2017).
8. Taylor, S. I. et al. Mutations in insulin-receptor gene in insulin-resistant patients. Diabetes Care 13, 257–279 (1990).
9. Olefsky, J. M. & Reaven, G. M. Decreased insulin binding to lymphocytes from diabetic subjects. J. Clin. Invest. 54, 1323–1328 (1974).
10. Olefsky, J. M. & Reaven, G. M. Insulin binding in diabetes. Relationships with plasma insulin levels and insulin sensitivity. Diabetes 26, 680–688 (1977). 11. Nagarajan, A. et al. MARCH1 regulates insulin sensitivity by controlling cell
surface insulin receptor levels. Nat. Commun. 7, 12639 (2016).
12. Song, R. et al. Central role of E3 ubiquitin ligase MG53 in insulin resistance and metabolic disorders. Nature 494, 375–379 (2013).
13. Chettouh, H. et al. Mitogenic insulin receptor-A is overexpressed in human hepatocellular carcinoma due to EGFR-mediated dysregulation of RNA splicing factors. Cancer Res. 73, 3974–3986 (2013).